Key Takeaways
Rightsizing compute alone reduces cloud costs by 20–40% in most environments — yet most teams skip it after initial setup.
Unmanaged data transfer and forgotten storage account for nearly 35% of unnecessary cloud spend in our optimization projects — more than idle compute.
Reserved Instances are not always the best choice: in fast-growing SaaS environments, Savings Plans outperform traditional RIs due to changing workload patterns.
Kubernetes clusters without cost controls are one of the fastest-growing sources of cloud waste in 2025–2026.
A FinOps governance model reduces cost drift by up to 60% over 12 months compared to ad-hoc optimization.
Cloud costs are the second-largest operational expense for most engineering-led companies — and the fastest-growing. According to the FinOps Foundation, organizations waste on average 32% of their cloud spend. That's not a vendor problem. It's a governance and execution problem.
I'm Roman Burdiuzha, co-founder and CTO at Gart Solutions, and I've personally led cloud cost optimization projects across 50+ environments — AWS, Azure, GCP, and hybrid — for SaaS, healthcare, fintech, and enterprise clients. The patterns are consistent, and the fixes are specific.
This guide goes beyond the standard "rightsize your VMs" advice. I'll share what we actually find when we audit cloud environments, which optimization levers deliver the most impact, and how to build a FinOps culture that prevents costs from growing back.
In this post, I'll share some practical tips to help you maximize the value of your cloud investments while minimizing unnecessary expenses.
[lwptoc]
Main Components of Cloud Costs — and What You're Likely Underestimating
Most cloud cost discussions focus on compute. In our experience, compute is rarely where the biggest leaks are. Here's what the full picture looks like:
Cost ComponentDescription% of Total Bill (Avg.)Optimization PotentialCompute (VMs / EC2 / Nodes)Virtual machines, container nodes, serverless invocations40–55%High (20–40% savings)StorageObject storage, block volumes, backups, snapshots15–25%High (30–60% with lifecycle policies)Data TransferEgress to internet, cross-region, cross-AZ10–20%Often overlooked; 25–40% reducibleDatabase ServicesManaged RDS, Aurora, Cosmos DB, BigQuery10–18%Medium–HighNetworkingLoad balancers, NAT gateways, VPNs, CDN5–10%Often invisible; NAT gateways are a frequent culpritKubernetes / Container OrchestrationControl plane, node groups, cluster autoscaling5–15% (growing fast)High with proper bin-packingUnused/Forgotten ResourcesUnattached EBS, idle load balancers, stale snapshots8–15%Near-total elimination possibleMain Components of Cloud Costs — and What You're Likely Underestimating
💡 From the Field — Roman Burdiuzha, CTO, Gart Solutions
"In our optimization work, the biggest source of waste isn't compute. Unmanaged data transfer and forgotten storage consistently account for nearly 35% of unnecessary cloud spend — more than idle VMs. Teams focus on rightsizing servers because it's visible in the dashboard. The egress bills hide in a line item most engineers don't open."
What a Cloud Cost Optimization Consulting Engagement Looks Like
Gart Solutions runs cloud cost optimization as a structured, time-boxed engagement rather than an open-ended advisory relationship — most clients start with a 2-week cloud cost audit before committing to implementation work.
Week 1: Discovery and waste detection. Pulling billing data, tagging coverage, and utilization metrics across every account to identify zombie resources, oversized instances, and untracked spend.
Week 2: Savings roadmap. A prioritized, quantified list of recommendations (rightsizing, commitment discounts, architecture changes) ranked by savings-to-effort ratio, not just a generic checklist.
Implementation (optional). Clients can take the roadmap to their own team or have Gart implement the highest-priority items directly, including setting up ongoing FinOps monitoring so savings don't silently erode over the following quarters.
Clients typically uncover 20-40% in recoverable cloud costs during the audit phase alone — before any architectural changes are made.
Step 1: Identify and Eliminate Zombie Resources
Before you optimize what's running, you need to eliminate what shouldn't be running at all. Zombie resources — orphaned compute, unattached disks, forgotten snapshots — are the lowest-hanging fruit in any cloud cost audit.
Cloud Waste Detection Framework
Resource TypeCommon Waste PatternDetection MethodPotential SavingsEBS Volumes (AWS)Unattached disks from terminated instancesAWS Cost Explorer → filter by "unattached"5–15% of storage billEC2 / VMsIdle instances (<5% CPU over 14 days)AWS Compute Optimizer / Azure Advisor10–30% of compute billSnapshotsNever deleted; retained indefinitelyScript: age > 90 days with no policy5–20% of storage billLoad BalancersPointing to no healthy targets (legacy environments)Check target group health metrics3–10% of networking billElastic IPs (AWS)Reserved but unattached to running instancesFilter: "not associated" in EC2 consoleMinor but easy winNAT GatewaysPer-GB processed data charge; often abused for internal trafficReview VPC Flow Logs; use VPC endpoints instead5–25% of networking billManaged DatabasesDev/test RDS instances running 24/7Tag review: environment=dev + always-on schedule10–40% of DB billCloud Waste Detection Framework
How to Run a Zombie Resource Audit (4-Step Process)
Enable tagging enforcement.Without tags, there's no way to identify resource ownership. Set mandatory tags:env,team,project,cost-center. Resources without these tags should trigger an alert.
Run idle resource detection.AWS Compute Optimizer, Azure Advisor, and Google Cloud Recommender all provide out-of-the-box idle resource flagging. Schedule a weekly review.
Audit snapshots and backups.Write a simple script (or use AWS Data Lifecycle Manager) to flag snapshots older than 90 days that have no attached policy.
Implement a "delete on idle" policy for dev/test.Environments that show zero connections for 72+ hours should auto-stop. Implement this using AWS Instance Scheduler or Azure DevTest Labs.
Potential Savings 15–35% of total bill
Implementation Difficulty Low
Time to Impact 1–2 weeks
Tools AWS Compute Optimizer, Azure Advisor, GCP Recommender
Step 2: Rightsizing — The #1 Lever Most Teams Misuse
Rightsizing is the practice of matching instance type and size to actual workload requirements. According to the FinOps Foundation, the average cloud environment runs at 14% CPU utilization. Most teams over-provision at initial deployment and never revisit.
How to Rightsize Effectively
The most common mistake is rightsizing once and treating it as done. Workloads change. A SaaS product that needed an r5.4xlarge at launch may only need an r5.xlarge 18 months later after engineering optimizations. We recommend a quarterly rightsizing review as part of your FinOps cycle.
AWS Rightsizing
Use AWS Compute Optimizer — it analyzes 14 days of CloudWatch metrics and recommends specific instance type changes, including cross-family migrations (e.g., from general-purpose M-series to compute-optimized C-series). Average savings from following these recommendations: 21–35% on compute.
Refer to the AWS Well-Architected Framework — Cost Optimization Pillar for the official decision framework.
Azure Rightsizing
Azure Advisor provides size recommendations under the "Cost" tab. Enable Azure Hybrid Benefit to reuse existing Windows Server and SQL Server licenses — this alone can reduce VM costs by up to 40% for Windows workloads without changing any infrastructure.
GCP Rightsizing
Google Cloud's Active Assist Recommender surfaces idle VM recommendations. Pair rightsizing with Committed Use Discounts (CUDs) — GCP's equivalent of Reserved Instances — for 1-year (37% off) or 3-year (55% off) commitments on Compute Engine.
🔍 What We See in Practice
"In 9 out of 10 environments we audit, the dev/staging infrastructure is provisioned at near-production scale. Downsizing dev environments to burstable instances (T3/T4g on AWS, B-series on Azure) typically saves $2,000–$15,000/month with zero impact on developer productivity."
Potential Savings 20–40% of compute bill
Implementation Difficulty Medium
Time to Impact 2–4 weeks
Step 3: Commitment Discounts — Reserved Instances vs. Savings Plans
This is one of the most nuanced decisions in cloud cost optimization. The right answer depends on your workload growth trajectory, not just your current usage.
AWS: Reserved Instances vs. Savings Plans
DimensionReserved Instances (RIs)Compute Savings PlansCommitment typeSpecific instance family, size, regionDollar amount per hour (flexible)FlexibilityLow (convertible RIs help but are complex)High (applies across EC2, Lambda, Fargate)Max discountUp to 72% (1yr, all upfront)Up to 66% (1yr, all upfront)Best forStable, predictable workloads on specific instance typesFast-growing SaaS, variable instance mixRiskStranded capacity if workloads changeSlight discount gap vs. RIsAWS: Reserved Instances vs. Savings Plans
💡 Contrarian Take — From 50+ Projects
"Reserved Instances are not always the best choice. In fast-growing SaaS environments, Savings Plans consistently outperform traditional RI strategies because your instance mix changes as you scale. We've seen companies with stranded RIs costing them more than they saved. Unless your workload is stable and well-defined, start with Savings Plans."
Azure: Reserved Instances + Hybrid Benefit
Azure Reserved VM Instances offer discounts of up to 72% versus pay-as-you-go for 3-year terms. Stack this with Azure Hybrid Benefit (bring your own Windows/SQL license) and you can achieve blended savings of 55–80% on eligible workloads. See the Azure Hybrid Benefit documentation for eligibility.
GCP: Committed Use Discounts
GCP's Committed Use Discounts apply to specific amounts of vCPU and memory. Unlike AWS, GCP also offers automatic sustained use discounts — if you run an instance for more than 25% of a month, GCP automatically applies a discount of up to 30%, with no commitment required.
Potential Savings 30–72% vs. on-demand
Implementation Difficulty Low-Medium
Time to ImpactImmediate after purchase
Step 4: Spot and Preemptible Instances — Where They Work and Where They Fail
Spot instances (AWS), preemptible VMs (GCP), and Spot VMs (Azure) offer discounts of up to 90% versus on-demand pricing. But using them incorrectly costs more than you save.
Workloads That Are a Good Fit for Spot
Batch data processing jobs (ETL, ML training, image processing)
CI/CD build agents (stateless, interruptible)
Big data analytics (Spark, Hadoop on EMR)
Rendering and media encoding pipelines
Non-production test environments
Workloads That Are NOT a Good Fit
Stateful databases or caches
Long-running, stateful microservices without checkpointing
Any workload with a strict SLA under 99.9%
Production API servers without session externalization
Production-Grade Spot Architecture
The right pattern for using spot in production is a mixed instance group: use Spot for the majority of capacity (60–80%), with On-Demand or Reserved instances as a baseline (20–40%). This is natively supported via AWS Auto Scaling Groups, Azure VMSS, and GCP Managed Instance Groups.
Potential SavingsUp to 90% vs. on-demand (60–80% realistically for mixed fleets)
Implementation DifficultyMedium-High
Risk Interruption; requires fault-tolerant architecture
Step 5: Kubernetes Cost Optimization — The Emerging Frontier
If your organization runs Kubernetes, this is now one of your most important optimization areas. Kubernetes makes it easy to over-provision resources — and most teams do. Namespace-level visibility doesn't come for free, and without it, containers silently consume capacity that no one claims.
The Four Kubernetes Cost Levers
1. Set Accurate Resource Requests and Limits
The #1 source of Kubernetes waste: pods with overestimated resource requests. Kubernetes schedules based on requests, not actual usage. If a pod requests 4 CPU but only uses 0.3 CPU, you're paying for 4 CPU of node capacity. Use CNCF-recommended tooling like Vertical Pod Autoscaler (VPA) to automatically right-size requests based on observed usage.
2. Cluster Autoscaler and Karpenter (AWS)
Cluster Autoscaler adds and removes nodes based on pending pod scheduling. Karpenter (AWS-native) goes further: it provisions nodes just-in-time with the exact instance type needed for pending workloads, then consolidates underloaded nodes automatically. Teams using Karpenter report 20–40% additional savings over Cluster Autoscaler alone.
3. Namespace-Level Cost Allocation
Use tools like OpenCost (CNCF project) or Kubecost to allocate costs by namespace, team, and workload. Without this, you have no visibility into which teams or services are driving Kubernetes spend. Implement chargeback or showback policies to create accountability.
4. Bin-Packing and Node Pool Optimization
Right-size your node pools. A cluster running many small pods on large nodes wastes capacity. Segment workloads by resource profile: compute-intensive (C-series), memory-intensive (R-series), and general-purpose (M/N-series). Use node affinity and taints to route workloads to appropriately sized pools.
📊 What We See in Kubernetes Audits
"In Kubernetes environments we audit, the average resource utilization is 18% CPU and 25% memory relative to cluster capacity. The biggest lever is almost always resource request rightsizing — not the cluster autoscaler settings. Fix the requests first, then tune the autoscaler."
Potential Savings30–60% of Kubernetes infrastructure cost
Implementation DifficultyHigh
Time to Impact2–6 weeks
Step 6: Storage Lifecycle and Data Transfer — The Hidden Cost Drivers
Storage and data transfer are the "silent" cost categories that grow unchecked while engineering teams focus on compute. In fast-growing companies, storage costs compound: they never go down, and without lifecycle policies, they accelerate.
Storage Optimization: Lifecycle Policies First
Cloud providers offer intelligent tiering that automatically moves data between storage classes based on access frequency:
ProviderHot TierCool / InfrequentArchiveTypical Savings vs. HotAWS S3S3 StandardS3 Standard-IA / Intelligent-TieringS3 Glacier / Deep ArchiveUp to 95% (Glacier Deep Archive)Azure BlobHotCoolArchiveUp to 90% (Archive tier)GCP Cloud StorageStandardNearline / ColdlineArchiveUp to 94% (Archive)Storage Optimization: Lifecycle Policies First
Quick win: Enable S3 Intelligent-Tiering for any bucket containing data older than 30 days that you don't actively manage. It requires zero code changes and typically reduces S3 costs by 20–40% within 90 days.
Data Transfer: The Overlooked Multiplier
AWS, Azure, and GCP all charge for data leaving the cloud (egress). Within the cloud, cross-AZ data transfer has a per-GB charge that is easy to miss at scale.
Most common data transfer waste patterns:
Services in different AZs communicating over private IPs (charged cross-AZ)
S3 data being read by EC2 in a different region
NAT Gateway processing charges for traffic that could use VPC Endpoints
Database reads going through Application Load Balancers unnecessarily
Fix: Enable VPC Endpoints for S3 and DynamoDB (free on AWS). This routes traffic within the AWS network and eliminates NAT Gateway processing charges for those services — a change that takes 10 minutes and saves thousands of dollars per month in high-egress environments.
Potential Savings30–60% of storage; 25–40% of data transfer
Implementation DifficultyLow–Medium
Time to Impact1–3 weeks
Step 7: FinOps Governance — How to Prevent Cost Drift
The reason cloud costs grow back after optimization is governance failure — not technical failure. Without a FinOps model, every new deployment is an uncontrolled cost event. The FinOps Foundation defines three stages of cloud financial maturity:
FinOps Maturity StageCharacteristicsWhere Most Companies AreCrawlBasic tagging, cost alerts, monthly review meetings~60% of organizationsWalkRI/Savings Plan coverage >70%, chargeback by team, weekly reporting~30% of organizationsRunReal-time cost allocation, automated anomaly detection, cloud unit economics~10% of organizationsFinOps Governance — How to Prevent Cost Drift
The Minimum Viable FinOps Model
You don't need a full FinOps team to start. Here's what we implement for mid-size engineering organizations as a minimum effective governance model:
Cloud Tagging Strategy. Enforce tags: team,env,project,cost-center. Use AWS Service Control Policies (SCPs), Azure Policy, or GCP Organization Policies to block resource creation without mandatory tags. No tags = no deployment.
Weekly Cost Review Cadence. A 30-minute weekly review with the engineering lead and finance stakeholder reviewing the previous week's cost delta. The goal is to catch anomalies within 7 days, not at month-end.
Budget Alerts with Escalation. Set alerts at 80% and 100% of monthly budget for each cost center. Route to Slack or email. Include an escalation path — who is responsible for investigation within 24 hours?
Anomaly Detection. AWS Cost Anomaly Detection (free), Azure Cost Management anomaly alerts, or Google Cloud Billing Budget alerts provide automated anomaly detection. Configure them. They catch accidental resource launches that would otherwise appear only at month-end.
Cloud Unit Economics. Define a cost-per-unit metric for your product: cost per active user, cost per API call, cost per transaction processed. Track this metric monthly. When your revenue grows faster than your cloud cost-per-unit, you have a healthy scaling model.
Multi-Account Cost Governance
If you operate across multiple AWS accounts or Azure subscriptions, consolidated billing and AWS Organizations / Azure Management Groups are essential. Use cost allocation tags at the management account level to see spend by account, region, and service in a single view. This is especially important for MSPs and companies with dev/staging/production account separation.
Cost Drift ReductionUp to 60% over 12 months vs. ad-hoc approach
Implementation DifficultyMedium
Time to Value30–60 days to establish; ongoing
Step 8: Serverless and Multi-Cloud Cost Strategy
Serverless: True Cost-Per-Use, With Caveats
Serverless computing (AWS Lambda, Azure Functions, GCP Cloud Run) offers genuine pay-per-execution billing — you pay only when code runs. For event-driven, low-to-medium throughput workloads, this is often 60–80% cheaper than always-on compute. But serverless has hidden costs at scale:
Cold start latency requires mitigation strategies (provisioned concurrency adds cost)
High-throughput Lambda at millions of requests/day can exceed EC2 cost — run the math before assuming serverless is cheaper
Data transfer from Lambda still incurs egress charges — serverless doesn't eliminate networking costs
Multi-Cloud Cost Arbitrage
True multi-cloud cost arbitrage — placing workloads on the cheapest provider dynamically — is operationally complex and usually not worth the engineering investment for most companies. The better approach is strategic multi-cloud placement: use each provider where it has a genuine advantage.
ProviderStrongest Cost-Efficiency AreasAWSSpot Instances for batch compute; S3 at scale; broadest RI/SP optionsAzureHybrid Benefit for existing Windows/SQL licenses; M365-integrated workloadsGCPBigQuery for analytics; sustained-use discounts without commitment; Preemptible VMsMulti-Cloud Cost Arbitrage
Real-World Case Studies: Measurable Outcomes
Case Study 1: AWS Cost Optimization for an Entertainment SaaS Platform
Context: A mid-size entertainment software platform running on AWS with $180,000/month cloud spend. The environment had grown organically over 5 years with no formal cost governance.
Findings from audit:
38% of EC2 instances were oversized by at least 2 sizes (CPU utilization <8%)
$22,000/month in unattached EBS volumes and unused snapshots
No Reserved Instance coverage (100% on-demand)
Dev environment running 24/7 at production scale
Actions taken:
Rightsized EC2 fleet: migrated from M5.4xlarge to M5.xlarge for 60% of instances
Automated dev environment shutdown (8pm–8am weekdays; full shutdown weekends)
Purchased 1-year Compute Savings Plans at 55% coverage
Implemented S3 Intelligent-Tiering for media assets bucket (1.2PB)
Eliminated unattached EBS and legacy snapshots
Results: 41% reduction in monthly cloud spend within 60 days. Monthly bill went from $180,000 to $106,000. Annualized saving: $888,000.
Case Study 2: Azure Cost Optimization for a Software Development Company
Context: A software development company with 120 developers running Azure at $45,000/month, experiencing 25% month-over-month cost growth with no visibility into which projects were driving spend.
Findings from audit:
No tagging — impossible to attribute costs to projects or teams
Windows VMs not using Azure Hybrid Benefit (all had eligible licenses)
SQL Server managed instances running at <20% utilization
Multiple abandoned resource groups from completed projects
Actions taken:
Enforced mandatory tagging policy via Azure Policy
Enabled Azure Hybrid Benefit across all eligible VMs and SQL instances (38% of fleet)
Rightsized SQL Managed Instances; moved two to elastic pools
Deleted abandoned resource groups after ownership review
Implemented project-level cost centers with weekly reporting to team leads
Results: 33% cost reduction within 45 days. Bill reduced from $45,000 to $30,000/month. Month-over-month growth stabilized to <5%. Full cost visibility achieved for the first time.
Case Study 3: Kubernetes Cost Optimization for a Cloud-Native SaaS
Context: A SaaS company running 8 Kubernetes clusters across AWS EKS with $95,000/month in infrastructure costs. Engineering team reported the clusters felt "too expensive" but couldn't identify where the spend was going.
Findings from audit:
Average cluster utilization: 17% CPU, 23% memory
Pod resource requests set to "defaults" — 2 CPU, 4GB memory per pod, regardless of workload
No Cluster Autoscaler; node counts static
All nodes on On-Demand; no Spot integration
Actions taken:
Deployed Vertical Pod Autoscaler in recommendation mode; rightsized all pod requests
Implemented Karpenter; consolidated from 8-node clusters to 4-5 nodes
Migrated batch workloads and CI/CD agents to Spot node groups
Deployed OpenCost for namespace-level cost attribution
Results: 48% reduction in Kubernetes infrastructure cost. Bill reduced from $95,000 to $49,000/month within 90 days.
Main Components of Cloud Costs
ComponentDescriptionCompute InstancesCost of virtual machines or compute instances used in the cloud.StorageCost of storing data in the cloud, including object storage, block storage, etc.Data TransferCost associated with transferring data within the cloud or to/from external networks.NetworkingCost of network resources like load balancers, VPNs, and other networking components.Database ServicesCost of utilizing managed database services, both relational and NoSQL databases.Content Delivery Network (CDN)Cost of using a CDN for content delivery to end users.Additional ServicesCost of using additional cloud services like machine learning, analytics, etc.Table Comparing Main Components of Cloud Costs
Are you looking for ways to reduce your cloud operating costs? Look no further! Contact Gart today for expert assistance in optimizing your cloud expenses.
10 Cloud Cost Optimization Strategies
Here are some key strategies to optimize your cloud spending:
Analyze Current Cloud Usage and Costs
Analyzing your current cloud usage and costs is an essential first step towards optimizing your cloud operating costs. Start by examining the cloud services and resources currently in use within your organization. This includes virtual machines, storage solutions, databases, networking components, and any other services utilized in the cloud. Take stock of the specific configurations, sizes, and usage patterns associated with each resource.
Once you have a comprehensive overview of your cloud infrastructure, identify any resources that are underutilized or no longer needed. These could be instances running at low utilization levels, storage volumes with little data, or services that have become obsolete or redundant. By identifying and addressing such resources, you can eliminate unnecessary costs.
Dig deeper into your cloud costs and identify the key drivers behind your expenditure. Look for patterns and trends in your usage data to understand which services or resources are consuming the majority of your cloud budget. It could be a particular type of instance, high data transfer volumes, or storage solutions with excessive replication. This analysis will help you prioritize cost optimization efforts.
During this analysis phase, leverage the cost management tools provided by your cloud service provider. These tools often offer detailed insights into resource usage, costs, and trends, allowing you to make data-driven decisions for cost optimization.
Optimize Resource Allocation
Optimizing resource allocation is crucial for reducing cloud operating costs while ensuring optimal performance.
Leverage Autoscaling
Adopt Reserved Instances
Utilize Spot Instances
Rightsize Resources
Optimize Storage
Assess the utilization of your cloud resources and identify instances or services that are over-provisioned or underutilized. Right-sizing involves matching the resource specifications (e.g., CPU, memory, storage) to the actual workload requirements. Downsize instances that are consistently running at low utilization, freeing up resources for other workloads. Similarly, upgrade underpowered instances experiencing performance bottlenecks to improve efficiency.
Take advantage of cloud scalability features to align resources with varying workload demands. Autoscaling allows resources to automatically adjust based on predefined thresholds or performance metrics. This ensures you have enough resources during peak periods while reducing costs during periods of low demand. Autoscaling can be applied to compute instances, databases, and other services, optimizing resource allocation in real-time.
Reserved instances (RIs) or savings plans offer significant cost savings for predictable or consistent workloads over an extended period. By committing to a fixed term (e.g., 1 or 3 years) and prepaying for the resource usage, you can achieve substantial discounts compared to on-demand pricing. Analyze your workload patterns and identify instances that have steady usage to maximize savings with RIs or savings plans.
For workloads that are flexible and can tolerate interruptions, spot instances can be a cost-effective option. Spot instances are spare computing capacity offered at steep discounts (up to 90% off on AWS) compared to on-demand prices. However, these instances can be reclaimed by the cloud provider with little notice, making them suitable for fault-tolerant, interruptible tasks.
When optimizing resource allocation, it's crucial to continuously monitor and adjust your resource configurations based on changing workload patterns. Leverage cloud provider tools and services that provide insights into resource utilization and performance metrics, enabling you to make data-driven decisions for efficient resource allocation.
Implement Cost Monitoring and Budgeting
Implementing effective cost monitoring and budgeting practices is crucial for maintaining control over cloud operating costs.
Take advantage of the cost management tools and features offered by your cloud provider. These tools provide detailed insights into your cloud spending, resource utilization, and cost allocation. They often include dashboards, reports, and visualizations that help you understand the cost breakdown and identify areas for optimization. Familiarize yourself with these tools and leverage their capabilities to gain better visibility into your cloud costs.
Configure cost alerts and notifications to receive real-time updates on your cloud spending. Define spending thresholds that align with your budget and receive alerts when costs approach or exceed those thresholds. This allows you to proactively monitor and control your expenses, ensuring you stay within your allocated budget. Timely alerts enable you to identify any unexpected cost spikes or unusual patterns and take appropriate actions.
Set a budget for your cloud operations, allocating specific spending limits for different services or departments. This budget should align with your business objectives and financial capabilities. Regularly review and analyze your cost performance against the budget to identify any discrepancies or areas for improvement. Adjust the budget as needed to optimize your cloud spending and align it with your organizational goals.
By implementing cost monitoring and budgeting practices, you gain better visibility into your cloud spending and can take proactive steps to optimize costs. Regularly reviewing cost performance allows you to identify potential cost-saving opportunities, make informed decisions, and ensure that your cloud usage remains within the defined budget.
Remember to involve relevant stakeholders, such as finance and IT teams, to collaborate on budgeting and align cost optimization efforts with your organization's overall financial strategy.
Use Cost-effective Storage Solutions
To optimize cloud operating costs, it is important to use cost-effective storage solutions.
Begin by assessing your storage requirements and understanding the characteristics of your data. Evaluate the available storage options, such as object storage and block storage, and choose the most suitable option for each use case. Object storage is ideal for storing large amounts of unstructured data, while block storage is better suited for applications that require high performance and low latency. By aligning your storage needs with the appropriate options, you can avoid overprovisioning and optimize costs.
Implement data lifecycle management techniques to efficiently manage your data throughout its lifecycle. This involves practices like data tiering, where you classify data based on its frequency of access or importance and store it in the appropriate storage tiers. Frequently accessed or critical data can be stored in high-performance storage, while less frequently accessed or archival data can be moved to lower-cost storage options. Archiving infrequently accessed data to cost-effective storage tiers can significantly reduce costs while maintaining data accessibility.
Cloud providers often provide features such as data compression, deduplication, and automated storage tiering. These features help optimize storage utilization, reduce redundancy, and improve overall efficiency. By leveraging these built-in optimization features, you can lower your storage costs without compromising data availability or performance.
Regularly review your storage usage and make adjustments based on changing needs and data access patterns. Remove any unnecessary or outdated data to avoid incurring unnecessary costs. Periodically evaluate storage options and pricing plans to ensure they align with your budget and business requirements.
Employ Serverless Architecture
Employing a serverless architecture can significantly contribute to reducing cloud operating costs.
Embrace serverless computing platforms provided by cloud service providers, such as AWS Lambda or Azure Functions. These platforms allow you to run code without managing the underlying infrastructure. With serverless, you can focus on writing and deploying functions or event-driven code, while the cloud provider takes care of resource provisioning, maintenance, and scalability.
One of the key benefits of serverless architecture is its cost model, where you only pay for the actual execution of functions or event triggers. Traditional computing models require provisioning resources for peak loads, resulting in underutilization during periods of low activity. With serverless, you are charged based on the precise usage, which can lead to significant cost savings as you eliminate idle resource costs.
Serverless platforms automatically scale your functions based on incoming requests or events. This means that resources are allocated dynamically, scaling up or down based on workload demands. This automatic scaling eliminates the need for manual resource provisioning, reducing the risk of overprovisioning and ensuring optimal resource utilization. With automatic scaling, you can handle spikes in traffic or workload without incurring additional costs for idle resources.
When adopting serverless architecture, it's important to design your applications or functions to take full advantage of its benefits. Decompose your applications into smaller, independent functions that can be executed individually, ensuring granular scalability and cloud cost optimization.
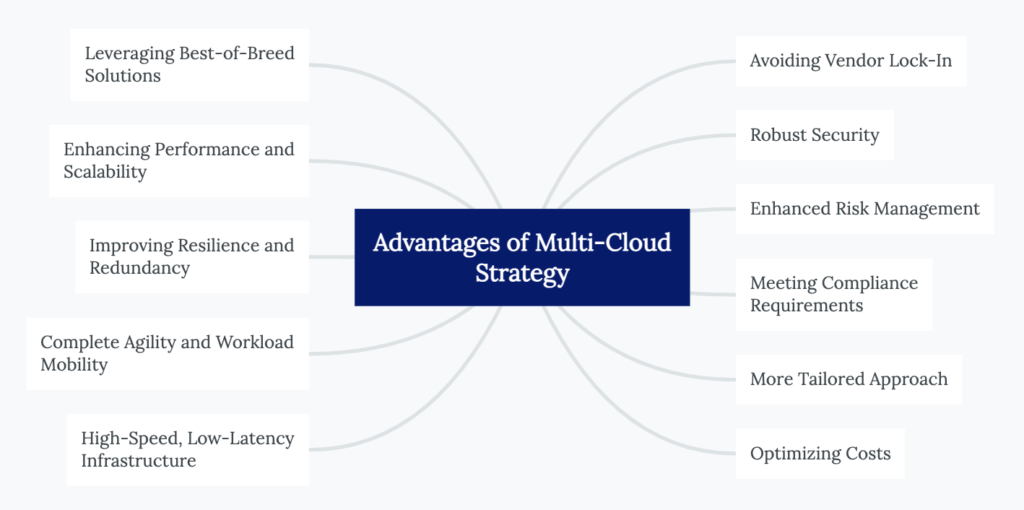
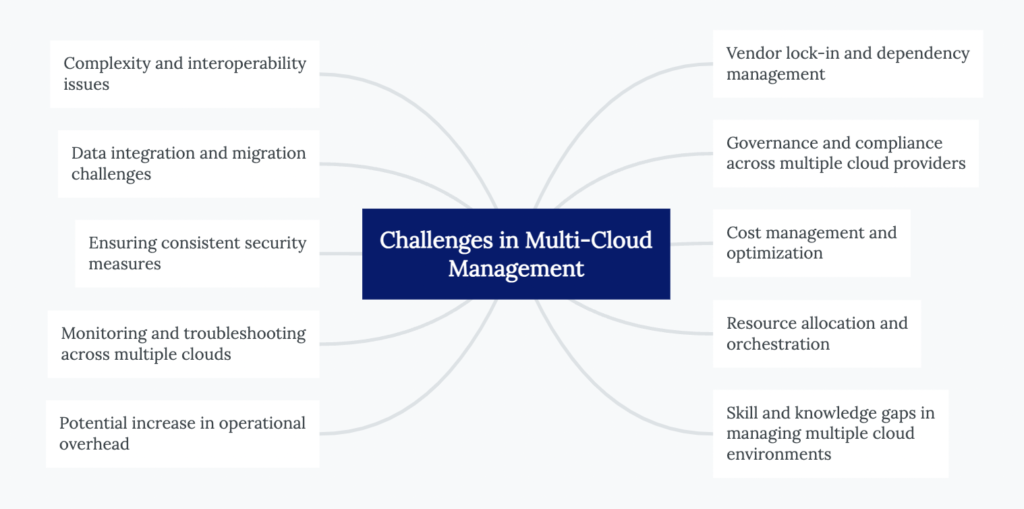
Consider Multi-Cloud and Hybrid Cloud Strategies
Considering multi-cloud and hybrid cloud strategies can help optimize cloud operating costs while maximizing flexibility and performance.
Evaluate the pricing models, service offerings, and discounts provided by different cloud providers. Compare the costs of comparable services, such as compute instances, storage, and networking, to identify the most cost-effective options. Take into account the specific needs of your workloads and consider factors like data transfer costs, regional pricing variations, and pricing commitments. By leveraging competition among cloud providers, you can negotiate better pricing and optimize your cloud costs.
Analyze your workloads and determine the most suitable cloud environment for each workload. Some workloads may perform better or have lower costs in specific cloud providers due to their specialized services or infrastructure. Consider factors like latency, data sovereignty, compliance requirements, and service-level agreements (SLAs) when deciding where to deploy your workloads. By strategically placing workloads, you can optimize costs while meeting performance and compliance needs.
Adopt a hybrid cloud strategy that combines on-premises infrastructure with public cloud services. Utilize on-premises resources for workloads with stable demand or data that requires local processing, while leveraging the scalability and cost-efficiency of the public cloud for variable or bursty workloads. This hybrid approach allows you to optimize costs by using the most cost-effective infrastructure for different aspects of your data processing pipeline.
Automate Resource Management and Provisioning
Automating resource management and provisioning is key to optimizing cloud operating costs and improving operational efficiency.
Infrastructure-as-code (IaC) tools such as Terraform or CloudFormation allow you to define and manage your cloud infrastructure as code. With IaC, you can express your infrastructure requirements in a declarative format, enabling automated provisioning, configuration, and management of resources. This approach ensures consistency, repeatability, and scalability while reducing manual efforts and potential configuration errors.
Automate the process of provisioning and deprovisioning cloud resources based on workload requirements. By using scripting or orchestration tools, you can create workflows or scripts that automatically provision resources when needed and release them when they are no longer required. This automation eliminates the need for manual intervention, reduces resource wastage, and optimizes costs by ensuring resources are only provisioned when necessary.
Auto-scaling enables your infrastructure to dynamically adjust its capacity based on workload demands. By setting up auto-scaling rules and policies, you can automatically add or remove resources in response to changes in traffic or workload patterns. This ensures that you have the right amount of resources available to handle workload spikes without overprovisioning during periods of low demand. Auto-scaling optimizes resource allocation, improves performance, and helps control costs by scaling resources efficiently.
It's important to regularly review and optimize your automation scripts, policies, and configurations to align them with changing business needs and evolving workload patterns. Monitor resource utilization and performance metrics to fine-tune auto-scaling rules and ensure optimal resource allocation.
Optimize Data Transfer and Bandwidth Usage
Optimizing data transfer and bandwidth usage is crucial for reducing cloud operating costs.
Analyze your data flows and minimize unnecessary data transfer between cloud services and different regions. When designing your architecture, consider the proximity of services and data to minimize cross-region data transfer. Opt for services and resources located in the same region whenever possible to reduce latency and data transfer costs. Additionally, use efficient data transfer protocols and optimize data payloads to minimize bandwidth usage.
Employ content delivery networks (CDNs) to cache and distribute content closer to your end users. CDNs have a network of edge servers distributed across various locations, enabling faster content delivery by reducing the distance data needs to travel. By caching content at edge locations, you can minimize data transfer from your origin servers to end users, reducing bandwidth costs and improving user experience.
Implement data compression and caching techniques to optimize bandwidth usage. Compressing data before transferring it between services or to end users reduces the amount of data transmitted, resulting in lower bandwidth costs. Additionally, leverage caching mechanisms to store frequently accessed data closer to users or within your infrastructure, reducing the need for repeated data transfers. Caching helps improve performance and reduces bandwidth usage, particularly for static or semi-static content.
Evaluate Reserved Instances and Savings Plans
It is important to evaluate and leverage Reserved Instances (RIs) and Savings Plans provided by cloud service providers.
Analyze your historical usage patterns and identify workloads or services with consistent, predictable usage over an extended period. These workloads are ideal candidates for long-term commitments. By understanding your long-term usage requirements, you can determine the appropriate level of reservation coverage needed to optimize costs.
Reserved Instances (RIs) and Savings Plans are cost-saving options offered by cloud providers. RIs allow you to reserve instances for a specified term, typically one to three years, at a significantly discounted rate compared to on-demand pricing. Savings Plans provide flexible coverage for a specific dollar amount per hour, allowing you to apply the savings across different instance types within the same family. Evaluate your usage patterns and purchase RIs or Savings Plans accordingly to benefit from the cost savings they offer.
Cloud usage and requirements may change over time, so it is crucial to regularly review your reserved instances and savings plans. Assess if the existing reservations still align with your workload demands and make adjustments as needed. This may involve modifying the reservation terms, resizing or exchanging instances, or reallocating savings plans to different services or instance families. By optimizing your reservations based on evolving needs, you can ensure that you maximize cost savings and minimize unused or underutilized resources.
Continuously Monitor and Optimize
Monitor your cloud usage and costs regularly to identify opportunities for cloud cost optimization. Analyze resource utilization, identify underutilized or idle resources, and make necessary adjustments such as rightsizing instances, eliminating unused services, or reconfiguring storage allocations. Continuously assess your workload demands and adjust resource allocation accordingly to ensure optimal usage and cost efficiency.
Cloud service providers frequently introduce new cost optimization features, tools, and best practices. Stay informed about these updates and enhancements to leverage them effectively. Subscribe to newsletters, participate in webinars, or engage with cloud provider communities to stay up to date with the latest cost optimization strategies. By taking advantage of new features, you can further optimize your cloud costs and take advantage of emerging cost-saving opportunities.
Create awareness and promote a culture of cost consciousness and cloud cost Optimization across your organization. Educate and train your teams on cost optimization strategies, best practices, and tools. Encourage employees to be mindful of resource usage, waste reduction, and cost-saving measures. Establish clear cost management policies and guidelines, and regularly communicate cost-saving success stories to encourage and motivate cost optimization efforts.
Real-World Results
Beyond the Spot VM and storage examples above, Gart's AWS cost optimization and CI/CD automation work for an entertainment software platform combined several of these strategies (rightsizing, commitment discounts, pipeline efficiency) into a single engagement — a useful reference for what a combined, multi-strategy engagement looks like in practice rather than any single tactic applied alone.
Conclusion: Cloud Cost Optimization
By taking a proactive approach to cloud cost optimization, businesses can not only reduce their expenses but also enhance their overall cloud operations, improve scalability, and drive innovation. With careful planning, monitoring, and optimization, businesses can achieve a cost-effective and efficient cloud infrastructure that aligns with their specific needs and budgetary goals.
Elevate your business with our Cloud Consulting Services! From migration strategies to scalable infrastructure, we deliver cost-efficient, secure, and innovative cloud solutions. Ready to transform? Contact us today.
Author Fedir
Fedir Kompaniiets
Co-founder & CEO, Gart Solutions · Cloud Architect & DevOps Consultant
Fedir is a technology enthusiast with over a decade of diverse industry experience. He co-founded Gart Solutions to address complex tech challenges related to Digital Transformation, helping businesses focus on what matters most — scaling. Fedir is committed to driving sustainable IT transformation, helping SMBs innovate, plan future growth, and navigate the "tech madness" through expert DevOps and Cloud managed services. Connect on LinkedIn.
Site Reliability Engineering (SRE) monitoring and application monitoring are two sides of the same coin: both exist to keep complex distributed systems reliable, performant, and transparent. For engineering teams managing microservices, Kubernetes, and cloud-native architectures, knowing what to measure—and how to act on it—is the difference between a 15-minute incident and an all-night outage.
This guide explains how the four Golden Signals serve as the foundation of production-grade application monitoring, how to connect them to SLIs, SLOs, and error budgets, and how to build dashboards and alerting workflows that actually reduce your MTTR.
KEY TAKEAWAYS
Golden Signals (latency, errors, traffic, saturation) are the universal language of SRE application monitoring across any tech stack.
Connecting signals to SLIs and SLOs turns raw metrics into reliability commitments your team can own.
Alert thresholds must be derived from baseline data and SLOs—the examples in this article are illustrative starting points, not universal rules.
After implementing Golden Signals, Gart clients have reduced MTTR by up to 60% within two months. Read the full case study context below.
What is SRE Monitoring?
SRE monitoring is the practice of continuously observing the health, performance, and availability of software systems using the methods and principles defined by Google's Site Reliability Engineering discipline. Unlike traditional system monitoring—which often tracks dozens of low-level infrastructure metrics—SRE monitoring is intentionally opinionated: it focuses on the signals that directly reflect user experience and system reliability.
At its core, SRE monitoring answers three questions at all times:
Is the system currently serving users correctly?
How close are we to breaching our reliability commitments (SLOs)?
Which service or component is responsible when something breaks?
This user-centric orientation is what separates SRE monitoring from generic infrastructure monitoring. An SRE team does not alert on "CPU at 80%"—they alert when that CPU spike is burning through their monthly error budget faster than expected.
Application Monitoring in the SRE Context
Application monitoring is the discipline of tracking how software applications behave in production: response times, error rates, throughput, resource consumption, and end-user experience. In an SRE context, application monitoring is the primary layer where Golden Signals are measured and where the gap between infrastructure health and user experience becomes visible.
A database node may be running at 40% CPU—perfectly healthy by infrastructure standards—while every query takes 4 seconds because of a missing index. Infrastructure monitoring shows green; application monitoring shows a latency crisis. This is why SRE teams invest heavily in application-level telemetry: it captures what infrastructure metrics miss.
Modern application monitoring spans three pillars:
Metrics — numerical time-series data (latency percentiles, error counts, RPS).
Logs — structured event records that capture request context and error detail.
Traces — distributed request journeys that map latency across service boundaries.
The Golden Signals framework unifies these pillars into four actionable categories that any team can monitor, regardless of their technology stack.
The Four Golden Signals in SRE
SRE principles streamline application monitoring by focusing on four metrics—latency, errors, traffic, and saturation—collectively known as Golden Signals. Instead of tracking hundreds of metrics across different technologies, this focused framework helps teams quickly identify and resolve issues.
Latency:Latency is the time it takes for a request to travel from the client to the server and back. High latency can cause a poor user experience, making it critical to keep this metric in check. For example, in web applications, latency might typically range from 200 to 400 milliseconds. Latency under 300 ms ensures good user experience; errors >1% necessitate investigation. Latency monitoring helps detect slowdowns early, allowing for quick corrective action.
Errors:Errors refer to the rate of failed requests. Monitoring errors is essential because not all errors have the same impact. For instance, a 500 error (server error) is more severe than a 400 error (client error) because the former often requires immediate intervention. Identifying error spikes can alert teams to underlying issues before they escalate into major problems.
Traffic:Traffic measures the volume of requests coming into the system. Understanding traffic patterns helps teams prepare for expected loads and identify anomalies that might indicate issues such as DDoS attacks or unplanned spikes in user activity. For example, if your system is built to handle 1,000 requests per second and suddenly receives 10,000, this surge might overwhelm your infrastructure if not properly managed.
Saturation:Saturation is about resource utilization; it shows how close your system is to reaching its full capacity. Monitoring saturation helps avoid performance bottlenecks caused by overuse of resources like CPU, memory, or network bandwidth. Think of it like a car's tachometer: once it redlines, you're pushing the engine too hard, risking a breakdown.
Why Golden Signals Matter
Golden Signals provide a comprehensive overview of a system's health, enabling SREs and DevOps teams to be proactive rather than reactive. By continuously monitoring these metrics, teams can spot trends and anomalies, address potential issues before they affect end-users, and maintain a high level of service reliability.
SRE Golden Signals help in proactive system monitoring
SRE Golden Signals are crucial for proactive system monitoring because they simplify the identification of root causes in complex applications. Instead of getting overwhelmed by numerous metrics from various technologies, SRE Golden Signals focus on four key indicators: latency, errors, traffic, and saturation.
By continuously monitoring these signals, teams can detect anomalies early and address potential issues before they affect the end-user. For instance, if there is an increase in latency or a spike in error rates, it signals that something is wrong, prompting immediate investigation.
What are the key benefits of using "golden signals" in a microservices environment?
The "golden signals" approach is especially beneficial in a microservices environment because it provides a simplified yet powerful framework to monitor essential metrics across complex service architectures.
Here’s why this approach is effective:
▪️Focuses on Key Performance Indicators (KPIs)
By concentrating on latency, errors, traffic, and saturation, the golden signals let teams avoid the overwhelming and often unmanageable task of tracking every metric across diverse microservices. This strategic focus means that only the most crucial metrics impacting user experience are monitored.
▪️Enhances Cross-Technology Clarity
In a microservices ecosystem where services might be built on different technologies (e.g., Node.js, DB2, Swift), using universal metrics minimizes the need for specific expertise. Teams can identify issues without having to fully understand the intricacies of every service’s technology stack.
▪️Speeds Up Troubleshooting
Golden signals quickly highlight root causes by filtering out non-essential metrics, allowing the team to narrow down potential problem areas in a large web of interdependent services. This is crucial for maintaining service uptime and a seamless user experience.
SRE Monitoring vs. Observability vs. Application Performance Monitoring (APM)
These three terms are often used interchangeably, but they refer to distinct practices with different scopes. Understanding where they overlap—and where they diverge—helps teams invest in the right tooling and processes.
DimensionSRE MonitoringObservabilityApplication Monitoring (APM)Primary questionAre we meeting our reliability targets?Why is the system behaving this way?How is this application performing right now?Core signalsGolden Signals + SLIs/SLOsLogs, metrics, traces (full telemetry)Response time, throughput, error rate, ApdexAudienceSRE / on-call engineersPlatform engineering, DevOps, SREDev teams, operations, managementTypical toolsPrometheus, Grafana, PagerDutyOpenTelemetry, Jaeger, ELK StackDatadog, New Relic, Dynatrace, AppDynamicsScopeService reliability & error budgetsFull system internal stateApplication transaction performanceSRE Monitoring vs. Observability vs. Application Performance Monitoring (APM)
In practice, mature engineering organizations treat these as complementary layers. Golden Signals surface what is wrong quickly; observability tooling explains why; APM dashboards give development teams actionable detail at the code level.
SLIs, SLOs, and Error Budgets in SRE Monitoring
Golden Signals generate raw measurements. SLIs and SLOs transform those measurements into reliability commitments that the business can understand and engineering teams can own.
Service Level Indicators (SLIs)
An SLI is a quantitative measure of a service behavior directly derived from a Golden Signal. For example:
Availability SLI: percentage of requests that return a non-5xx response.
Latency SLI: percentage of requests served in under 300ms (P95).
Throughput SLI: percentage of expected message batches processed within the SLA window.
Service Level Objectives (SLOs)
An SLO is the target value for an SLI over a rolling window. A well-formed SLO looks like: "99.5% of requests must return a non-5xx response over a rolling 28-day window." SLOs are the bridge between Golden Signals and business impact. When your SLO says 99.5% availability and you are at 99.2%, you are burning error budget—and that is the signal your team needs to prioritize reliability work over new features.
Error Budgets
An error budget is the allowable amount of unreliability defined by your SLO. For a 99.5% availability SLO over 28 days, the error budget is 0.5% of all requests—roughly 3.6 hours of complete downtime equivalent. When the error budget is healthy, teams can ship changes confidently. When it is depleted or burning fast, the SRE team has a data-driven mandate to freeze releases and focus on reliability.
Practical tip: Track error budget burn rate alongside your Golden Signals dashboard. A burn rate of 1x means you are consuming the budget at exactly the rate your SLO allows. A burn rate of 3x means you will exhaust your budget in one-third of the SLO window — an immediate escalation trigger.
How to Monitor Microservices Using Golden Signals
Monitoring microservices requires a disciplined approach in environments where dozens of services interact across different technology stacks. Golden Signals provide a clear framework for tracking system health across these distributed systems.
Step 1: Define Your Observability Pipeline per Service
Each microservice should expose telemetry for all four Golden Signals. Integrate them directly with your SLI definitions from day one:
Latency — measure P50, P95, and P99 request duration per service.
Errors — capture 4xx/5xx HTTP codes and application-level exceptions separately.
Traffic — monitor RPS, message throughput, and connection concurrency.
Saturation — track CPU, memory, thread pool usage, and queue depth.
Step 2: Choose a Unified Monitoring Stack
Popular platforms for production-grade application monitoring in microservices include:
Prometheus + Grafana — open-source, highly customizable, excellent for Kubernetes environments.
Datadog / New Relic — full-stack observability with built-in Golden Signals support and auto-instrumentation.
OpenTelemetry — CNCF-backed standard for vendor-neutral telemetry instrumentation.
Step 3: Isolate Service Boundaries
Group Golden Signals by service so you can detect where a problem originates rather than just knowing that something is wrong:
MicroserviceLatency (P95)Error RateTrafficSaturationAuth220ms1.2%5k RPS78% CPUPayments310ms3.1%3k RPS89% MemoryNotifications140ms0.4%12k RPS55% CPU
Step 4: Correlate Signals with Distributed Tracing
Use distributed tracing to map requests across services. Tools like Jaeger or Zipkin let you trace latency across hops, find the exact service causing error spikes, and visualize traffic flows and bottlenecks. A latency spike in the Payments service that traces back to a slow DB query is far more actionable than "P95 latency is high."
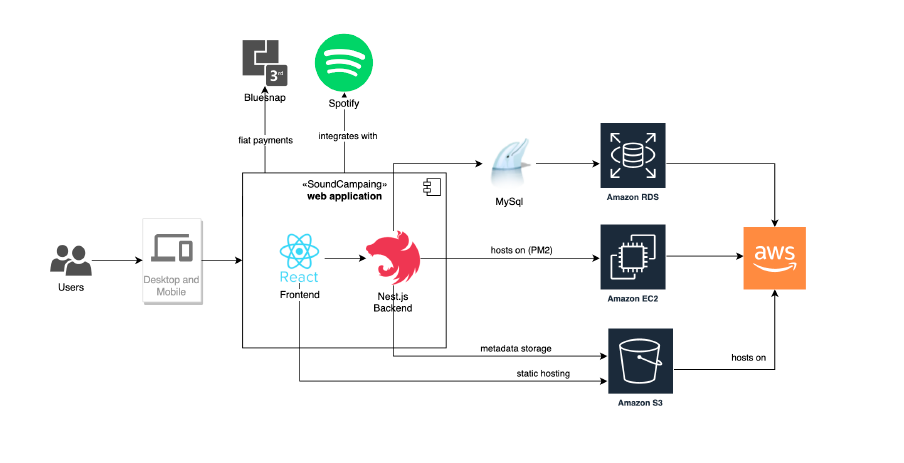
Learn how these principles apply in practice from our Centralized Monitoring case study for a B2C SaaS Music Platform.
Step 5. Automate Alerting with Context
Set thresholds and anomaly detection for each signal:
Latency > 500ms? Alert DevOps
Saturation > 90%? Trigger autoscaling
Error Rate > 2% over 5 mins? Notify engineering and create an incident ticket
Alerting Principles for SRE Teams
Effective application monitoring is only as useful as the alerting layer that translates signals into human action. Alert fatigue is one of the most common—and costly—failure modes in SRE programs. These principles help teams alert on what matters without overwhelming the on-call engineer.
Alert on Symptoms, Not Causes
Alert when the user experience is degraded (latency SLO is burning), not when a machine metric crosses a threshold. "CPU at 80%" is a cause; "P95 latency exceeding 500ms for 5 minutes" is a symptom your SLO cares about.
Use Error Budget Burn Rate as Your Primary Alert
A fast burn rate (e.g., 3x or 6x) on your error budget is a better paging condition than raw signal thresholds. It tells you not just that something is wrong, but how urgently you need to act based on your reliability commitments.
Sample Alert Thresholds (Illustrative Only)
SignalSample ThresholdSuggested ActionUrgencyLatency (P95)>500ms for 5 minPage on-call SREHighError Rate>2% over 5 minCreate incident ticket + notify engineeringHighSaturation (CPU)>90% for 10 minTrigger autoscaling policyMediumError Budget Burn3× rate for 1 hourIncident call, feature freeze considerationCritical
Methodology note: These thresholds are starting-point illustrations. Your production values should be calibrated against your own service baselines, user SLAs, and SLO definitions. A payment service tolerates far less latency than an async batch job.
Practical Application: Using APM Dashboards for SRE Monitoring
Application Performance Management (APM) dashboards integrate Golden Signals into a single view, allowing teams to monitor all critical metrics simultaneously. The operations team can use APM dashboards to get real-time insights into latency, errors, traffic, and saturation—reducing the cognitive load during incident response.
The most valuable APM features for SRE teams include:
One-hop dependency views — shows only the immediate upstream and downstream services of a failing component, dramatically narrowing the root-cause investigation scope and reducing MTTR.
Centralized Golden Signals panels — all four signals per service in one view, eliminating tool-switching during incidents.
SLO burn rate overlays — trend lines showing how quickly the error budget is being consumed, integrated alongside raw Golden Signals.
Proactive anomaly detection — ML-powered tools like Datadog and Dynatrace flag statistically unusual patterns before thresholds breach.
What is the Significance of Distinguishing 500 vs. 400 Errors in SRE Monitoring?
The distinction between 500 and 400 errors in application monitoring is fundamental to correct incident prioritization. Conflating them inflates your error rate SLI and may generate alerts that do not reflect actual service degradation.
Error TypeCauseSeveritySRE Response500 — Server errorSystem or application failureHighImmediate investigation, possible incident declaration400 — Client errorBad input, expired auth token, invalid requestLowerMonitor trends; investigate only on sustained spikes
A good SLI definition for errors counts only server-side failures (5xx) against your reliability budget. A sudden 400-error spike may signal a client SDK bug, a bot campaign, or a broken authentication flow—all worth investigating, but none of them are a service outage.
SRE Monitoring Dashboard Best Practices
A well-structured SRE dashboard makes or breaks incident response. It is not about displaying all available data—it is about surfacing the right insights at the right time. See the official Google SRE Book on monitoring for the principles that underpin these practices.
1. Prioritize Golden Signals and SLO Burn Rate at the Top
Place latency (P50/P95), error rate (%), traffic (RPS), and saturation front and center. Add SLO burn rate immediately below so engineers can assess reliability impact at a glance without scrolling.
2. Use Visual Cues Consistently
Color-code thresholds (green / yellow / red), use sparklines for trend visualization, and heatmaps to identify saturation patterns across clusters or availability zones.
3. Segment by Environment and Service
Separate production, staging, and dev views. Within production, segment by service or team ownership and by availability zone. This isolation dramatically reduces the time to pinpoint which service is responsible during an incident.
4. Link Metrics to Logs and Traces
Make your dashboards navigable: a latency spike should be one click away from the related trace in Jaeger, and a spike in errors should link directly to filtered log output in Kibana or Grafana Loki.
5. Provide Role-Appropriate Views
Use templating (Grafana variables, Datadog template variables) to serve multiple audiences from a single dashboard: SRE/on-call engineers need real-time signal detail; engineering teams need per-service deep dives; leadership needs SLO health summaries.
6. Treat Dashboards as Living Documents
Prune panels that nobody uses, reassess thresholds quarterly against updated baselines, and add deployment or incident annotations so that future engineers understand historical anomalies in context.
How Gart Implements SRE Monitoring in 30–60 Days
Generic best practices are helpful, but implementation details are where most teams struggle. Here is how Gart's SRE team approaches application monitoring engagements from day one, based on hands-on delivery experience across SaaS, cloud-native, and distributed environments—reviewed by Fedir Kompaniiets, Co-founder at Gart Solutions, who has designed monitoring and observability systems across multiple industries.
Days 1–14: Baseline and Instrumentation
Audit existing telemetry: what is already collected, what is missing, what is noisy.
Instrument all services with OpenTelemetry or native exporters for all four Golden Signals.
Deploy Prometheus + Grafana or connect to the client's existing observability platform.
Establish baseline latency, error rate, and saturation profiles per service under normal load.
Days 15–30: SLIs, SLOs, and Initial Alerting
Define SLIs for each critical service in collaboration with product and engineering stakeholders.
Draft SLOs and calculate initial error budgets based on business risk tolerance.
Configure symptom-based alerts (burn rate, not raw thresholds) with PagerDuty or Opsgenie routing.
Stand up the first three dashboards: overall service health, per-service Golden Signals, SLO burn rate.
Days 31–60: Noise Reduction and Handover
Tune alert thresholds against the observed baseline to eliminate alert fatigue.
Remove noisy, low-signal alerts that were generating false pages.
Integrate distributed tracing for the highest-traffic services.
Run a simulated incident to validate the monitoring stack end-to-end before handover.
Deliver runbooks and on-call documentation tied to each alert condition.
Real outcome: After implementing Golden Signals and SLO-based alerting for a B2C SaaS platform, the client reduced MTTR by 60% within two months. The primary driver was eliminating alert fatigue (previously 80+ daily alerts, reduced to 8 actionable ones) and linking every alert to a runbook with a clear first-responder action. Read the full context: Centralized Monitoring for a B2C SaaS Music Platform.
Watch How we Built "Advanced Monitoring for Sustainable Landfill Management"
Conclusion
Ready to take your system's reliability and performance to the next level? Gart Solutions offers top-tier SRE Monitoring services to ensure your systems are always running smoothly and efficiently. Our experts can help you identify and address potential issues before they impact your business, ensuring minimal downtime and optimal performance.
Gart Solutions · Expert SRE Services
Is Your Application Monitoring Ready for Production?
Engineering teams that invest in proper SRE monitoring and application monitoring reduce MTTR, protect error budgets, and ship with confidence. Gart's SRE team has designed and deployed monitoring stacks for SaaS platforms, Kubernetes-native environments, fintech, and healthcare systems.
60%
MTTR reduction for SaaS clients
30
Days to working SLO dashboards
99.9%
Availability target for managed clients
Our services cover the full monitoring lifecycle — from telemetry instrumentation and Golden Signal dashboards to SLO definition, alert tuning, and on-call runbooks.
Golden Signals Setup
SLI / SLO Definition
Prometheus + Grafana
Alert Tuning
Distributed Tracing
Kubernetes Monitoring
Incident Runbooks
Talk to an SRE Expert
Explore Monitoring Services
B2C SaaS Music Platform
Centralized monitoring across global infrastructure — 60% MTTR reduction in 2 months.
Digital Landfill Platform
Cloud-agnostic monitoring for IoT emissions data with multi-country compliance.
Fedir Kompaniiets
Co-founder & CEO, Gart Solutions · Cloud Architect & DevOps Consultant
Fedir is a technology enthusiast with over a decade of diverse industry experience. He co-founded Gart Solutions to address complex tech challenges related to Digital Transformation, helping businesses focus on what matters most — scaling. Fedir is committed to driving sustainable IT transformation, helping SMBs innovate, plan future growth, and navigate the "tech madness" through expert DevOps and Cloud managed services. Connect on LinkedIn.
[lwptoc]
ChatOps is a unique approach in DevOps, especially when work moves to a shared chat environment. It lets you run commands directly in the chat, and everyone can see the command history, interact with it, and learn from it. This sharing of information and processes benefits the entire team.
Whether it's deploying code, managing server resources, monitoring charts, sending SMS notifications, controlling clusters, or running basic commands, ChatOps allows you to do these tasks right from the chat platform. It simplifies communication with commands like "!deploy," providing a clear overview of your complex CI/CD process. This enhances visibility and reduces complexity during deployment.
In this article, we'll explore the importance of ChatOps for DevOps teams, highlighting its benefits and how it improves collaboration and communication. Whether you're new to ChatOps or looking to improve your current practices, this guide offers insights on effectively using ChatOps in your DevOps workflows.
What is ChatOps?
ChatOps is a collaborative model that smoothly combines people, tools, processes, and automation into a clear workflow. This interconnected flow gathers tasks, ongoing work, and completed work in one place, manned by individuals, bots, and relevant tools. ChatOps' transparency tightens the feedback loop, improves information sharing, and encourages better collaboration among teams, positively impacting team culture and creating cross-training opportunities.
While collaboration through conversations isn't new, ChatOps is its digital-age version—a blend of proven collaboration methods with the latest technology. The result is a straightforward fusion that can potentially revolutionize how we work.
Conversations drive collaboration, learning, and innovation, fueling human progress. The pace of progress is accelerating rapidly, though it may be too subtle to fully grasp in a single lifetime. The world is experiencing exponential collaboration, with each passing year seeing an increased rate of cooperation.
Key Concepts of ChatOps
ChatOps, a key concept in team collaboration, acts as a central hub for communication. It brings team members, tools, and processes into one chat platform, making discussions, decisions, and task execution seamless. This approach boosts coordination, reduces context-switching, and enhances team productivity.
Automation Integration
ChatOps revolves around integrating automation and bots into the chat environment. Automation tools and scripts help automate routine tasks, execute commands, and trigger workflows directly from the chat platform. Bots act as virtual team members, handling repetitive tasks and providing information, freeing up human resources for more complex work.
Real-time Sharing and Transparency
ChatOps prioritizes real-time information sharing. Team members can stay updated on ongoing tasks and projects through conversations, commands, and notifications within the chat platform. This immediacy reduces decision-making delays, fostering transparency, collaboration, and quick responses to incidents or workflow changes.
DevOps Alignment
ChatOps aligns closely with DevOps principles and practices. It promotes collaboration, communication, and shared responsibility among developers, operations teams, and stakeholders in the software development lifecycle. By integrating DevOps methodologies into the chat environment, ChatOps facilitates seamless collaboration, streamlines continuous integration and delivery processes, and enhances overall efficiency and software development quality.
Ready to revolutionize your workflows with ChatOps? Get in touch with Gart to explore their successful use cases and experience in streamlining processes.
Successful Use Cases of ChatOps - Beyond Risk's Experience
Harnessing our extensive knowledge of ChatOps technologies, Gart has crafted an all-encompassing automation framework meticulously designed to meet the specific presale needs of Beyond Risk. Our team has devised an interactive process, allowing non-technical executives to effortlessly create dynamic and fully customized environments.
About the client:
To facilitate real-time communication and updates, Gart integrated Slack as the primary communication channel. All action results were delivered directly to the designated Slack channel, ensuring stakeholders were promptly informed about the request status.
The implementation utilized Slack API for interactive flow, AWS Lambda for business logic, and GitHub Action + Terraform cloud for infrastructure automation. By incorporating a notification step, Gart ensured visibility into the success or failure of the Terraform infrastructure automation processes.
Read more: Streamlining Presale Processes with ChatOps Automation
Need ChatOps for your business? Contact Gart today and discover how they successfully streamlined presale processes through automation.
Implementing ChatOps in Practice
To implement ChatOps effectively, focus on selecting the right chat tools, integrating automation, setting communication guidelines, and promoting cross-functional collaboration.
Choose the Right Chat Tools
Start by picking user-friendly and scalable chat tools like Slack, Microsoft Teams, or Mattermost. Evaluate their integration capabilities and security features to ensure they align with your team's needs.
Integrate Automation and Bots Maximize
ChatOps by integrating automation tools and bots into your chosen chat platform. Explore options like Hubot, ChatOps-enabled plugins, or custom solutions to automate tasks, execute commands, and enhance productivity.
Establish Clear Communication
Ensure successful ChatOps by defining its purpose and expectations within your team. Set clear guidelines for chat channels, naming conventions, and tagging to keep conversations organized. Encourage concise and context-rich messaging to reduce noise.
Promote Cross-Functional Collaboration
Foster collaboration among diverse team members by using ChatOps. Encourage developers, operations, and QA teams to share knowledge, collaborate, and contribute. By breaking down silos, ChatOps facilitates faster issue resolution and collective problem-solving.
5 Best ChatOps Tools to Streamline Devs' Work in 2024
When selecting ChatOps tools, consider factors such as ease of use, integration capabilities with your existing toolset, security features, and scalability to ensure they align with your team's requirements and objectives.
Slack is a popular chat platform widely used for ChatOps. It provides a rich set of features, including real-time messaging, file sharing, and integrations with various tools and services. Slack's robust API and extensive integration capabilities make it a versatile choice for implementing ChatOps workflows.
Microsoft Teams is another widely adopted collaboration platform suitable for ChatOps. It offers chat-based communication, audio/video conferencing, and seamless integration with other Microsoft products like Azure DevOps and Office 365. Teams' integration with Power Automate allows for building automated workflows directly within the platform.
Mattermost is an open-source, self-hosted chat platform that provides a secure and customizable environment for ChatOps. With its focus on privacy and data control, Mattermost is ideal for organizations with strict security requirements. It offers features like threaded conversations, file sharing, and integration with popular DevOps tools.
Hubot is an automation framework designed specifically for ChatOps. It can be integrated with various chat platforms and programmed to execute commands, automate tasks, and provide information on demand. Hubot supports a wide range of scripts and plugins, making it flexible and customizable for different ChatOps workflows.
ChatOps-enabled Tools
Many existing DevOps tools have built-in ChatOps capabilities or integrations with popular chat platforms. For example, tools like Jenkins, GitLab, and GitHub provide plugins or webhooks that allow for triggering builds, deployments, and other actions directly from chat platforms. These integrations help consolidate information and actions in a single location, enhancing collaboration and visibility.
Future Trends in ChatOps
Integration with AI and Natural Language Processing
As ChatOps continues to evolve, we can expect increased integration with AI and natural language processing (NLP) technologies. AI-powered bots and NLP algorithms can enhance the chat experience by enabling more sophisticated interactions, intelligent automation, and contextual understanding. ChatOps platforms may leverage AI to provide smart suggestions, automate routine tasks, and offer advanced analytics based on the conversations within the chat environment.
Expansion to Non-Technical Teams and Departments
While ChatOps has primarily been adopted by technical teams, the future holds potential for its expansion to non-technical teams and departments. By tailoring the chat platforms and workflows to suit the specific needs of different functions, organizations can foster cross-functional collaboration and extend the benefits of ChatOps beyond software development and operations. Teams such as HR, marketing, sales, and customer support can leverage ChatOps to streamline their workflows, enhance communication, and improve overall productivity.
Incorporation of Voice and Video Communication
The future of ChatOps may involve the integration of voice and video communication capabilities within the chat platforms. This expansion would enable teams to have real-time discussions, conduct virtual meetings, and share screens directly within the chat environment. Seamless transitions between text-based chat, voice, and video can enhance collaboration, particularly for distributed teams and remote work setups.
ChatOps as a Driver of Digital Transformation
ChatOps is poised to become a driving force behind digital transformation initiatives. By consolidating communication, automation, and collaboration into a single platform, ChatOps creates an environment conducive to agile workflows, rapid decision-making, and improved transparency. Organizations embracing ChatOps as part of their digital transformation strategies can experience increased operational efficiency, faster time to market, and enhanced customer experiences.
The future trends in ChatOps indicate a continued integration of AI and NLP, expansion to non-technical teams, incorporation of voice and video communication, and its role as a catalyst for digital transformation.
Need ChatOps for your business?
Revolutionize your development landscape with our DevOps solutions. Seamless integration, automated deployment, and enhanced collaboration await. Contact us to embark on a journey of innovation.