Every organization already manages risk informally — a spreadsheet here, a security review before a big release, a compliance checklist before an audit. A risk management framework is what turns that ad-hoc effort into a repeatable, defensible process: a documented way to identify what could go wrong, decide how much of it you can tolerate, and prove — to a board, a regulator, or an enterprise customer's security questionnaire — that you're actually managing it rather than reacting to it. This guide compares the major frameworks (NIST RMF, ISO 31000, COSO ERM, COBIT, FAIR, and the NIST AI RMF), walks through the five steps every one of them shares, and covers how to choose and implement one, backed by the kind of gap analysis our compliance audit team runs for clients preparing for ISO 27001, SOC 2, and DORA.
What Is a Risk Management Framework?
A risk management framework (RMF) is a structured, documented approach an organization uses to identify, assess, treat, monitor, and report on the risks that could interfere with its objectives — financial, operational, technical, or regulatory. It is not a single document or a piece of software; it's the governance layer that says who identifies risks, how they get scored, who decides which ones get fixed first, and how often the whole cycle repeats.
Definition: A risk management framework = a repeatable process (identify → assess → treat → monitor → govern) plus the governance structure (roles, risk appetite, reporting cadence) that keeps it running — as opposed to a one-time risk assessment or a static risk register nobody updates.
Frameworks differ in scope and origin — some, like NIST's Risk Management Framework, were built for federal information systems; others, like ISO 31000, are deliberately generic so any organization can apply them to any category of risk, from cyber to supply chain to reputational. What they share is the underlying discipline: risk isn't managed by discovering it once, it's managed by running the same cycle continuously as your systems, vendors, and regulatory obligations change.
Why Organizations Need a Risk Management Framework in 2026
Three forces are pushing risk management from a "nice to have" into a documented requirement. First, the cost of getting it wrong keeps rising — the IBM Cost of a Data Breach Report 2026 puts the global average breach cost at $4.99 million, a record high and a 12% increase over the prior year. Second, regulation is catching up with practice: frameworks like DORA now require financial institutions to run a documented risk process for every critical vendor (see our guide to ICT third-party risk management under DORA), and NIS2 extends similar obligations to a much wider set of essential and important entities across the EU. Third, AI has created an entirely new risk category with its own legal teeth — under Article 9 of the EU AI Act, providers of high-risk AI systems must run a continuous risk management process covering risk identification, estimation and evaluation, evaluation of risks from real-world use, and adoption of targeted mitigation measures — in other words, the same five-stage cycle this guide describes, now written into law.
None of that is optional for long. Enterprise customers increasingly bake framework questions directly into vendor security questionnaires, cyber-insurance underwriters price premiums against documented risk processes, and boards are asking sharper questions about risk oversight than they were even two years ago. A framework is what lets you answer those questions with a process instead of a scramble.
The 5 Universal Steps of the Risk Management Process
Strip away the framework-specific terminology and NIST RMF, ISO 31000, and COSO ERM all run the same underlying cycle:
Identify: Catalog what could go wrong — vulnerabilities, single points of failure, regulatory gaps, vendor dependencies — and log each one in a risk register with an owner attached.
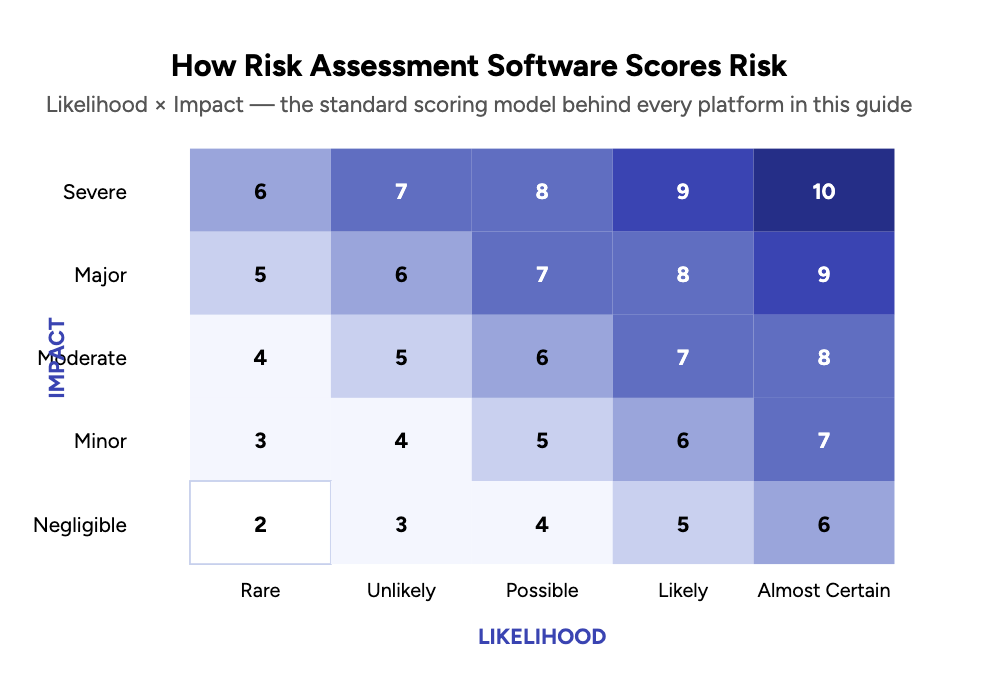
Assess: Score each risk by likelihood and impact (qualitative, on a scale, or quantitative in dollar terms if you're using a model like FAIR) so you can compare wildly different risk types on the same scale.
Treat: Decide, per risk, whether to mitigate it (add a control), accept it, transfer it (insurance, contract terms), or avoid it (stop doing the risky thing). Most of the actual engineering and process work happens here.
Monitor: Track whether controls are still working and whether new risks have emerged — a point-in-time assessment goes stale the moment your infrastructure, vendor list, or threat landscape changes. This is where continuous compliance monitoring replaces annual spot-checks.
Govern & report: Roll findings up to leadership and the board on a fixed cadence, with clear ownership for risk appetite decisions — the piece that turns a technical exercise into an accountable business process.
Comparing the Major Risk Management Frameworks
"Risk management framework" often gets used as shorthand for one specific standard, but there are several widely used ones, each built around a different starting risk (federal information systems, general enterprise risk, IT governance, or AI). Here's how the six most commonly referenced frameworks compare:
FrameworkMaintained byPrimary focusBest fit forNIST RMFNIST (U.S.)Information security & privacy risk for information systemsFederal agencies, government contractors, FedRAMP/CMMC-scoped organizationsISO 31000ISO (international)Generic, principles-based risk management for any risk typeAny organization wanting one internationally recognized, industry-agnostic standardCOSO ERMCOSO (U.S.)Enterprise risk tied explicitly to strategy and performancePublic companies and boards, often paired with SOX internal-control workCOBITISACAIT governance, with risk as one of several control domainsIT governance teams aligning risk with broader control objectivesFAIRFAIR InstituteQuantitative model expressing cyber risk in dollar termsCISOs who need to justify security budget or insurance decisions financiallyNIST AI RMFNIST (U.S.)Risk specific to building or deploying AI systemsAny organization shipping AI features, especially under EU AI Act obligations
NIST Risk Management Framework (NIST RMF)
The NIST Risk Management Framework, defined in Special Publication 800-37 Revision 2, is a seven-step, system-level process built for U.S. federal information systems and widely adopted by government contractors and FedRAMP-scoped vendors:
Prepare (establish context and roles),
Categorize (classify the system by impact level),
Select (choose baseline security controls),
Implement (deploy them),
Assess (verify they work),
Authorize (a risk-based go/no-go decision by an accountable official),
Monitor (continuous surveillance rather than a point-in-time check).
Its strength is precision — it maps controls directly to system categorization — and its tradeoff is that it's heavier to run than a generic framework, which is why organizations outside the federal space usually reach for ISO 31000 or COSO ERM instead.
ISO 31000
ISO 31000 is deliberately not a certifiable standard — you can't get "ISO 31000 certified" the way you can get ISO 27001 certified — because it's meant as a set of principles and a generic process any organization applies to any risk category, not a checklist of controls. Its process runs through scope, context, and criteria (defining what you're assessing risk against), risk assessment (identification, analysis, and evaluation), risk treatment, and continuous monitoring, review, recording, and reporting, all wrapped inside communication and consultation with stakeholders at every stage. Because it isn't tied to any one risk domain — financial, operational, cyber, or reputational — it's the framework most often used as the umbrella structure a company layers other, more specific frameworks (NIST RMF, FAIR) inside of.
COSO ERM
COSO's Enterprise Risk Management framework (2017 edition) is the framework most closely associated with corporate governance and, in the U.S., with SOX compliance work — it was built by the same body (the Committee of Sponsoring Organizations of the Treadway Commission) responsible for the internal-control framework most SOX programs are built on. Its five components — Governance and Culture, Strategy and Objective-Setting, Performance, Review and Revision, and Information, Communication, and Reporting — span 20 underlying principles, and its defining feature is that risk appetite is set explicitly at the strategy stage, not bolted on afterward. That makes it the natural choice for boards and finance-led risk programs, though it says relatively little about the technical control specifics that NIST RMF or a security-audit-driven program would cover.
COBIT, FAIR & the NIST AI RMF
COBIT, maintained by ISACA, treats risk as one of several IT governance domains rather than a standalone framework — useful if your risk program needs to plug directly into an existing COBIT-based IT control structure. FAIR (Factor Analysis of Information Risk) takes the opposite approach from the others on this list: instead of a qualitative high/medium/low scale, it models risk as loss event frequency multiplied by loss magnitude, producing a dollar figure a CFO can actually put in a budget conversation. And the NIST AI RMF, built around four functions — Govern, Map, Measure, and Manage — is the newest addition to this list, purpose-built for the risk profile of AI systems (model drift, bias, hallucination, adversarial inputs) that none of the older frameworks were designed to catch, and it pairs closely with the international ISO/IEC 42001 AI management-system standard for organizations that need both.
How to Choose the Right Risk Management Framework
Most organizations don't pick a framework in a vacuum — the choice is usually dictated by who's asking for evidence of one. Use the driver behind the request as your starting point:
Your situationReasonable starting frameworkYou sell to U.S. federal agencies or carry a FedRAMP / CMMC obligationNIST RMFYou need one internationally recognized, industry-agnostic standard the board can point toISO 31000Risk oversight reports through the board or audit committee, alongside SOX controlsCOSO ERMRisk needs to sit inside an existing IT governance structureCOBITYou need to express cyber risk in dollars for budget or cyber-insurance decisionsFAIRYou build or deploy AI features, especially for EU customersNIST AI RMF / ISO 42001How to Choose the Right Risk Management Framework
In practice, mature programs rarely run just one. A common pattern we see in security audit engagements is ISO 31000 as the umbrella governance process, with NIST controls or a SOC 2-mapped control set layered inside it for the technical detail — the umbrella framework doesn't replace the specific one, it gives it a reporting structure.
Implementing a Risk Management Framework: A 6-Step Roadmap
Whichever framework you choose, the rollout sequence looks similar in practice:
Get executive sponsorship and define risk appetite. Without a named executive owner and an explicit statement of how much risk the business will tolerate, every later scoring decision becomes a political argument instead of a documented one.
Scope the framework to your actual regulatory drivers. Map every framework, certification, and contractual obligation you're actually on the hook for (ISO 27001, SOC 2, HIPAA, PCI DSS, DORA, NIS2) before building the register, so you're not assessing risk against requirements that don't apply to you.
Build the risk register. Catalog risks with an owner, a likelihood/impact score, and a status for each — this is the identify-and-assess stage, and it's where most first attempts either stall (too granular, never finished) or become useless (too shallow to act on).
Select and implement controls. For every risk above your tolerance threshold, decide and document the treatment — mitigate, accept, transfer, or avoid — and assign an implementation owner and deadline, the same way our segregation-of-duties work assigns a specific control owner to every access-risk finding.
Automate evidence collection and continuous monitoring. A risk register that's reviewed once a year is already stale by month two — automated monitoring (see the next section) keeps the register honest between formal review cycles.
Report to the board and iterate on a fixed cadence. Quarterly is the common baseline; regulated industries and fast-changing environments often move to monthly. The report should show what changed since last cycle, not just the current snapshot.
Gart field example:
For an augmented-reality platform client pursuing ISO 27001, our team worked through 55 pending compliance tasks across cloud security, infrastructure security, and code security in a four-month engagement — the practical remediation work a risk register identifies but doesn't do for you on its own. Read the full ISO 27001 compliance case study.
Common Mistakes When Implementing a Risk Management Framework
Treating it as a one-time project. A framework rollout that ends after the kickoff workshop produces a document, not a process. Risk management only works as an ongoing cycle.
Picking a framework because a competitor uses it. The right framework follows your actual regulatory exposure and customer requirements, not industry habit.
Building a register nobody updates. A risk register with a "last modified" date from eight months ago is a liability in an audit, not an asset — it signals the process isn't actually running.
No named executive owner. Without accountability at the top, risk-treatment decisions default to whoever raised the risk last, not whoever should be deciding.
Confusing the framework with the software. GRC platforms automate evidence collection and monitoring; they don't decide your risk appetite or choose your controls for you. The framework is the process; the software is the tooling underneath it.
Ignoring third-party and vendor risk. Most risk registers focus inward and miss the vendors and subprocessors that carry an equal or greater share of the actual exposure — a gap our ICT third-party risk guide covers in more depth.
How GRC Software Fits Into Your Framework
Governance, risk, and compliance (GRC) platforms — Vanta, Drata, OneTrust, and similar tools — automate the parts of a framework that are otherwise manual and easy to let slip: continuous control testing, evidence collection tied to a specific framework's requirements, and alerting when a control that used to pass starts failing. That's real value, and it's why most mid-market and enterprise risk programs run on top of one. What it doesn't do is choose your framework, set your risk appetite, or fix the underlying infrastructure or access-control gap a failing test surfaces — that's still a people-and-process problem, which is where Compliance-as-a-Service or a scoped remediation engagement picks up where the software's dashboard stops.
If you're evaluating tools, treat the platform decision and the framework decision as two separate steps: pick the framework first, based on your regulatory exposure and audience, and only then evaluate which GRC platform's continuous monitoring coverage actually maps to it.
Picked a framework? The hard part is proving you actually follow it.
Gart Solutions runs fixed-fee compliance, security, and infrastructure audits that test whether your controls genuinely satisfy the framework you've chosen — then scope the remediation work and, if you want it, an ongoing retainer to stay audit-ready between review cycles.
4.9
Clutch rating, verified client reviews
2–6 wks
Typical fixed-fee audit timeline
6
Frameworks covered: ISO 27001, SOC 2, HIPAA/HITECH, PCI DSS, GDPR/NIS2, DORA
Compliance Audit
Fixed-fee gap assessment against the framework you've chosen — see the service page
Security Audit
Infrastructure and access-control review — see security audit services
Infrastructure Audit
Technical review of the systems your risk controls actually depend on — see infrastructure audit services
Remediation & Advisory
Scoped, project-based fixes for the gaps the audit finds — priced separately from the assessment
Book a compliance audit →
You might also like:
IT Audit Services — Gart Solutions
Compliance as a Service for MSPs: Build, Buy, or Partner
Cybersecurity Monitoring: Best Practices, Metrics, Tools & Response Framework
HITECH Act Audit: A Comprehensive Guide for Healthcare Providers
Why Is ISO 27001 a Crucial Step for Successful Companies?
Roman Burdiuzha
Co-founder & CTO, Gart Solutions · Cloud Architecture Expert
Roman has 15+ years of experience in DevOps and cloud architecture, with prior leadership roles at SoftServe and lifecell Ukraine. He co-founded Gart Solutions, where he leads cloud transformation and infrastructure modernization engagements across Europe and North America. In one recent client engagement, Gart reduced infrastructure waste by 38% through consolidating idle resources and introducing usage-aware automation. Read more on Startup Weekly.
Downtime costs more than money — it erodes trust, damages reputation, and in critical systems, can cost lives. At Gart Solutions, we engineer software systems that don't just function — they excel in reliability. Using proven DevOps and SRE practices across production environments, we ensure your digital product is fast, stable, and always ready.
When you use a software product, you expect it to work well and meet your needs. But what does it mean for software to be "high quality"? According to the ISO 9126 standard, the quality of a software product is defined by all its features and characteristics that allow it to meet the needs of its users. One key aspect of quality is how reliable the software is.
This 2026 guide covers software reliability from the ground up: what it means, how to measure it, how to achieve it through SRE and DevOps, and how to handle the hardest operational challenges — from Kubernetes cluster failures to multi-cloud incident response.
$5,600
Average cost of IT downtime per minute (Gartner, 2024)
60%
MTTR reduction achieved by Gart clients after implementing Golden Signal monitoring
99.99%
Availability target requiring less than 52 minutes downtime per year
What is software reliability?
Software reliability is the probability that a software system will perform its required functions under specified conditions for a specified period. It is one of the six core dimensions of software quality defined by the ISO/IEC 9126 standard, alongside functionality, usability, efficiency, maintainability, and portability.
Two elements are central to any practical definition of software reliability:
The environment: the deployment context — cloud, on-premises, containerized, edge — directly determines what "correct operation" looks like and which failure modes are most probable.
The time frame: reliability is always expressed over a period (e.g., 99.9% availability over 30 days), not as an absolute state.
Unlike hardware reliability — which is largely determined by physical manufacturing tolerances — software reliability emerges from the quality of design decisions. A single overlooked null pointer, an unhandled race condition, or an improperly configured retry policy can cascade into a total service outage. This is why modern SRE and DevOps disciplines treat reliability as an engineering problem, not an operational afterthought.
At Gart Solutions, we understand that software reliability isn't just a technical goal—it's a critical component of business success. Our approach to building reliable digital solutions leverages the best practices of DevOps and Site Reliability Engineering (SRE), ensuring that your software not only meets but exceeds industry standards for reliability.
⚡ Key Insight
According to Carnegie Mellon University, software reliability is defined as the probability that software will operate without failure under specified conditions for a specified period. Unlike hardware reliability — which depends on manufacturing precision — software reliability is rooted in design perfection: careful architecture, rigorous testing, and continuous operational feedback.
Reliability in Life-Critical vs. Business-Critical Systems
The stakes of software reliability vary dramatically by context. In life-critical systems — aviation, medical devices, nuclear control software — a single failure can result in catastrophic loss. The Boeing 737 Max MCAS software defect contributed to two fatal crashes; the root cause was a reliability failure in sensor data validation logic.
In business-critical systems, reliability failures translate to measurable financial and reputational harm. Gartner estimates the average cost of unplanned downtime at $5,600 per minute — exceeding $300,000 per hour for enterprise environments. For high-traffic e-commerce platforms, a 10-minute checkout system failure during peak hours can result in hundreds of thousands of dollars in lost conversions and irreversible customer churn.
Reliability vs. Availability vs. Resilience
These three terms are frequently confused — even by experienced engineers. Understanding how they differ is foundational to building and operating reliable systems.
The Software Reliability Triad
Three distinct properties — all required for production-grade systems
Reliability
Works Correctly
Probability of correct function over time. Focused on failures per unit time (MTBF). A system can be available but unreliable (returns wrong data).
Availability
Is Accessible
Percentage of time a system is operational and reachable. Expressed as uptime percentage. A highly available system can still deliver incorrect results.
Resilience
Recovers Fast
Ability to withstand and recover from failures — hardware faults, traffic spikes, dependency outages. Measured by MTTR and failure blast radius.
Availability Targets: What "Nines" Actually Mean
When engineering teams set availability SLOs, they express them as percentages — commonly called "nines." The table below shows what each level means in concrete downtime terms:
Key Reliability Metrics: MTTR, MTBF, MTTD, and Error Rate
Reliability engineering lives and dies by measurable signals. The following four metrics form the operational backbone of any SRE program. Without them, reliability is aspirational — with them, it becomes engineerable.
MTTR
Mean Time To Recover
Total Downtime ÷ # Incidents
Average time to restore service after a failure. The single most impactful metric for user experience. Target: under 30 minutes for critical systems.
MTBF
Mean Time Between Failures
Total Uptime ÷ # Failures
How often failures occur. A higher MTBF indicates more stable, reliable software. Foundation for long-term reliability trend analysis.
MTTD
Mean Time To Detect
Detection Time − Incident Start
How quickly your team detects issues after they occur. Driven entirely by monitoring quality. Undetected failures are the silent killers of reliability.
Error Rate
Request Failure Rate
Failed Requests ÷ Total Requests
Percentage of requests resulting in errors (5xx). Directly linked to your SLIs. A spike in error rate is frequently the first indicator of a degrading service.
Gart Solutions — Real-World Example
Reducing MTTR by 60% for a SaaS Platform
During a Kubernetes migration for a high-traffic SaaS client, we implemented Prometheus + Grafana Golden Signal dashboards with automated PagerDuty escalation. Combined with ArgoCD progressive delivery and automated rollback triggers, we achieved the following over a 60-day period:
60%
Reduction in MTTR
45 → 4 min
Rollback time
3×
MTBF improvement
99.97%
Availability achieved
Achieving Software Reliability Through Design
Reliability is not retrofitted — it is architected from the first design decision. Organizations that treat reliability as a post-deployment concern invariably accumulate technical debt that becomes exponentially more expensive to address under production pressure.
Core Design Principles for Reliable Systems
Design for failure: Assume every component will fail. Build services that degrade gracefully, implement circuit breakers, and use bulkhead patterns to contain failure blast radius.
Stateless services where possible: Stateless components are horizontally scalable and trivially restartable. State should be externalized to purpose-built stores with their own reliability guarantees.
Idempotency: Retrying failed operations should be safe. Design APIs and message handlers to be idempotent — the same request processed twice must produce the same result.
Consistency vs. availability trade-off (CAP theorem): In distributed systems, you cannot simultaneously guarantee consistency, availability, and partition tolerance. Define which you prioritize — and design accordingly.
Avoid synchronous chains: Long chains of synchronous service calls multiply latency and create cascading failure vectors. Use asynchronous messaging with dead-letter queues for non-blocking reliability.
Achieving high levels of software reliability begins with the design phase. Design perfection is the foundation upon which reliable software is built. This involves not only the creation of robust algorithms and data structures but also careful consideration of how the software will interact with other systems and environments.
For example, a software application that runs smoothly on a local server may experience reliability issues when deployed in a cloud environment due to differences in infrastructure. Therefore, understanding the target environment and designing the software to perform well under those conditions is crucial for achieving reliability.
Another important consideration is the trade-off between availability and consistency. In highly available systems, such as those used in financial transactions, ensuring that the system is always online may come at the cost of data consistency. For instance, to ensure high availability, a system might cache data locally to reduce dependency on external systems, but this can lead to data inconsistency if the cache is not regularly updated. Additionally, as availability targets increase (e.g., moving from 99.9% to 99.999%), the complexity of the system architecture also increases exponentially.
SREs must carefully balance these trade-offs to ensure that the system remains both reliable and consistent.
Common Reliability Anti-Patterns to Avoid
Anti-PatternRiskCorrect ApproachUnbounded retry loopsAmplifies load during outages; causes cascading failuresExponential backoff + jitter + retry limitsNo health checksLoad balancers route to dead instancesLiveness + readiness probes (Kubernetes)Synchronous external calls without timeoutThread exhaustion; full service unavailabilityTimeouts + circuit breaker patternSingle database instanceSingle point of failure; zero failoverPrimary-replica with automatic promotionUndifferentiated error handlingSwallowed errors; invisible failuresStructured error taxonomy + alerting per typeNo capacity limitsResource exhaustion under load spikesRate limiting, connection pooling, queue depth limitsCommon Reliability Anti-Patterns to Avoid
SLIs, SLOs, and SLAs Explained
Service Level Indicators, Objectives, and Agreements form the language of reliability commitments. Understanding how they differ — and how they connect — is foundational for every SRE and engineering leader.
Acronym
SLI
Service Level Indicator — a specific, measurable metric that directly reflects user experience.
Examples: Request latency at P95, availability percentage, error rate.
Acronym
SLO
Service Level Objective — the target value or range for an SLI, expressed over a rolling window.
Example: 99.5% of requests must return non-5xx over a 28-day window.
Acronym
SLA
Service Level Agreement — a contractual commitment to customers, typically with financial penalties for breach. SLAs are set conservatively below SLOs to provide a buffer.
Derived From
Error Budget
The allowable margin of unreliability derived from the SLO.
Example: If your SLO is 99.9%, your error budget is 0.1% — roughly 43.8 minutes of downtime per month.
Measuring Software Reliability: SLOs and SLIs
To quantify and manage software reliability, organizations often use Service Level Objectives (SLOs) and Service Level Indicators (SLIs). SLOs are specific targets for system performance, such as the time it takes to acknowledge an order on an e-commerce platform. SLIs, on the other hand, are metrics that measure how well the system is performing against these targets.
For example, an SLO might specify that 99.9% of order acknowledgments must occur within two seconds. The SLI would then measure the actual performance of the system to determine if this target is being met. If the SLI indicates that the system is failing to meet the SLO, this serves as an early warning sign that the system's reliability is at risk, prompting further investigation and remediation.
SLOs and SLIs provide a customer-centric view of reliability, helping organizations ensure that their systems meet user expectations. They also create a feedback loop that allows teams to continuously improve their systems by making data-driven decisions based on real-world performance.
SLOs are a key component of SRE. They define the desired reliability level of a service, usually expressed in terms of availability, latency, or error rates
Practical SLO Example: E-Commerce Checkout Service
📋 SLO Definition
checkout-api.prod
Availability Metric
SLI Formula
non-5xx responses / total requests
SLO Target
≥ 99.9% over rolling 28 days
Latency Metric
SLI Threshold
P95 response time < 400ms
SLO Target
≥ 95% of requests within 400ms
Monthly Error Budget
43.8 minutes
SLA (Customer-facing)
99.5% (with service credit)
Measurement Window
Rolling 28-day (1-min intervals)
SLI Formula Examples
📐 Common SLI Formula
Availability SLI
(Total Requests − Failed Requests) ÷ Total Requests × 100
📐 Common SLI Formula
Latency SLI
Requests served under threshold (e.g., 300ms) ÷ Total Requests × 100
📐 Common SLI Formula
Throughput SLI
Messages processed within SLA window ÷ Expected messages × 100
Error Budgets in Practice
Error budgets are one of SRE's most powerful innovations — they transform the reliability vs. velocity tension from a cultural conflict into a data-driven policy. The core concept: if your SLO is 99.9% availability, you have a 0.1% "budget" of allowable errors per rolling window. Spend that budget wisely.
📊 Error Budget Health Dashboard — Illustrative Example
28-day rolling window — Checkout API (Target: 99.9%)
Week 1
Normal operations
82%
Week 2
Feature deploy with minor rollback
51%
Week 3
Database failover event — FREEZE deployments
12%
Week 4
Post-incident hardening, no releases
67%
Error budgets
SRE introduces the concept of error budgets, which define the acceptable amount of unreliability for a given period (balance low quality releases with operational circumstances). This allows teams to balance innovation and reliability.
If the error budget is exceeded, development slows down, and efforts are refocused on improving stability.
Error Budget Policy: What Happens When You Run Out
Budget > 50% remaining: Normal development velocity. Feature releases proceed on schedule.
Budget 25–50% remaining: Reliability review required before each release. On-call team reviews deployment risk.
Budget < 25% remaining: High-risk deployments paused. Engineering focus shifts to reliability improvements and postmortems.
Budget exhausted: All non-critical deployments frozen until SLO window resets. Leadership escalation required.
Key Takeaway
Error budgets make the reliability vs. innovation trade-off explicit and quantitative. Rather than engineering and operations teams debating whether a service is "stable enough" to release, the error budget provides an objective answer — one that both sides agreed to define before any crisis occurred.
The Three Pillars of Observability
Metrics: Numerical time-series data aggregated at regular intervals. Fast to query, efficient to store. Best for trend analysis and alerting. Examples: request rate, latency percentiles, error count.
Logs: Structured, timestamped event records capturing the context of individual operations. Essential for debugging — answering "what exactly happened for request ID X?" Requires structured logging (JSON) for practical analysis at scale.
Traces: Distributed request journeys showing how a single user request flows across multiple services. Critical for diagnosing latency in microservice architectures. OpenTelemetry has become the de-facto standard for trace instrumentation.
The Four Golden Signals (Google SRE Framework)
Golden Signal 1
Latency
Time from request to response. Distinguish successful request latency from error latency — errors that return in 1ms are still failures. Monitor P50, P95, P99.
Golden Signal 2
Errors
Rate of failed requests — explicit (5xx), implicit (success code but wrong content), and policy failures. Error rate is the most direct SLI for availability SLOs.
Golden Signal 3
Traffic
Volume of demand on your system — requests per second, messages consumed, active WebSocket connections. Traffic context makes other signals meaningful.
Golden Signal 4
Saturation
Resource utilization approaching limits — CPU, memory, disk I/O, connection pool exhaustion. Many performance failures are predictable from saturation trends 30+ minutes in advance.
Kubernetes Reliability: Engineering for Container-Native Systems
Kubernetes has become the dominant substrate for production workloads — and it introduces a distinct set of reliability challenges that go beyond traditional VM-based infrastructure. A misconfigured liveness probe, an absent Pod Disruption Budget, or an unset resource request can silently degrade your SLO while your dashboards show green.
Essential Kubernetes Reliability Practices
PracticeWhy It MattersCommon MistakeLiveness & Readiness ProbesKubernetes restarts unhealthy pods and withholds traffic from unready onesIdentical probe logic — probing the wrong endpoint or missing the probe entirelyResource Requests & LimitsEnables scheduler to guarantee compute; limits prevent noisy-neighbor problemsSetting limits too low (OOMKilled); setting no requests (unpredictable scheduling)Pod Disruption Budgets (PDB)Ensures minimum pod count during voluntary disruptions (node drain, cluster upgrades)No PDB set — rolling updates can take all pods offline simultaneouslyHorizontal Pod Autoscaler (HPA)Scales pod count based on CPU/custom metrics to handle traffic spikesScaling on CPU alone while the bottleneck is I/O or database connectionsMulti-Zone Topology SpreadDistributes pods across availability zones — prevents zonal failure from taking the service downAll replicas scheduled in the same zone due to missing topology constraintsProgressive Delivery (ArgoCD Rollouts)Canary and blue-green deployments limit blast radius of bad releasesAll-at-once deployments that fail 100% of traffic on a broken releaseEssential Kubernetes Reliability Practices
Gart Solutions — Production Example
Implementing ArgoCD Progressive Delivery for Zero-Downtime Releases
A fintech client was experiencing 3–5 minute service degradations during each deployment due to rolling update misconfiguration. We implemented ArgoCD Rollouts with automated Prometheus-based analysis gates: if error rate exceeded 0.5% during the canary phase, the rollout automatically paused and rolled back.
Result: deployment rollback time dropped from 45 minutes to under 4 minutes, and zero customer-impacting deployments in the following 6 months.
Chaos Engineering: Testing Reliability Under Adversarial Conditions
Chaos engineering is the discipline of intentionally introducing controlled failures into production (or production-like) systems to verify that they behave reliably under adversarial conditions. The guiding principle, from Netflix's pioneering work: "the best time to find out your system handles failure poorly is before your users do."
📌 Definition
Chaos engineering is not "breaking things randomly" — it is a disciplined, hypothesis-driven experiment. You define a steady state (e.g., "P95 latency < 300ms"), introduce a specific perturbation (e.g., "kill one of three database replicas"), then observe whether the steady state holds. If it doesn't, you've discovered a reliability gap before it became a customer-impacting incident.
Chaos Engineering Experiment Workflow
1
Define Steady State
What does "normal" look like? Set baseline SLI values.
2
Form Hypothesis
"Killing one pod should not degrade availability below 99.9%"
3
Introduce Failure
Use Chaos Mesh / LitmusChaos to inject fault in a controlled scope.
4
Observe & Measure
Monitor Golden Signals against baseline throughout experiment.
5
Learn & Fix
If steady state broke, identify root cause and harden system.
Common Chaos Experiment Types
Pod kill / node drain: Tests Kubernetes self-healing and PDB correctness
Network latency injection: Validates timeout and circuit breaker configurations
Memory pressure: Confirms OOMKilled pods restart within SLO
Dependency outage: Tests graceful degradation when external APIs are unavailable
Zone failure simulation: Confirms multi-AZ traffic rerouting works correctly
Incident Management Workflow
A well-defined incident management process is the difference between a 10-minute recovery and a 10-hour war room. Effective SRE teams treat incident response as an engineered workflow — not a heroic improvisation.
The 5-Phase Incident Lifecycle
1
Detection
Alert fired from monitoring (Prometheus/PagerDuty), customer report, or anomaly detection. MTTD goal: under 5 minutes for critical services. Key tool: automated alerting on SLO burn rate — not raw metric thresholds.
2
Triage & Severity Assignment
On-call engineer assesses user impact and assigns severity level (SEV1–SEV4). SEV1 = full service down; SEV4 = minor degradation, no SLO impact. Severity determines escalation path and response team composition.
3
Containment & Mitigation
First priority: stop the bleeding. Rollback the last deployment, reroute traffic, scale up replicas, or enable feature flags to disable the failing component. Mitigation is not fixing the root cause — it's restoring user-facing service.
4
Root Cause Analysis
Use distributed traces, structured logs, and timeline reconstruction to identify the specific trigger. Ask "why" five times. Distinguish proximate cause (what broke) from contributing factors (why it was breakable).
5
Blameless Postmortem
Document the full incident timeline, contributing factors, and — critically — specific action items with owners and deadlines. Blameless culture is non-negotiable: psychological safety is a prerequisite for learning from failures. Distribute postmortem to all engineering stakeholders within 48 hours.
Incident Severity Matrix
SeverityImpactResponse TimeEscalationSEV1Total service outage — all users affected< 5 minImmediate — CTO/VP EngineeringSEV2Major feature degraded — >20% users affected< 15 minEngineering Lead + On-call teamSEV3Minor feature degraded — workaround available< 1 hourOn-call engineerSEV4Cosmetic or non-impacting issueNext business dayTicket created, no immediate actionIncident Severity Matrix
Production Readiness Review (PRR)
A Production Readiness Review is a structured assessment conducted before a new service or major feature reaches production. Its purpose: verify that the system is ready to operate reliably at scale before users depend on it.
At Gart Solutions, our PRR process evaluates 7 domains for every service entering production:
Reliability targets defined:SLIs and SLOs documented and agreed upon by engineering and product
Monitoring and alerting in place:Golden Signals instrumented, dashboards created, PagerDuty routing configured
Runbooks written:On-call engineers know how to respond to every alert without escalation
Load testing completed:System validated at 2× expected peak traffic with no SLO breach
Failure modes identified:Dependency failures, data corruption scenarios, and resource exhaustion paths documented
Deployment and rollback plan documented:Progressive delivery strategy defined; rollback validated in staging
On-call coverage assigned:Primary and secondary on-call identified with escalation path confirmed
Reliability Testing Strategies
Reliability is only real if it's been tested under conditions that approximate production reality. The following testing strategies form a complementary suite — each catches failure modes the others miss.
Test TypePurposeToolsWhen to RunLoad TestingValidate performance at expected peak traffick6, Locust, GatlingPre-release, post-architecture changeStress TestingFind the breaking point beyond normal loadk6, JMeterQuarterly, before major traffic eventsSoak / Endurance TestingDetect memory leaks and degradation over timeCustom scripts + APMPre-major releasesChaos EngineeringVerify behavior under unexpected component failuresChaos Mesh, LitmusChaosOngoing, in staging + productionFailover TestingConfirm automatic failover works as expectedCloud provider toolingAfter infrastructure changesDisaster Recovery (DR) DrillsValidate RTO and RPO in realistic scenariosRunbook executionAt minimum twice per yearReliability Testing Strategies
⚠️ Common Pitfall
Most organizations run load tests before launch — then never again. Production traffic patterns evolve, new dependencies are added, database schemas change. A system that passed a load test 18 months ago may have completely different performance characteristics today. Schedule reliability tests as recurring engineering calendar items, not one-time pre-launch rituals.
How SRE & DevOps Work Together
While DevOps and Site Reliability Engineering (SRE) share similar goals, they take distinct approaches to improving software quality and operational excellence. Together, they form a powerful combination for building and maintaining highly reliable systems.
DevOps focuses on unifying development and operations teams to enable continuous integration and delivery (CI/CD), faster releases, and automation throughout the software lifecycle. It’s about breaking silos and enabling speed without sacrificing control.
SRE, introduced by Google, brings a more metrics-driven, engineering-centric approach to reliability. It emphasizes SLOs (Service Level Objectives), error budgets, monitoring, and incident response to ensure systems meet reliability targets without slowing innovation. SRE uses engineering principles to solve operations challenges, making it a natural evolution of DevOps.
Here’s how they compare in key areas:
DimensionDevOpsSite Reliability Engineering (SRE)Primary FocusAutomating delivery & collaborationEnsuring system reliability and availabilityKey PracticesCI/CD, IaC, automation, shift-left testingSLOs, SLIs, error budgets, monitoring, postmortemsGoalFast, frequent, reliable deploymentsMaintain reliability while enabling innovationApproachCultural transformation + toolingEngineering rigor + quantitative metricsKey MetricsDeployment frequency, lead time, change failure rateLatency, availability, error rate, MTTROn-Call?Shared responsibility — devs on-call for what they shipDedicated SRE on-call rotation with escalation pathsHow SRE & DevOps Work Together
The Reliability Engineering Stack
A modern reliability engineering stack integrates tools across the full observability and delivery lifecycle:
Prometheus
Metrics collection & alerting
Grafana
Dashboards & visualization
OpenTelemetry
Tracing & instrumentation
Loki
Log aggregation
PagerDuty
On-call alerting
ArgoCD
Progressive delivery
Kubernetes
Container orchestration
Terraform
Infrastructure as code
Chaos Mesh
Chaos engineering
k6
Load testing
Business Impact of Reliable Software
Software reliability is not a technical goal disconnected from business outcomes — it is one of the highest-ROI investments an organization can make in its engineering capability.
The Financial Case
Gartner's research consistently places the average cost of IT downtime at $5,600 per minute — exceeding $300,000 per hour for enterprise organizations. For SaaS platforms, the compounding effects of downtime include:
Direct revenue loss: Every minute of checkout unavailability is revenue that cannot be recovered.
SLA penalty payments: Enterprise contracts increasingly include uptime SLAs with financial remedies.
Customer acquisition cost amplification: Each churned user due to reliability failure requires marketing spend to replace.
Engineering opportunity cost: Post-incident remediation consumes engineering capacity that could otherwise deliver features.
Reliability as a Competitive Differentiator
In saturated markets, reliability is increasingly the factor that differentiates category leaders from everyone else. Expedia famously increased annual revenue by $12 million by eliminating a single confusing field from their payment form — a reliability improvement in user experience that directly converted to measurable business outcomes.
Organizations that invest in SRE programs consistently report:
Higher Net Promoter Scores (NPS) — reliability builds user trust over time
Lower customer support load — reliable software generates fewer tickets
Faster enterprise sales cycles — robust SLA commitments reduce procurement risk
Higher engineering team retention — on-call engineers on well-monitored, reliable systems experience significantly lower burnout
🚀 Gart Solutions — SRE & DevOps Services
Ready to Engineer Reliability Into Your Systems?
Gart Solutions brings hands-on SRE and DevOps expertise to companies scaling their digital products. From SLO design and monitoring stack implementation to full incident management programs — we help engineering teams build systems that stay up, recover fast, and scale confidently.
SRE Services
SLO/SLI design, error budget implementation, Golden Signal monitoring, on-call program setup
DevOps Engineering
CI/CD pipelines, Infrastructure as Code (Terraform), Kubernetes setup, progressive delivery
IT Monitoring & Observability
Prometheus + Grafana + OpenTelemetry stack, alerting design, dashboard engineering
Kubernetes Reliability
Cluster hardening, multi-zone deployments, HPA, PDB, progressive delivery with ArgoCD
Disaster Recovery
RTO/RPO design, backup strategies, DR drill facilitation, multi-region failover
IT Audit
Infrastructure and reliability maturity assessment with actionable improvement roadmap
Get a Free Reliability Consultation →
View Client Case Studies
The stakes are high. According to Gartner, the average cost of IT downtime is $5,600 per minute —that’s more than $300,000 per hour. For customer-facing platforms, each moment of unavailability can result in lost sales, churn, and negative reviews. For internal systems, downtime stalls productivity and decision-making.
This is why reliability is no longer optional. It’s a strategic necessity.
Conclusion
Software reliability is a complex but essential aspect of modern software systems. It requires a deep understanding of the software's design, the environment in which it operates, and the expectations of its users. By focusing on design perfection, setting clear reliability objectives, and leveraging the practices of Site Reliability Engineering, organizations can build and maintain systems that are not only functional but also reliable.
Ready to enhance your system’s reliability?Partner with Gart to design, build, and maintain a robust digital solution that meets your business needs. Our experts are here to guide you through every step of the process, ensuring your software operates flawlessly and efficiently.Learn more from our cases.
Get a Free Software Reliability ConsultationWhether you're launching or scaling, our SRE experts will build a plan to help your product stay fast, reliable, and secure.
Roman Burdiuzha
Co-founder & CTO, Gart Solutions · Cloud Architecture Expert
Roman has 15+ years of experience in DevOps and cloud architecture, with prior leadership roles at SoftServe and lifecell Ukraine. He co-founded Gart Solutions, where he leads cloud transformation and infrastructure modernization engagements across Europe and North America. In one recent client engagement, Gart reduced infrastructure waste by 38% through consolidating idle resources and introducing usage-aware automation. Read more on Startup Weekly.
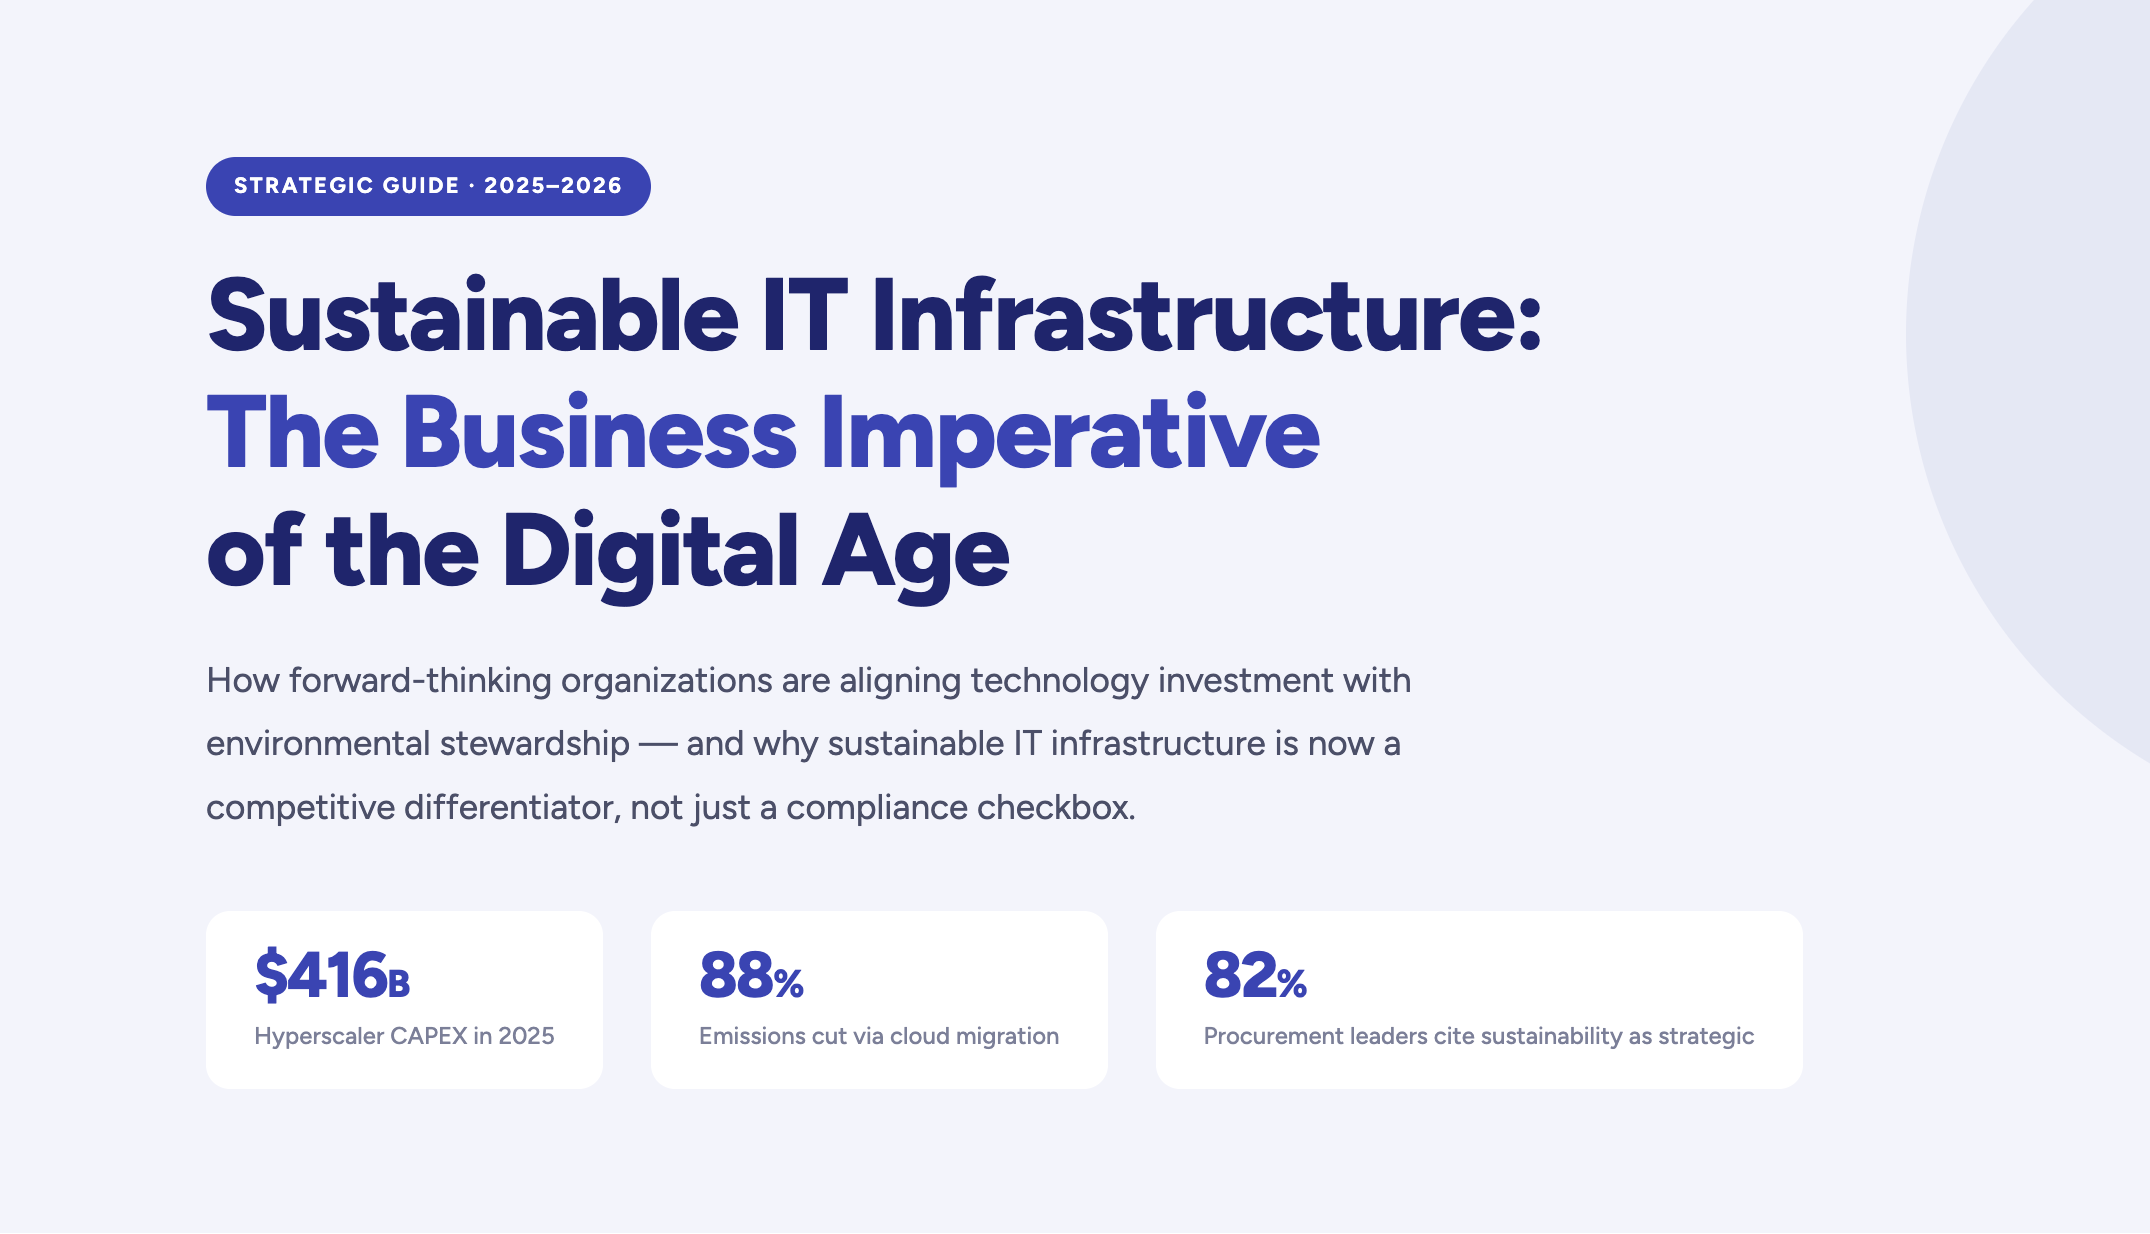
How forward-thinking organizations are aligning technology investment with environmental stewardship — and why sustainable IT infrastructure is now a competitive differentiator, not just a compliance checkbox.
$416B
Hyperscaler CAPEX in 2025
88%
Emissions cut via cloud migration
82%
Procurement leaders cite sustainability as strategic
Where digital acceleration meets environmental stewardship
The contemporary business landscape is undergoing a fundamental transformation: digital acceleration and environmental stewardship are no longer competing priorities but deeply intertwined strategic imperatives. Sustainable IT infrastructure — the discipline of designing, procuring, operating, and decommissioning technology assets to maximize resource efficiency and minimize ecological disruption — now sits at the intersection of every major boardroom agenda.
As organizations grapple with the dual challenges of rapid technological evolution — from generative AI to hyperscale cloud computing — and the intensifying pressures of climate change, the roles of CIO and CSO have begun to converge into a singular focus on the "nexus" of digital and environmental performance.
In 2025 alone, Amazon, Google, Meta, and Microsoft collectively spent over $416 billion in capital expenditures — a 66% year-over-year increase driven by AI infrastructure demands. This surge underscores both the strategic importance and the environmental urgency of every infrastructure decision made at scale. Historically a backend function, IT has matured into a critical driver of enterprise ESG outcomes.
"Sustainable IT is not just an environmental obligation — it is a strategic advantage. It drives cost savings, improves operational resilience, ensures regulatory compliance, and strengthens brand reputation in an increasingly carbon-aware world."
The evolutionary taxonomy of Green IT
Understanding sustainable IT infrastructure requires tracing the historical progression of "Green IT" — a discipline that has broadened in scope and deepened in strategic integration across three distinct generations.
1.0
Green IT 1.0
Internal Optimization
Focused on improving energy efficiency and reducing hardware consumption. Key levers included server virtualization, hardware consolidation, and PUE metrics. Effective internally, but limited in scope.
1.5
Green IT 1.5
Operational Integration
Expanded to networks and Sustainable Development Information Systems (SDIS). Introduced "lifecycle thinking" and standardized ESG reporting while minimizing operational footprints.
2.0
Green IT 2.0
Disruptive Innovation
The current frontier where IT acts as a catalyst for external environmental transformation. Drives eco-innovations across entire supply chains and global customer ecosystems.
Phase
Strategic Focus
Primary Objective
Key Metric
Green IT 1.0
Internal IT assets
Energy efficiency and e-waste management
Carbon footprint, PUE
Green IT 1.5
Business operations
SDIS and remote work enablement
Operational energy savings
Green IT 2.0
Value chain impact
Disruptive eco-innovation and behavioral change
External environmental impact
The sustainable IT infrastructure life cycle
A nuanced approach to sustainable IT infrastructure moves beyond snapshots of energy use toward comprehensive life cycle assessment (LCA). Infrastructure is a dynamic system that persists for decades, continuously interacting with the environment. The Sustainable Systems Dynamic Model (SSDM) identifies five interconnected stages:
01 Planning & Design
02 Procurement
03 Construction
04 Operation & Maintenance
05 Renewal & Disposal
Each stage carries environmental implications — from raw material extraction and water use during construction to waste generation during operation and the impact of eventual demolition or reuse. Critically, decisions made during the planning phase dictate environmental outcomes for the next 20–50 years.
Planning and design for long-term resilience
Infrastructure development must prioritize adaptability and resilience in the face of growing climate challenges. In 2026, resilient infrastructure projects increasingly incorporate climate risk assessments and alternative materials such as "green concrete." This proactive approach aligns with the ISO 55000 standard for asset management and ensures assets can withstand extreme weather while maintaining a low carbon profile.
Sustainable procurement and the circular economy
Procurement is one of the most powerful levers an organization can exercise. Sustainable (or circular) procurement involves purchasing goods and services that foster longer lifespans, value retention, and safe material cycling. By 2025, 82% of procurement leaders consider sustainability a strategic priority, with 85% reporting tangible benefits including risk mitigation and enhanced supply chain transparency.
Reduction
Redesigning to minimize capital use
Server virtualization, right-sizing
Reuse
Extending product life through secondary use
Refurbished hardware programs
Remanufacture
Restoring products to functional use
Component-level upgrades and repair
Recycling
Cycling materials back into production
Responsible e-waste disposal
Expert Guidance
Gart Solutions helps you build a circular IT procurement strategy
From lifecycle planning and hardware rationalization to cloud-native architecture — we align your infrastructure investments with your sustainability goals.
Explore our services →
The ESG mandate driving IT infrastructure investment
The integration of Environmental, Social, and Governance (ESG) criteria into IT investment decisions has shifted technology from a backend function to a critical driver of enterprise value. Modern organizations no longer view IT costs in isolation but as a measurable contributor to their ESG score and market positioning.
Environmental: carbon-aware infrastructure
The environmental dimension has moved beyond simple energy reduction toward "carbon-aware" strategies. This includes investing in elastic infrastructure that dynamically adjusts to demand through virtualization and scalable architectures, directly lowering carbon footprints. The selection of energy sources has become paramount — organizations are advised to migrate from fossil fuels and negotiate contracts for renewable energy including solar, wind, and hydropower.
Social: the inclusive digital workplace
The social pillar focuses on how IT infrastructure supports workforce inclusion and well-being. Investment in reliable, high-performing systems reduces "digital friction" — the frustration caused by slow or unreliable technology — which directly impacts employee satisfaction and productivity. Infrastructure supporting location-independent work allows organizations to access broader talent pools and foster regional economic participation.
Governance: transparency and compliance
Governance criteria drive investments in transparency and data control. Structured IT management and automated tracking create reliable audit trails that support both internal reviews and external regulatory reporting. As AI becomes embedded in operations, governance frameworks ensure these systems operate transparently and remain aligned with evolving standards like the CSRD.
Optimizing the digital foundation: data center sustainability
Data centers are the physical manifestation of the internet — and their environmental impact is substantial. They consume approximately 1.8% of total U.S. electricity, a figure that continues to grow alongside AI and cloud demand. To mitigate this, operators are focusing on three material risks: emissions intensity of electricity, water use, and energy efficiency.
Beyond PUE: a broader metrics suite
The industry has traditionally relied on Power Usage Effectiveness (PUE) — the ratio of total facility energy to IT equipment energy — as its primary efficiency benchmark. However, PUE is increasingly viewed as insufficient because it doesn't account for IT equipment efficiency, workload utilization, or carbon intensity of the power source. A broader suite of metrics is gaining traction:
PUE
Power Usage Effectiveness
Total facility energy ÷ IT energy. Industry benchmark, but limited in scope.
CUE
Carbon Usage Effectiveness
CO₂ emissions ratio relative to IT equipment energy consumption.
WUE
Water Usage Effectiveness
Liters per kWh used for cooling, quantifying water stewardship.
REF
Renewable Energy Factor
Ratio of renewable energy compared to total data center consumption.
Advanced cooling technologies
Cooling accounts for 30–40% of the total data center energy load. Traditional air cooling methods are increasingly unable to handle the heat generated by high-density AI racks, which can standardly reach 80 kW or more. Advanced liquid cooling technologies are rapidly displacing legacy approaches:
Free Cooling
Up to 60% reduction in annual chiller use
Implementation
Economizers utilizing outside air to cool the facility without mechanical refrigeration.
Direct-to-Chip
Precise heat dissipation for high-density GPUs
Implementation
Liquid-cooled cold plates mounted directly on primary heat sources like CPUs and GPUs.
Immersion Cooling
Up to 21% reduction in total emissions
Implementation
Submerging entire servers in a dielectric fluid bath for maximum thermal conductivity.
Waste Heat Recovery
Lowers local community energy needs
Implementation
Capturing waste heat from servers and redirecting it into district heating networks.
The water stewardship trade-off
Cooling method selection often involves a direct trade-off between energy and water. Evaporative cooling towers are highly energy-efficient but can consume millions of liters of water per day, straining local resources. Conversely, air-cooled systems use more electricity but zero water (WUE of 0.0). The leading approach in 2026 is server liquid cooling, which reduces both energy and water consumption relative to traditional methods, providing the most balanced sustainability profile.
Cloud computing as a decarbonization engine
Migration from on-premises data centers to the cloud is one of the most effective strategies for reducing an organization's carbon footprint. Research consistently shows that hyperscale cloud providers achieve efficiencies fundamentally unattainable for most individual enterprise data centers.
Baseline
On-premises
12–18% server utilization
PUE between 1.5 and 2.0
Average global energy mix
Sized for peak demand
Performance
Hyperscale cloud
65%+ server utilization (multi-tenancy)
PUE between 1.1 and 1.4
28% cleaner than global average
Dynamic autoscaling, serverless
Impact Area
On-Premises
Cloud
Net Reduction
Server count
100%
23%
77% fewer
Power consumption
100%
16%
84% less
Carbon mix
100%
72%
28% cleaner
Total emissions
100%
12%
88% reduction
Studies by Microsoft and WSP found that Microsoft Cloud services can be up to 93% more energy-efficient and 98% more carbon-efficient than traditional enterprise data centers. However, organizations must remain vigilant about "cloud waste" — idle or unused virtual resources that consume energy without delivering value. Proper cloud management involves autoscaling, serverless technologies, and continuous monitoring to ensure workloads are truly optimized.
Sustainable Infrastructure
Cloud migration with built-in sustainability
Gart Solutions architects cloud environments that are optimized for both performance and carbon efficiency — from workload right-sizing to renewable energy alignment.
Work with us →
Green AI: sustaining the intelligence revolution
Artificial Intelligence has transformed the landscape of modern enterprise systems — but its growth comes at the cost of significantly increased energy consumption. Training a single large language model can emit as much carbon as five cars over their entire lifetimes. In response, "Green AI" has emerged as an approach that prioritizes efficiency and sustainability across the entire AI lifecycle.
Technical strategies for efficient AI
Green AI focuses on producing high-quality results without proportionally increasing computational costs. Key technical strategies include:
Pruning — Removing redundant or low-importance neural network parameters, reducing size and speeding up inference without significant accuracy loss.
Quantization — Reducing calculation precision (e.g., 32-bit to 8-bit integers), decreasing memory and compute requirements substantially.
Knowledge distillation — Using a large "teacher" model to train a smaller "student" model that mimics its behavior with a fraction of the energy cost.
Data efficiency — Using deduplication and intelligent sampling to reduce training dataset size while maintaining model accuracy.
Combined, these approaches can reduce model sizes by up to 90%, cutting costs and emissions dramatically. Research shows that dynamic multi-objective optimization can deliver a 30.6% decrease in overall energy consumption with only a 0.7% reduction in model accuracy.
AI as a force for environmental action
While AI is energy-intensive, it is also a critical tool for accelerating climate action. Accelerated computing has made AI tasks 100,000 times more energy-efficient than a decade ago. AI is now being applied to ultra-high-resolution weather forecasting (aiding disaster preparedness), optimizing wind farm layouts to boost energy output by up to 20%, and speeding up semiconductor production while reducing energy requirements.
The regulatory fortress: CSRD, EED, and global standards
The shift toward sustainable infrastructure is increasingly mandated by law. By 2026, organizations operating in the UK and EU face a tightening web of regulations requiring detailed reporting and real-world decarbonization.
The Corporate Sustainability Reporting Directive (CSRD)
The CSRD requires companies to disclose their environmental and social impacts in a standardized digital format, subject to third-party assurance. It introduces the concept of "double materiality" — requiring businesses to report both how climate change affects their business and how their business affects the climate. Key ESRS E1 requirements include:
Standard
Requirement
IT Infrastructure Relevance
ESRS E1-7
Energy consumption and renewable energy mix
Data center PUE, renewable energy sourcing, and workload energy density.
ESRS E1-8
Gross Scope 1, 2, and 3 GHG emissions
Cloud footprint tracking, embodied carbon in hardware, and lifecycle emissions.
ESRS E1-11
Financial effects of climate physical and transition risks
Infrastructure resilience planning and transition costs to low-carbon IT architectures.
Energy Efficiency Directive (EED) and data centers
The recast EED introduces specific reporting obligations for all EU data centers with an IT power demand of at least 500 kW. Starting in 2024, operators must annually communicate energy performance data. Facilities larger than 1 MW must utilize waste heat recovery where technically and economically feasible.
Green building certifications: LEED v5 and Energy Star
LEED v5, the newest iteration, reflects a decisive shift toward measurable carbon performance. Projects pursuing Platinum certification must achieve full electrification and 100% renewable energy usage. V5 also emphasizes "embodied carbon" — emissions associated with the manufacturing and construction of the building itself.
Energy Star certification requires a data center to rank in the top 25% of national energy performance, achieving a score of 75 or higher, verified by a Licensed Professional.
The economic case for sustainable IT infrastructure
The financial justification for sustainable IT is stronger than ever. Historically, infrastructure planning focused on the "lowest first cost" — but tightening budgets and climate vulnerabilities have elevated lifecycle economic analysis to a strategic necessity.
60%
CAPEX Savings
Achieved through risk-based investment models and infrastructure rationalization.
5–10%
Maintenance Reduction
Lowering ongoing operational costs via advanced predictive analytics.
80%
Uptime Improvement
Reduction in unplanned downtime through proactive predictive maintenance.
6–12mo
Typical ROI
Standard timeframe for realizing returns on sustainable infrastructure investments.
Asset Investment Planning (AIP) helps balance large upfront CAPEX with ongoing OPEX. While CAPEX typically accounts for only 10–40% of an infrastructure asset's total lifetime costs, decisions made during the CAPEX phase dictate the remaining 60–90% in operational expenditure. Risk-based models that prioritize investments based on actual failure probabilities can save up to 60% in capital expenditures.
The "HyperCAPEX" reality: Amazon, Google, Meta, and Microsoft are on pace to exceed $2 trillion in cumulative CAPEX by 2026. For tech leaders, the question is no longer just how much to spend, but how to ensure every dollar builds an optimized, sustainable digital factory — not just a more expensive one.
Hardware and the circular imperative
Electronic waste is the fastest-growing waste stream globally. Managing the hardware lifecycle is among the most practical Green IT initiatives an organization can undertake. The goal is to extend device lifespan and improve disposal practices across three pillars: proactive maintenance to delay new purchases, refurbishment programs that give hardware a second life, and responsible recycling partnerships for end-of-life assets.
Sustainable procurement policies should also include "Capacity Optimizing Methods" (COMs) such as data deduplication, compression, and thin provisioning — reducing physical storage requirements, saving both energy and cost.
Building the sustainable digital ecosystem: a roadmap for leaders
The nexus of business sustainability and IT infrastructure demands a holistic, systems-level approach. As we move through 2026, the role of IT is evolving from a consumer of resources to a catalyst for environmental and social value creation.
The transition to Green IT 2.0 requires a fundamental rethink of how technology is designed, procured, and operated. It requires moving beyond efficiency metrics like PUE toward comprehensive carbon and water usage assessments. It demands advanced cooling technologies and strategic use of hyperscale cloud resources. And it requires ethical, efficient AI deployment to solve pressing environmental challenges while minimizing its own footprint.
Adopt a full lifecycle cost framework — factor OPEX implications into every CAPEX decision from day one.
Expand your metrics suite beyond PUE to CUE, WUE, and REF — align with CSRD reporting requirements now.
Accelerate cloud migration for workloads where hyperscale efficiency gains are achievable — target the 88% emissions reduction opportunity.
Implement circular procurement principles — extend hardware lifecycles, standardize refurbishment, eliminate e-waste.
Apply Green AI techniques (pruning, quantization, distillation) to reduce model footprint without sacrificing accuracy.
Begin CSRD and EED compliance preparation now — reporting obligations are tightening and require verified, auditable data.
Gart Solutions
Ready to build your sustainable IT infrastructure?
Gart Solutions specializes in DevOps, cloud architecture, and data compliance — helping organizations across Europe and beyond build digital ecosystems that are powerful, efficient, and sustainable by design.
Get in touch with our team →
How Gart can help your company achieve sustainable development
Sustainable development is often defined as the ability to meet present needs without compromising the ability of future generations to meet their own. In a business context, this translates into balancing economic performance with environmental responsibility and social impact.
For technology-driven organizations, sustainability is no longer a parallel initiative — it is embedded directly into how digital systems are designed, deployed, and operated.
This is where DevOps, SRE, and cloud architecture become critical enablers.
At its core, DevOps promotes efficiency, automation, and continuous improvement — principles that directly align with sustainability objectives. By reducing waste, optimizing resource usage, and improving system performance, modern engineering practices contribute to both cost efficiency and lower environmental impact.
Site Reliability Engineering (SRE) further strengthens this approach by ensuring that systems operate reliably and efficiently at scale. Well-optimized systems consume fewer resources, reduce unnecessary compute cycles, and minimize the environmental footprint of digital operations.
Practical ways Gart enables Sustainable IT infrastructure
Gart Solutions helps organizations embed sustainability into their infrastructure through a combination of cloud, DevOps, and SRE practices:
Automation at scaleReducing manual processes decreases resource consumption and improves operational efficiency.
Infrastructure as Code (IaC)Enables precise resource provisioning, eliminating over-allocation and reducing idle infrastructure.
Cloud-native architectureLeveraging autoscaling and elastic environments ensures that compute resources are used only when needed.
Containerization and microservicesImproves workload efficiency and reduces the need for over-provisioned systems.
Continuous monitoring and optimizationIdentifies inefficiencies in real time, enabling ongoing reduction in energy consumption and costs.
Serverless computingEliminates the need for persistent infrastructure, significantly lowering energy usage.
Resilience engineering (SRE practices)Minimizes downtime and resource waste associated with system failures.
Sustainable data center strategyAligns infrastructure with renewable energy sources and modern cooling technologies.
So, yeah, DevOps and sustainability? They're like peanut butter and jelly – a perfect match.
By integrating these practices, organizations achieve more than operational improvements. They build infrastructure that is:
More energy-efficient
More cost-effective
More resilient
Better aligned with ESG and regulatory requirements
In this context, DevOps and sustainability are not separate domains — they are mutually reinforcing capabilities that define the performance of modern digital organizations.
Insights from Experts about Sustainable IT infrastructure
From Christophe Girardier, CEO and co-founder of Glimpact:
"When it comes to environmental development, only examining carbon emissions does not allow for the whole picture. Extreme weather events, upheaval of the daily lives of consumers and complex environmental regulations are just a few of the ways that climate change is already impacting businesses globally. But understanding true sustainability requires more than just addressing carbon emissions, leaders must understand the full picture to assess full risk and make informed decisions.
Transitioning away from the myopic 'carbon footprint paradigm' requires a radically different vision of the ecological crisis. The EU intends to impose its robust PEF/OEF approach as the only methodological framework to implement new regulations which are now coming into force for industrial players around the world. For U.S. companies who want to market their products to the EU, they must embrace these new standards rather than risk being ostracized by European consumers, or worse, having the onus of EU regulations bar them from the market entirely. As we look ahead to the coming year, smart C-suite executives that take the time to understand nuances associated with true sustainability are those that will be most prepared in this new era of global risk."
From Jennifer Eden, CEO and Co-Founder, Tampon Tribe:
"I am reaching out regarding your call for entrepreneurs to discuss the pivotal role of sustainability in shaping business and IT infrastructure decisions. As the CEO and Co-Founder of Tampon Tribe, a brand at the forefront of integrating sustainability into every aspect of our operations, I am keen to share our journey and the strategic decisions we've made to uphold our commitment to the environment.
Sustainability is not just a facet of Tampon Tribe; it is the backbone of our business model and operational philosophy. This commitment influences our decisions from product development to packaging, marketing, and especially our IT infrastructure. We leverage cloud-based solutions to minimize our carbon footprint, employ data analytics for efficient resource management, and continuously seek out eco-friendly technologies that align with our sustainability goals.
Our approach has been to view sustainability as an investment rather than a cost, one that pays dividends not only in terms of environmental impact but also in customer loyalty and brand differentiation. Navigating the challenges of maintaining sustainable practices while ensuring operational efficiency has been a rewarding journey, offering valuable lessons on the integration of eco-conscious strategies in a digital landscape."
From Rob Dillan, founder of EVhype, a premier online platform dedicated to mapping electric vehicle (EV) charging stations across the US and Canada:
As the founder of EVhype.com, I have strategically embedded sustainability at the core of our business and IT infrastructure decisions, recognizing its pivotal role in driving long-term success and resilience.
Sustainability in Business Strategy:
Sustainability isn't just an add-on; it's integral to our business model. By prioritizing eco-friendly practices, we not only minimize environmental impact but also align with the growing consumer demand for green products, enhancing brand loyalty and market competitiveness.
Sustainability in IT Infrastructure:
In our IT operations, sustainability means optimizing energy efficiency, from choosing green hosting providers for our digital platforms to implementing cloud-based solutions that reduce the need for physical servers. This approach not only lowers carbon footprints but also results in significant cost savings.
From Judah Longgrear, CEO of Nickelytics & CEO of JI & JL Capital:
Sustainability is a key consideration as we shape our business and IT infrastructure at our distributed company. Since most of our employees work remotely around the world, we have consciously crafted policies and practices to reduce unnecessary travel, commuting, and resource use.
For example, rather than flying team members to a central location for meetings, we leverage video conferencing and collaboration software as much as possible. This eliminates many flights and long drives while still enabling productive global conversations. We also have hubs on a few continents to facilitate periodic regional gatherings when some face-to-face strategy is essential. Even then, we try to coordinate teams being in the same location to maximize in-person time while minimizing individual trips.
In terms of infrastructure, we heavily utilize cloud computing, which is generally more sustainable than on-premise data centers in terms of energy use and efficiency.
Enabling location-flexible work and leveraging technology for collaboration helps us reduce our environmental impact. We're proud of the strides made but also recognize there are always more opportunities to build a sustainable business for the future.
From Jonathan Morgan CEO at Venture Smarter
One of the ways sustainability in business shapes our IT infrastructure decisions is through our hardware choices. We prioritize energy-efficient equipment and look for products with eco-friendly certifications. This not only helps us reduce our carbon footprint but also often leads to long-term cost savings.
But it's not just about the hardware; it's also about how we use it. We're constantly optimizing our systems and processes to minimize energy consumption and maximize efficiency. Whether it's through virtualization, cloud computing, or smart power management strategies, we're always looking for ways to do more with less.
And of course, we're big believers in the power of technology to drive positive change. So, we're always exploring innovative solutions that leverage IT to promote sustainability, whether that's through smart city initiatives, renewable energy projects, or environmental monitoring systems.