- What is software reliability?
- Reliability in Life-Critical vs. Business-Critical Systems
- Reliability vs. Availability vs. Resilience
- Availability Targets: What “Nines” Actually Mean
- Key Reliability Metrics: MTTR, MTBF, MTTD, and Error Rate
- Achieving Software Reliability Through Design
- SLIs, SLOs, and SLAs Explained
- Practical SLO Example: E-Commerce Checkout Service
- Error Budgets in Practice
- The Three Pillars of Observability
- Kubernetes Reliability: Engineering for Container-Native Systems
- Gart Solutions — Production Example
- Chaos Engineering: Testing Reliability Under Adversarial Conditions
- Incident Management Workflow
- Production Readiness Review (PRR)
- Reliability Testing Strategies
- How SRE & DevOps Work Together
- The Reliability Engineering Stack
- Business Impact of Reliable Software
- Conclusion
Downtime costs more than money — it erodes trust, damages reputation, and in critical systems, can cost lives. At Gart Solutions, we engineer software systems that don’t just function — they excel in reliability. Using proven DevOps and SRE practices across production environments, we ensure your digital product is fast, stable, and always ready.
When you use a software product, you expect it to work well and meet your needs. But what does it mean for software to be “high quality”? According to the ISO 9126 standard, the quality of a software product is defined by all its features and characteristics that allow it to meet the needs of its users. One key aspect of quality is how reliable the software is.
This 2026 guide covers software reliability from the ground up: what it means, how to measure it, how to achieve it through SRE and DevOps, and how to handle the hardest operational challenges — from Kubernetes cluster failures to multi-cloud incident response.
What is software reliability?
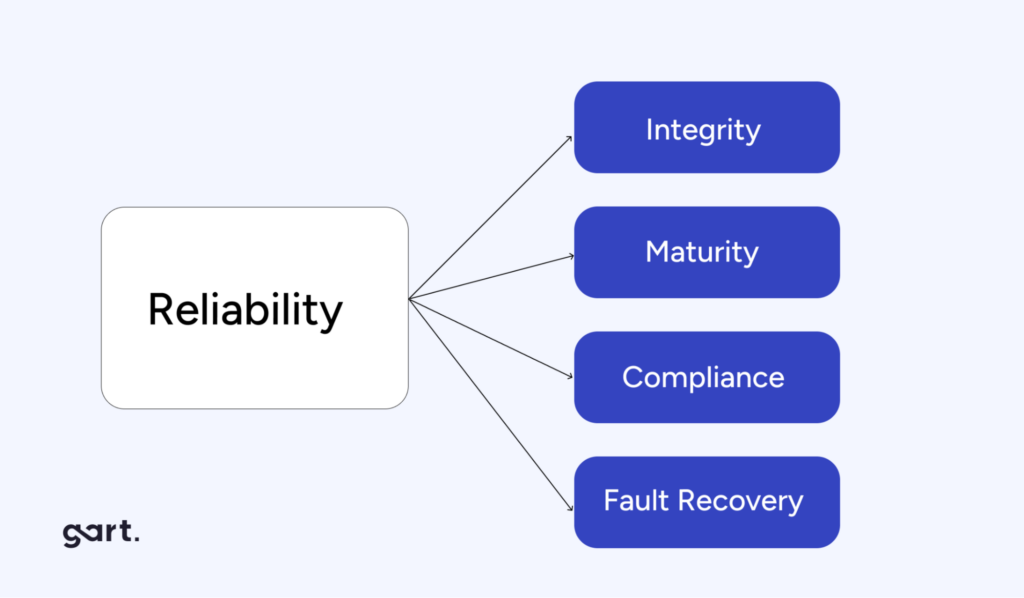
Software reliability is the probability that a software system will perform its required functions under specified conditions for a specified period. It is one of the six core dimensions of software quality defined by the ISO/IEC 9126 standard, alongside functionality, usability, efficiency, maintainability, and portability.
Two elements are central to any practical definition of software reliability:
- The environment: the deployment context — cloud, on-premises, containerized, edge — directly determines what “correct operation” looks like and which failure modes are most probable.
- The time frame: reliability is always expressed over a period (e.g., 99.9% availability over 30 days), not as an absolute state.
Unlike hardware reliability — which is largely determined by physical manufacturing tolerances — software reliability emerges from the quality of design decisions. A single overlooked null pointer, an unhandled race condition, or an improperly configured retry policy can cascade into a total service outage. This is why modern SRE and DevOps disciplines treat reliability as an engineering problem, not an operational afterthought.
At Gart Solutions, we understand that software reliability isn’t just a technical goal—it’s a critical component of business success. Our approach to building reliable digital solutions leverages the best practices of DevOps and Site Reliability Engineering (SRE), ensuring that your software not only meets but exceeds industry standards for reliability.
According to Carnegie Mellon University, software reliability is defined as the probability that software will operate without failure under specified conditions for a specified period. Unlike hardware reliability — which depends on manufacturing precision — software reliability is rooted in design perfection: careful architecture, rigorous testing, and continuous operational feedback.
Reliability in Life-Critical vs. Business-Critical Systems
The stakes of software reliability vary dramatically by context. In life-critical systems — aviation, medical devices, nuclear control software — a single failure can result in catastrophic loss. The Boeing 737 Max MCAS software defect contributed to two fatal crashes; the root cause was a reliability failure in sensor data validation logic.
In business-critical systems, reliability failures translate to measurable financial and reputational harm. Gartner estimates the average cost of unplanned downtime at $5,600 per minute — exceeding $300,000 per hour for enterprise environments. For high-traffic e-commerce platforms, a 10-minute checkout system failure during peak hours can result in hundreds of thousands of dollars in lost conversions and irreversible customer churn.
Reliability vs. Availability vs. Resilience
These three terms are frequently confused — even by experienced engineers. Understanding how they differ is foundational to building and operating reliable systems.
The Software Reliability Triad
Three distinct properties — all required for production-grade systems
Reliability
Probability of correct function over time. Focused on failures per unit time (MTBF). A system can be available but unreliable (returns wrong data).
Availability
Percentage of time a system is operational and reachable. Expressed as uptime percentage. A highly available system can still deliver incorrect results.
Resilience
Ability to withstand and recover from failures — hardware faults, traffic spikes, dependency outages. Measured by MTTR and failure blast radius.
Availability Targets: What “Nines” Actually Mean
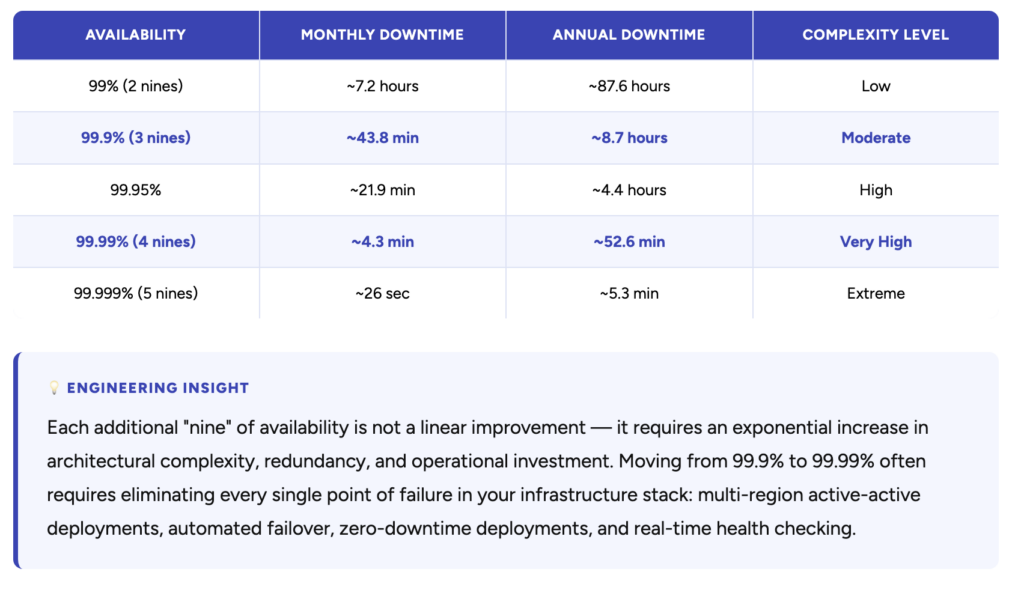
When engineering teams set availability SLOs, they express them as percentages — commonly called “nines.” The table below shows what each level means in concrete downtime terms:
Key Reliability Metrics: MTTR, MTBF, MTTD, and Error Rate
Reliability engineering lives and dies by measurable signals. The following four metrics form the operational backbone of any SRE program. Without them, reliability is aspirational — with them, it becomes engineerable.
MTTR
Average time to restore service after a failure. The single most impactful metric for user experience. Target: under 30 minutes for critical systems.
MTBF
How often failures occur. A higher MTBF indicates more stable, reliable software. Foundation for long-term reliability trend analysis.
MTTD
How quickly your team detects issues after they occur. Driven entirely by monitoring quality. Undetected failures are the silent killers of reliability.
Error Rate
Percentage of requests resulting in errors (5xx). Directly linked to your SLIs. A spike in error rate is frequently the first indicator of a degrading service.
Reducing MTTR by 60% for a SaaS Platform
During a Kubernetes migration for a high-traffic SaaS client, we implemented Prometheus + Grafana Golden Signal dashboards with automated PagerDuty escalation. Combined with ArgoCD progressive delivery and automated rollback triggers, we achieved the following over a 60-day period:
Achieving Software Reliability Through Design
Reliability is not retrofitted — it is architected from the first design decision. Organizations that treat reliability as a post-deployment concern invariably accumulate technical debt that becomes exponentially more expensive to address under production pressure.
Core Design Principles for Reliable Systems
- Design for failure: Assume every component will fail. Build services that degrade gracefully, implement circuit breakers, and use bulkhead patterns to contain failure blast radius.
- Stateless services where possible: Stateless components are horizontally scalable and trivially restartable. State should be externalized to purpose-built stores with their own reliability guarantees.
- Idempotency: Retrying failed operations should be safe. Design APIs and message handlers to be idempotent — the same request processed twice must produce the same result.
- Consistency vs. availability trade-off (CAP theorem): In distributed systems, you cannot simultaneously guarantee consistency, availability, and partition tolerance. Define which you prioritize — and design accordingly.
- Avoid synchronous chains: Long chains of synchronous service calls multiply latency and create cascading failure vectors. Use asynchronous messaging with dead-letter queues for non-blocking reliability.
Achieving high levels of software reliability begins with the design phase. Design perfection is the foundation upon which reliable software is built. This involves not only the creation of robust algorithms and data structures but also careful consideration of how the software will interact with other systems and environments.
For example, a software application that runs smoothly on a local server may experience reliability issues when deployed in a cloud environment due to differences in infrastructure. Therefore, understanding the target environment and designing the software to perform well under those conditions is crucial for achieving reliability.
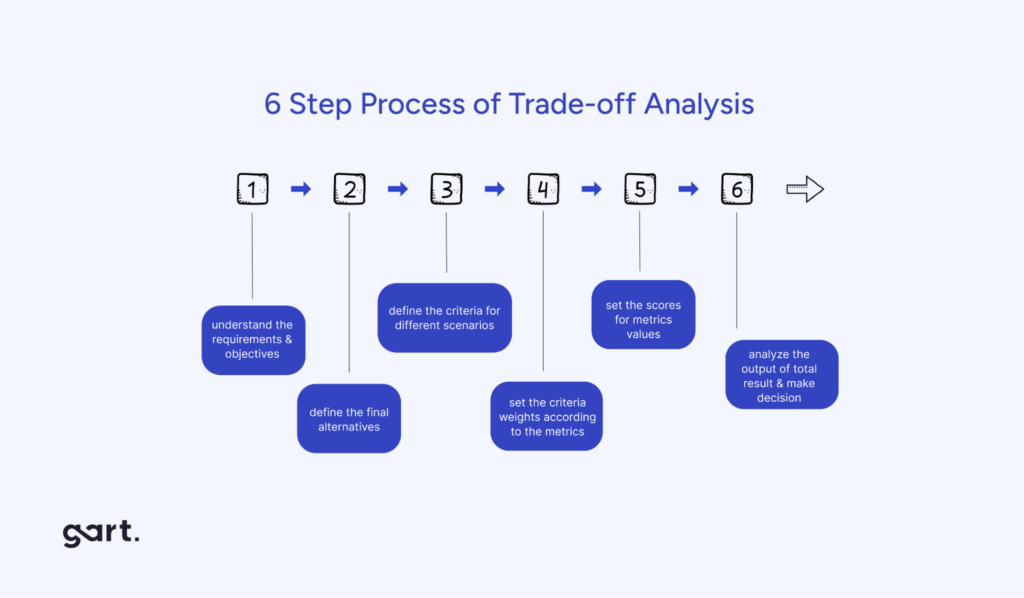
Another important consideration is the trade-off between availability and consistency. In highly available systems, such as those used in financial transactions, ensuring that the system is always online may come at the cost of data consistency. For instance, to ensure high availability, a system might cache data locally to reduce dependency on external systems, but this can lead to data inconsistency if the cache is not regularly updated. Additionally, as availability targets increase (e.g., moving from 99.9% to 99.999%), the complexity of the system architecture also increases exponentially.
SREs must carefully balance these trade-offs to ensure that the system remains both reliable and consistent.
Common Reliability Anti-Patterns to Avoid
| Anti-Pattern | Risk | Correct Approach |
|---|---|---|
| Unbounded retry loops | Amplifies load during outages; causes cascading failures | Exponential backoff + jitter + retry limits |
| No health checks | Load balancers route to dead instances | Liveness + readiness probes (Kubernetes) |
| Synchronous external calls without timeout | Thread exhaustion; full service unavailability | Timeouts + circuit breaker pattern |
| Single database instance | Single point of failure; zero failover | Primary-replica with automatic promotion |
| Undifferentiated error handling | Swallowed errors; invisible failures | Structured error taxonomy + alerting per type |
| No capacity limits | Resource exhaustion under load spikes | Rate limiting, connection pooling, queue depth limits |
SLIs, SLOs, and SLAs Explained
Service Level Indicators, Objectives, and Agreements form the language of reliability commitments. Understanding how they differ — and how they connect — is foundational for every SRE and engineering leader.
SLI
Service Level Indicator — a specific, measurable metric that directly reflects user experience.
Examples: Request latency at P95, availability percentage, error rate.
SLO
Service Level Objective — the target value or range for an SLI, expressed over a rolling window.
Example: 99.5% of requests must return non-5xx over a 28-day window.
SLA
Service Level Agreement — a contractual commitment to customers, typically with financial penalties for breach. SLAs are set conservatively below SLOs to provide a buffer.
Error Budget
The allowable margin of unreliability derived from the SLO.
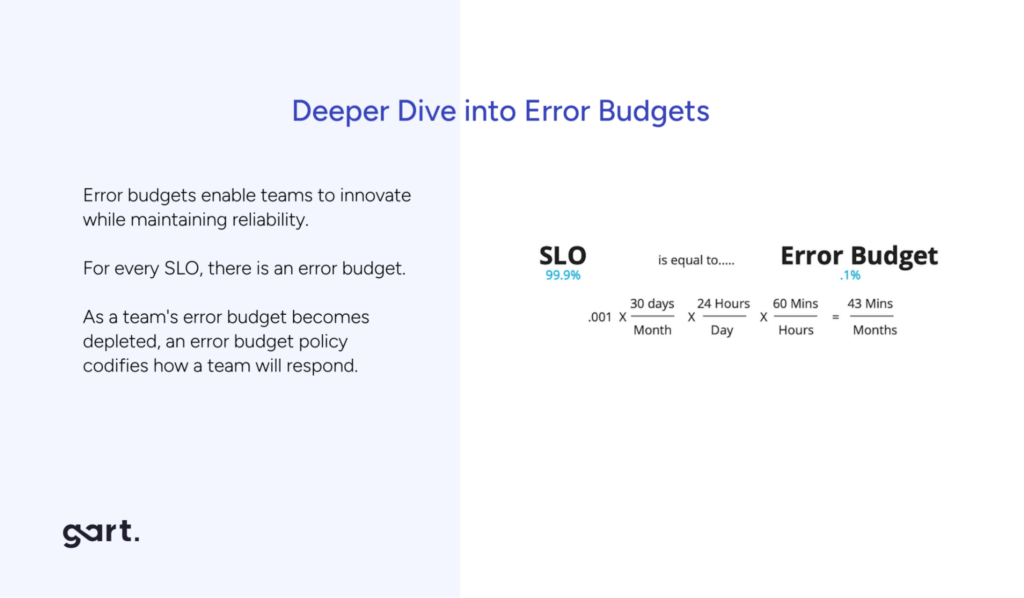
Example: If your SLO is 99.9%, your error budget is 0.1% — roughly 43.8 minutes of downtime per month.
Measuring Software Reliability: SLOs and SLIs
To quantify and manage software reliability, organizations often use Service Level Objectives (SLOs) and Service Level Indicators (SLIs). SLOs are specific targets for system performance, such as the time it takes to acknowledge an order on an e-commerce platform. SLIs, on the other hand, are metrics that measure how well the system is performing against these targets.
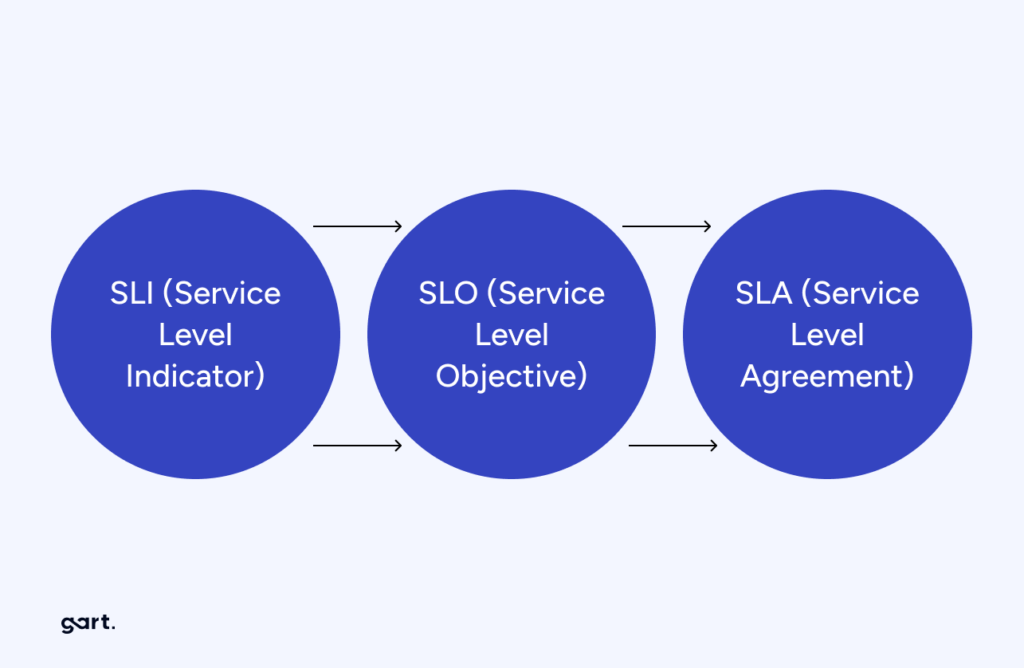
For example, an SLO might specify that 99.9% of order acknowledgments must occur within two seconds. The SLI would then measure the actual performance of the system to determine if this target is being met. If the SLI indicates that the system is failing to meet the SLO, this serves as an early warning sign that the system’s reliability is at risk, prompting further investigation and remediation.
SLOs and SLIs provide a customer-centric view of reliability, helping organizations ensure that their systems meet user expectations. They also create a feedback loop that allows teams to continuously improve their systems by making data-driven decisions based on real-world performance.
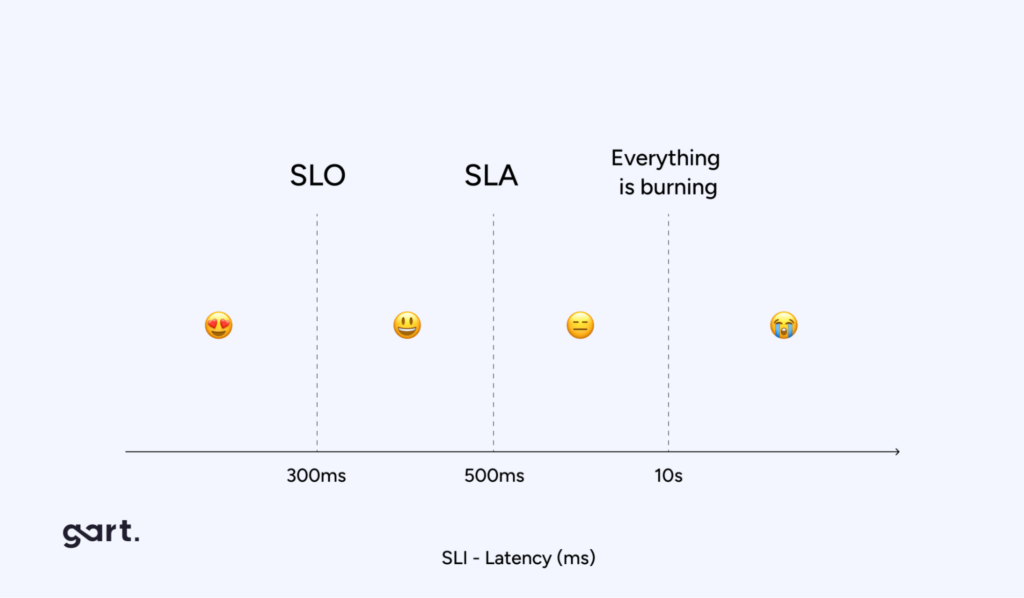
SLOs are a key component of SRE. They define the desired reliability level of a service, usually expressed in terms of availability, latency, or error rates
Practical SLO Example: E-Commerce Checkout Service
📋 SLO Definition
Availability Metric
Latency Metric
SLI Formula Examples
Availability SLI
Latency SLI
Throughput SLI
Error Budgets in Practice
Error budgets are one of SRE’s most powerful innovations — they transform the reliability vs. velocity tension from a cultural conflict into a data-driven policy. The core concept: if your SLO is 99.9% availability, you have a 0.1% “budget” of allowable errors per rolling window. Spend that budget wisely.
📊 Error Budget Health Dashboard — Illustrative Example
28-day rolling window — Checkout API (Target: 99.9%)
Error budgets
SRE introduces the concept of error budgets, which define the acceptable amount of unreliability for a given period (balance low quality releases with operational circumstances). This allows teams to balance innovation and reliability.
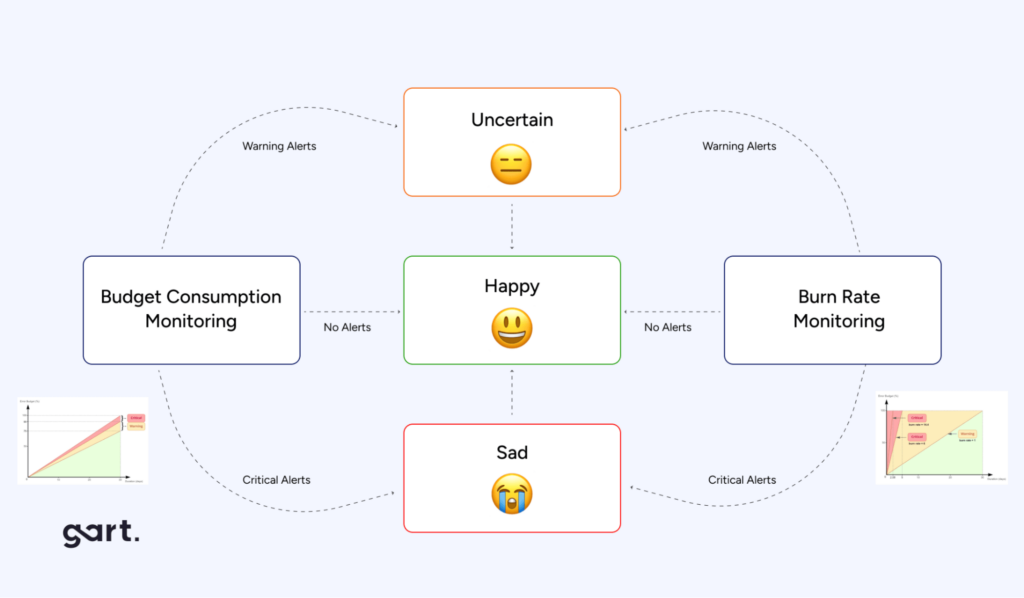
If the error budget is exceeded, development slows down, and efforts are refocused on improving stability.
Error Budget Policy: What Happens When You Run Out
- Budget > 50% remaining: Normal development velocity. Feature releases proceed on schedule.
- Budget 25–50% remaining: Reliability review required before each release. On-call team reviews deployment risk.
- Budget < 25% remaining: High-risk deployments paused. Engineering focus shifts to reliability improvements and postmortems.
- Budget exhausted: All non-critical deployments frozen until SLO window resets. Leadership escalation required.
Key Takeaway
Error budgets make the reliability vs. innovation trade-off explicit and quantitative. Rather than engineering and operations teams debating whether a service is “stable enough” to release, the error budget provides an objective answer — one that both sides agreed to define before any crisis occurred.
The Three Pillars of Observability
- Metrics: Numerical time-series data aggregated at regular intervals. Fast to query, efficient to store. Best for trend analysis and alerting. Examples: request rate, latency percentiles, error count.
- Logs: Structured, timestamped event records capturing the context of individual operations. Essential for debugging — answering “what exactly happened for request ID X?” Requires structured logging (JSON) for practical analysis at scale.
- Traces: Distributed request journeys showing how a single user request flows across multiple services. Critical for diagnosing latency in microservice architectures. OpenTelemetry has become the de-facto standard for trace instrumentation.
The Four Golden Signals (Google SRE Framework)
Latency
Time from request to response. Distinguish successful request latency from error latency — errors that return in 1ms are still failures. Monitor P50, P95, P99.
Errors
Rate of failed requests — explicit (5xx), implicit (success code but wrong content), and policy failures. Error rate is the most direct SLI for availability SLOs.
Traffic
Volume of demand on your system — requests per second, messages consumed, active WebSocket connections. Traffic context makes other signals meaningful.
Saturation
Resource utilization approaching limits — CPU, memory, disk I/O, connection pool exhaustion. Many performance failures are predictable from saturation trends 30+ minutes in advance.
Kubernetes Reliability: Engineering for Container-Native Systems
Kubernetes has become the dominant substrate for production workloads — and it introduces a distinct set of reliability challenges that go beyond traditional VM-based infrastructure. A misconfigured liveness probe, an absent Pod Disruption Budget, or an unset resource request can silently degrade your SLO while your dashboards show green.
Essential Kubernetes Reliability Practices
| Practice | Why It Matters | Common Mistake |
|---|---|---|
| Liveness & Readiness Probes | Kubernetes restarts unhealthy pods and withholds traffic from unready ones | Identical probe logic — probing the wrong endpoint or missing the probe entirely |
| Resource Requests & Limits | Enables scheduler to guarantee compute; limits prevent noisy-neighbor problems | Setting limits too low (OOMKilled); setting no requests (unpredictable scheduling) |
| Pod Disruption Budgets (PDB) | Ensures minimum pod count during voluntary disruptions (node drain, cluster upgrades) | No PDB set — rolling updates can take all pods offline simultaneously |
| Horizontal Pod Autoscaler (HPA) | Scales pod count based on CPU/custom metrics to handle traffic spikes | Scaling on CPU alone while the bottleneck is I/O or database connections |
| Multi-Zone Topology Spread | Distributes pods across availability zones — prevents zonal failure from taking the service down | All replicas scheduled in the same zone due to missing topology constraints |
| Progressive Delivery (ArgoCD Rollouts) | Canary and blue-green deployments limit blast radius of bad releases | All-at-once deployments that fail 100% of traffic on a broken release |
Gart Solutions — Production Example
Implementing ArgoCD Progressive Delivery for Zero-Downtime Releases
A fintech client was experiencing 3–5 minute service degradations during each deployment due to rolling update misconfiguration. We implemented ArgoCD Rollouts with automated Prometheus-based analysis gates: if error rate exceeded 0.5% during the canary phase, the rollout automatically paused and rolled back.
Result: deployment rollback time dropped from 45 minutes to under 4 minutes, and zero customer-impacting deployments in the following 6 months.
Chaos Engineering: Testing Reliability Under Adversarial Conditions
Chaos engineering is the discipline of intentionally introducing controlled failures into production (or production-like) systems to verify that they behave reliably under adversarial conditions. The guiding principle, from Netflix’s pioneering work: “the best time to find out your system handles failure poorly is before your users do.”
📌 Definition
Chaos engineering is not “breaking things randomly” — it is a disciplined, hypothesis-driven experiment. You define a steady state (e.g., “P95 latency < 300ms”), introduce a specific perturbation (e.g., “kill one of three database replicas”), then observe whether the steady state holds. If it doesn’t, you’ve discovered a reliability gap before it became a customer-impacting incident.
Chaos Engineering Experiment Workflow
Define Steady State
What does “normal” look like? Set baseline SLI values.
Form Hypothesis
“Killing one pod should not degrade availability below 99.9%”
Introduce Failure
Use Chaos Mesh / LitmusChaos to inject fault in a controlled scope.
Observe & Measure
Monitor Golden Signals against baseline throughout experiment.
Learn & Fix
If steady state broke, identify root cause and harden system.
Common Chaos Experiment Types
- Pod kill / node drain: Tests Kubernetes self-healing and PDB correctness
- Network latency injection: Validates timeout and circuit breaker configurations
- Memory pressure: Confirms OOMKilled pods restart within SLO
- Dependency outage: Tests graceful degradation when external APIs are unavailable
- Zone failure simulation: Confirms multi-AZ traffic rerouting works correctly
Incident Management Workflow
A well-defined incident management process is the difference between a 10-minute recovery and a 10-hour war room. Effective SRE teams treat incident response as an engineered workflow — not a heroic improvisation.
The 5-Phase Incident Lifecycle
Detection
Alert fired from monitoring (Prometheus/PagerDuty), customer report, or anomaly detection. MTTD goal: under 5 minutes for critical services. Key tool: automated alerting on SLO burn rate — not raw metric thresholds.
Triage & Severity Assignment
On-call engineer assesses user impact and assigns severity level (SEV1–SEV4). SEV1 = full service down; SEV4 = minor degradation, no SLO impact. Severity determines escalation path and response team composition.
Containment & Mitigation
First priority: stop the bleeding. Rollback the last deployment, reroute traffic, scale up replicas, or enable feature flags to disable the failing component. Mitigation is not fixing the root cause — it’s restoring user-facing service.
Root Cause Analysis
Use distributed traces, structured logs, and timeline reconstruction to identify the specific trigger. Ask “why” five times. Distinguish proximate cause (what broke) from contributing factors (why it was breakable).
Blameless Postmortem
Document the full incident timeline, contributing factors, and — critically — specific action items with owners and deadlines. Blameless culture is non-negotiable: psychological safety is a prerequisite for learning from failures. Distribute postmortem to all engineering stakeholders within 48 hours.
Incident Severity Matrix
| Severity | Impact | Response Time | Escalation |
|---|---|---|---|
| SEV1 | Total service outage — all users affected | < 5 min | Immediate — CTO/VP Engineering |
| SEV2 | Major feature degraded — >20% users affected | < 15 min | Engineering Lead + On-call team |
| SEV3 | Minor feature degraded — workaround available | < 1 hour | On-call engineer |
| SEV4 | Cosmetic or non-impacting issue | Next business day | Ticket created, no immediate action |
Production Readiness Review (PRR)
A Production Readiness Review is a structured assessment conducted before a new service or major feature reaches production. Its purpose: verify that the system is ready to operate reliably at scale before users depend on it.
At Gart Solutions, our PRR process evaluates 7 domains for every service entering production:
- Reliability targets defined:SLIs and SLOs documented and agreed upon by engineering and product
- Monitoring and alerting in place:Golden Signals instrumented, dashboards created, PagerDuty routing configured
- Runbooks written:On-call engineers know how to respond to every alert without escalation
- Load testing completed:System validated at 2× expected peak traffic with no SLO breach
- Failure modes identified:Dependency failures, data corruption scenarios, and resource exhaustion paths documented
- Deployment and rollback plan documented:Progressive delivery strategy defined; rollback validated in staging
- On-call coverage assigned:Primary and secondary on-call identified with escalation path confirmed
Reliability Testing Strategies
Reliability is only real if it’s been tested under conditions that approximate production reality. The following testing strategies form a complementary suite — each catches failure modes the others miss.
| Test Type | Purpose | Tools | When to Run |
|---|---|---|---|
| Load Testing | Validate performance at expected peak traffic | k6, Locust, Gatling | Pre-release, post-architecture change |
| Stress Testing | Find the breaking point beyond normal load | k6, JMeter | Quarterly, before major traffic events |
| Soak / Endurance Testing | Detect memory leaks and degradation over time | Custom scripts + APM | Pre-major releases |
| Chaos Engineering | Verify behavior under unexpected component failures | Chaos Mesh, LitmusChaos | Ongoing, in staging + production |
| Failover Testing | Confirm automatic failover works as expected | Cloud provider tooling | After infrastructure changes |
| Disaster Recovery (DR) Drills | Validate RTO and RPO in realistic scenarios | Runbook execution | At minimum twice per year |
⚠️ Common Pitfall
Most organizations run load tests before launch — then never again. Production traffic patterns evolve, new dependencies are added, database schemas change. A system that passed a load test 18 months ago may have completely different performance characteristics today. Schedule reliability tests as recurring engineering calendar items, not one-time pre-launch rituals.
How SRE & DevOps Work Together
While DevOps and Site Reliability Engineering (SRE) share similar goals, they take distinct approaches to improving software quality and operational excellence. Together, they form a powerful combination for building and maintaining highly reliable systems.
DevOps focuses on unifying development and operations teams to enable continuous integration and delivery (CI/CD), faster releases, and automation throughout the software lifecycle. It’s about breaking silos and enabling speed without sacrificing control.
SRE, introduced by Google, brings a more metrics-driven, engineering-centric approach to reliability. It emphasizes SLOs (Service Level Objectives), error budgets, monitoring, and incident response to ensure systems meet reliability targets without slowing innovation. SRE uses engineering principles to solve operations challenges, making it a natural evolution of DevOps.
Here’s how they compare in key areas:
| Dimension | DevOps | Site Reliability Engineering (SRE) |
|---|---|---|
| Primary Focus | Automating delivery & collaboration | Ensuring system reliability and availability |
| Key Practices | CI/CD, IaC, automation, shift-left testing | SLOs, SLIs, error budgets, monitoring, postmortems |
| Goal | Fast, frequent, reliable deployments | Maintain reliability while enabling innovation |
| Approach | Cultural transformation + tooling | Engineering rigor + quantitative metrics |
| Key Metrics | Deployment frequency, lead time, change failure rate | Latency, availability, error rate, MTTR |
| On-Call? | Shared responsibility — devs on-call for what they ship | Dedicated SRE on-call rotation with escalation paths |
The Reliability Engineering Stack
A modern reliability engineering stack integrates tools across the full observability and delivery lifecycle:
Metrics collection & alerting
Dashboards & visualization
Tracing & instrumentation
Log aggregation
On-call alerting
Progressive delivery
Container orchestration
Infrastructure as code
Chaos engineering
Load testing
Business Impact of Reliable Software
Software reliability is not a technical goal disconnected from business outcomes — it is one of the highest-ROI investments an organization can make in its engineering capability.
The Financial Case
Gartner’s research consistently places the average cost of IT downtime at $5,600 per minute — exceeding $300,000 per hour for enterprise organizations. For SaaS platforms, the compounding effects of downtime include:
- Direct revenue loss: Every minute of checkout unavailability is revenue that cannot be recovered.
- SLA penalty payments: Enterprise contracts increasingly include uptime SLAs with financial remedies.
- Customer acquisition cost amplification: Each churned user due to reliability failure requires marketing spend to replace.
- Engineering opportunity cost: Post-incident remediation consumes engineering capacity that could otherwise deliver features.
Reliability as a Competitive Differentiator
In saturated markets, reliability is increasingly the factor that differentiates category leaders from everyone else. Expedia famously increased annual revenue by $12 million by eliminating a single confusing field from their payment form — a reliability improvement in user experience that directly converted to measurable business outcomes.
Organizations that invest in SRE programs consistently report:
- Higher Net Promoter Scores (NPS) — reliability builds user trust over time
- Lower customer support load — reliable software generates fewer tickets
- Faster enterprise sales cycles — robust SLA commitments reduce procurement risk
- Higher engineering team retention — on-call engineers on well-monitored, reliable systems experience significantly lower burnout
Ready to Engineer Reliability Into Your Systems?
Gart Solutions brings hands-on SRE and DevOps expertise to companies scaling their digital products. From SLO design and monitoring stack implementation to full incident management programs — we help engineering teams build systems that stay up, recover fast, and scale confidently.
SRE Services
SLO/SLI design, error budget implementation, Golden Signal monitoring, on-call program setup
DevOps Engineering
CI/CD pipelines, Infrastructure as Code (Terraform), Kubernetes setup, progressive delivery
IT Monitoring & Observability
Prometheus + Grafana + OpenTelemetry stack, alerting design, dashboard engineering
Kubernetes Reliability
Cluster hardening, multi-zone deployments, HPA, PDB, progressive delivery with ArgoCD
Disaster Recovery
RTO/RPO design, backup strategies, DR drill facilitation, multi-region failover
IT Audit
Infrastructure and reliability maturity assessment with actionable improvement roadmap
The stakes are high. According to Gartner, the average cost of IT downtime is $5,600 per minute —that’s more than $300,000 per hour. For customer-facing platforms, each moment of unavailability can result in lost sales, churn, and negative reviews. For internal systems, downtime stalls productivity and decision-making.
This is why reliability is no longer optional. It’s a strategic necessity.
Conclusion
Software reliability is a complex but essential aspect of modern software systems. It requires a deep understanding of the software’s design, the environment in which it operates, and the expectations of its users. By focusing on design perfection, setting clear reliability objectives, and leveraging the practices of Site Reliability Engineering, organizations can build and maintain systems that are not only functional but also reliable.
Ready to enhance your system’s reliability?
Partner with Gart to design, build, and maintain a robust digital solution that meets your business needs. Our experts are here to guide you through every step of the process, ensuring your software operates flawlessly and efficiently.
Learn more from our cases.
Get a Free Software Reliability Consultation
Whether you’re launching or scaling, our SRE experts will build a plan to help your product stay fast, reliable, and secure.
See how we can help to overcome your challenges