Cost-effectiveness in cloud and DevOps isn't about finding the cheapest provider — it's about building systems that reduce total cost of ownership while supporting long-term business growth. Here's what that actually looks like in practice.
27%
of cloud spend estimated wasted
Flexera State of the Cloud, 2024
81%
compute cost reduction via Azure Spot VMs
Gart Solutions Case Study
48%
infrastructure cost reduction after FinOps audit
Gart Solutions Case Study
65%
dev/test cost reduction with environment scheduling
AWS Well-Architected Framework
What Cost-Effectiveness Really Means in DevOps and Cloud
Most IT leaders define cost-effectiveness as "spending less." That's wrong — and it's an expensive misunderstanding.
True cost-effectiveness means maximizing the value generated by every dollar of infrastructure and engineering investment. It demands that you ask not "How do I pay less this month?" but "How do I build systems that cost less over the next 24 months while delivering higher performance, reliability, and innovation velocity?"
In DevOps and cloud contexts specifically, cost-effectiveness sits at the intersection of three disciplines:
Engineering efficiency — architectures that avoid waste, scale predictably, and minimize manual toil
Financial governance — visibility, accountability, and discipline over variable cloud spend (FinOps)
Strategic investment — knowing where to spend more now to spend significantly less later
💡Key TakeawayCost-effectiveness is not a cost-cutting exercise. It is a discipline that aligns engineering decisions with financial reality — and it requires ongoing operational practice, not a one-time audit.
According to the FinOps Foundation, cloud financial management is "an evolving discipline that enables organizations to get maximum business value by helping engineering, finance, technology, and business teams collaborate on data-driven spending decisions." That's the operating definition we work from at Gart.
Why the Cheapest Option Is Never the Cost-Effective One
Businesses chasing cheap options in cloud and DevOps consistently encounter the same patterns of failure. Here's what actually happens.
The Free Credits Trap
Cloud startup programs from Google Cloud, AWS, and Azure are genuinely valuable — but they create a dangerous incentive. Engineering teams optimize for "doesn't cost us anything right now" rather than "performs well when we're paying for it." When credits expire, organizations face infrastructure costs 3–5× higher than necessary because no one designed for efficiency.
This happened to a startup we worked with that built its entire HoloLens application on GCP. When startup program credits ran out, their monthly bill became unmanageable — primarily driven by egress costs from a network architecture that was invisible during the free period.
Read the full case study
According to Flexera's 2024 State of the Cloud Report, organizations estimate that 27% of cloud spend is wasted. For a company spending $50,000/month on cloud infrastructure, that's $162,000 in annual waste — far exceeding any short-term savings from choosing cheaper tooling upfront.
Hidden Costs of "Budget" DevOps Solutions
Choosing the cheapest DevOps tooling or most junior engineers to "save money" introduces costs that never appear on the invoice:
Technical debt that requires expensive rewrites within 12–18 months
Incidents and downtime — every hour of downtime costs engineering time, customer trust, and revenue
Re-platforming costs when infrastructure can't scale with the business
Security vulnerabilities from skipped compliance and patching practices
Talent attrition from teams forced to maintain poor infrastructure
Common MistakeEvaluating cloud infrastructure costs on a monthly basis instead of a 24-month TCO. Month-one "savings" from cheap choices almost always invert by month 12 when technical debt accumulates and rebuilding begins.
Estimate Your Real Cloud Waste
Our engineers run a free 30-minute cloud waste assessment — identifying where your budget is leaking before it becomes a bigger problem.
Book Free Assessment →
Sustainable IT Cost Reductions vs. Short-Term Cuts
Economic pressure creates a predictable pattern: CIOs issue blanket cost-reduction mandates, teams cut immediately visible line items, and six months later the organization is dealing with the consequences of those cuts while overspending in new areas.
The Four Traps of Reckless Cost-Cutting
1Short-term focus
Cutting without understanding which investments generate future savings. Eliminating a $2,000/month monitoring tool can cause a $50,000 incident that goes undetected for 48 hours.
2Overreliance on consultants
External consultants often identify low-hanging fruit but rarely address the structural issues that cause waste to return within 6 months.
3Ignoring stakeholders
Cutting DevOps tooling that engineering teams rely on creates invisible productivity drag. A $5,000/month tool that saves 40 hours of engineering time is deeply cost-effective.
4Skipping rightsizing
Organizations consistently run workloads on instance types provisioned for peak load from 18 months ago. Average CPU utilization in enterprise cloud is 12–15% (Gartner, 2023).
✓
Expert Insight — Fedir Kompaniiets
In every cost reduction engagement we run, we start with observation before optimization. Two weeks of detailed cost attribution by environment, team, and workload consistently reveals 3–4 major cost drivers that don't appear on any executive dashboard. Fix those first, then establish process to prevent recurrence.
Avoid These 3 Common Mistakes:
Short-term focus: Cutting across the board can hinder future growth and innovation.
Overreliance on consultants: Consultants often suggest low-hanging fruit, leaving limited potential for long-term savings.
Neglecting stakeholders: Ignoring the impact of IT cuts on business operations can damage relationships and hinder outcomes.
The GART Sustainable DevOps Framework
Over seven years of cloud and DevOps engagements, we've codified our approach into a repeatable five-stage methodology. Every client engagement moves through these stages — sometimes rapidly, sometimes over 12 months — depending on starting maturity.
Proprietary Methodology
GART Sustainable DevOps Framework™
Five stages from cloud chaos to compounding cost efficiency
1
Visibility
Full cost attribution by team, service, and environment. No optimization without visibility.
2
Optimization
Rightsize, schedule, and re-architect for efficiency. Target waste before adding governance.
3
Automation
IaC, autoscaling, and CI/CD eliminate manual drift and provisioning waste.
4
Governance
Budgets, alerts, tagging standards, and FinOps rituals embedded into team workflows.
5
Sustainability
Continuous improvement, GreenOps, and cost culture that compounds savings over time.
Most organizations arrive at Gart somewhere in Stage 1 or early Stage 2 — they have cloud spend, but limited attribution. The fastest ROI comes from moving through Stage 2 quickly: systematic rightsizing, environment scheduling, and reserved capacity typically deliver 20–40% cost reduction before any architectural changes.
Methodology
Framework stages are sequential by design. Organizations that attempt Stage 4 governance without Stage 1 visibility consistently fail — teams cannot govern what they cannot see. All percentage savings cited in this article reflect results measured over 60–90 day periods after implementation, compared to the 60-day baseline period preceding engagement.
How to Audit Cloud Waste: A Practical Guide
Before optimizing anything, you need to know where money is going. A cloud waste audit is not a one-time exercise — it's a structured review that should happen quarterly at minimum, and monthly for organizations spending over $20,000/month.
In one AWS environment audit completed in 2024, 22% of monthly spend came from idle non-production clusters left running after work hours. A single automated shutdown schedule eliminated $8,400/month with zero impact on developer productivity.
The Seven Categories of Cloud Waste
Waste CategoryWhat to Look ForTypical ImpactFix DifficultyIdle non-production environmentsClusters, VMs running 24/7 despite 8-hour usage patterns15–25% of computeLowOrphaned resourcesUnattached EBS volumes, unused Elastic IPs, idle load balancers5–12% of spendLowOverprovisioned instancesVMs at <10% average CPU; memory wastage >60%10–30% of computeMediumStorage wasteOld snapshots, stale S3 objects in hot tier, logging bloat8–20% of storageLowExcessive NAT gateway costsHigh data processing from poorly routed traffic5–15% of networkingMediumOverprovisioned Kubernetes clustersNode pools sized for peak; pod autoscaling not configured20–40% of computeHighReserved capacity mismatchReserved Instances for deprecated instance types or dead workloads10–20% of reserved spendMediumThe Seven Categories of Cloud Waste
Kubernetes Cost Optimization: The Hidden Driver
For organizations running container-based workloads, Kubernetes cost optimization deserves special attention. The CNCF reports container adoption accelerating, while cost governance for containerized workloads consistently lags. Common Kubernetes waste sources:
Oversized node pools — teams provision for maximum workload and never scale down
Missing Vertical Pod Autoscaler (VPA) — pods run at requested resources, not actual usage
No namespace-level cost attribution — developers can't see the financial impact of their services
Persistent volumes left after pod deletion — a common source of mystery storage charges
Inefficient base images — large images increase pull time, storage, and data transfer costs
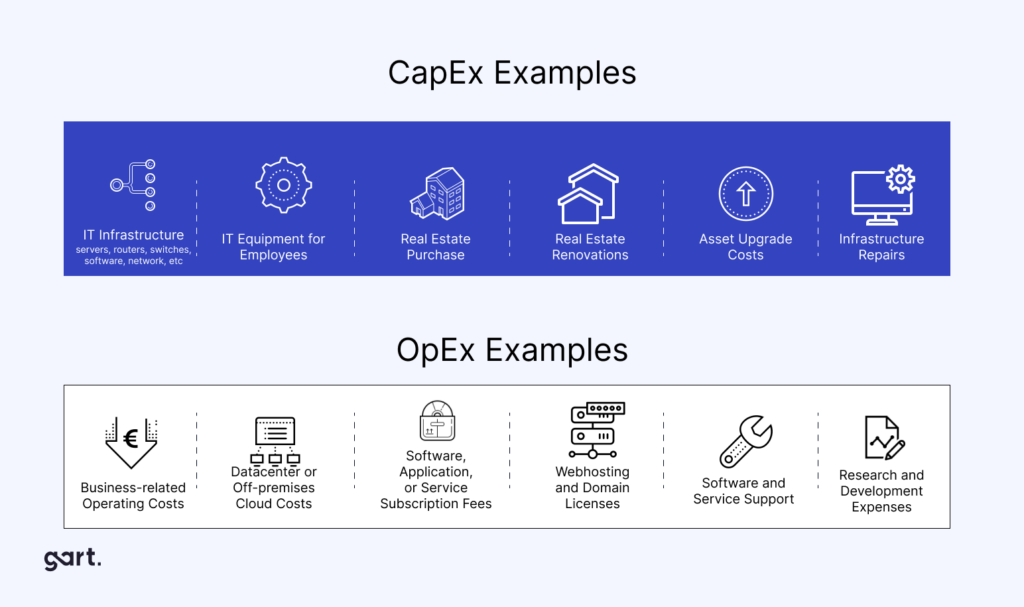
Understanding Cloud Costs in DevOps: OpEx vs. CapEx
Summary:
DevOps-related cloud costs fall into two main categories: Operational Expenses (OpEx) and Capital Expenses (CapEx). Knowing the difference helps you budget and optimize more effectively.
Operational Expenses (OpEx)
OpEx refers to ongoing costs of running DevOps workloads in the cloud, such as:
Cloud instance runtime (compute)
Storage usage
Managed services (like databases or monitoring tools)
Traffic and bandwidth
These costs are typically pay-as-you-go and vary month-to-month.
Capital Expenses (CapEx)
CapEx refers to one-time or upfront investments, such as:
Reserved cloud capacity (e.g., AWS Reserved Instances)
On-premise infrastructure purchases
Software licenses or setup fees
Choosing CapEx can reduce monthly spending, but it requires commitment and forecasting.
The shift from on-premises CapEx to cloud OpEx is one of the most consequential changes in enterprise IT finance — and one of the most misunderstood. Getting this right is foundational to cost-effectiveness.
CriteriaCapEx (On-premises)OpEx (Cloud)Nature of expenseLarge upfront investmentOngoing, usage-based costsTax treatmentDepreciated over 3–7 yearsFully deductible in year incurredCapacity flexibilitySized for peak; most capacity often idleElastic; scales with actual demandBudget predictabilityPredictable after purchaseVariable — requires FinOps disciplineRefresh cycle riskTechnology obsolescence every 3–5 yearsAlways on current-generation hardwareOptimization leverLimited after purchaseContinuous — rightsize at any timeUnderstanding Cloud Costs in DevOps: OpEx vs. CapEx
⚠️ Key Risk
The OpEx model's flexibility is also its danger. Without FinOps governance, cloud costs can grow unchecked. Organizations that achieve genuine cost-effectiveness pair cloud adoption with FinOps discipline from day one — not after the first unpleasant invoice.
Reserved Instances vs. Savings Plans: A Practical Decision
One of the highest-ROI cost-effectiveness decisions is committing to reserved capacity for stable, predictable workloads. The AWS Well-Architected Framework recommends reserving 70–80% of steady-state workloads on 1-year or 3-year terms — savings typically range from 30–60% versus on-demand pricing.
The critical nuance: never reserve capacity before rightsizing. Organizations that purchase Reserved Instances for oversized instances lock in waste for up to three years. The sequence must always be: rightsize → reserve → monitor.
What is FinOps and Why It Matters for Cost-Effectiveness
FinOps — Financial Operations for Cloud — bridges engineering, finance, and product to ensure cloud spending generates proportional business value. According to the FinOps Foundation's State of FinOps Report, organizations with mature FinOps practices achieve 20–35% better cloud cost efficiency than those without, while also shipping faster because engineers spend less time firefighting budget overruns.
FinOps Maturity Stages
StageCharacteristicsTypical Cloud WasteCrawlReactive cost management; no attribution; single monthly review30–40%WalkCost dashboards in place; basic tagging; weekly review; some rightsizing15–25%RunReal-time visibility; anomaly alerts; automated optimization; team accountability5–12%FinOps Maturity Stages
What is FinOps and Why Does It Matter in Cost Optimization
Summary:
FinOps (Financial Operations) is a framework that brings financial discipline into DevOps, ensuring cloud spending is aligned with business value and usage.
Defining FinOps in Simple Terms
FinOps helps teams:
Understand where cloud dollars are going
Predict costs before deploying
Optimize spend without stalling innovation
It’s the bridge between engineering, finance, and operations.
Why FinOps is a Game-Changer
In traditional IT, budgets are fixed. But in the cloud, expenses are variable and usage-driven. That makes cost control harder, unless teams actively manage and monitor costs.
FinOps brings visibility and accountability across:
Engineers (who build infrastructure)
Finance teams (who manage budgets)
Product managers (who track business value)
Key FinOps Practices:
Real-time cloud cost reporting
Cost forecasting by team/project
Tagging resources for accountability
Optimization sprints focused on spend reduction.
FinOps, or Financial Operations, is an evolving cloud financial management discipline that brings financial accountability to the variable spend model of cloud, enabling distributed teams to make business trade-offs between speed, cost, and quality.
Practical FinOps Workflow: What We Actually Do
Most FinOps guides describe what FinOps is. This is what a real FinOps workflow looks like in practice — the process we run with clients from month one.
1
Tag all resources consistently
Implement mandatory tagging: team, environment, project, owner. Enforce at IAM policy level so untagged resources cannot be created. This is the foundation without which nothing else works.
2
Group by business unit and create budgets
Assign cost center ownership to each team. Set budgets based on prior 60-day actuals + growth rate. Finance and engineering must agree on these numbers together — not separately.
3
Identify anomalies with automated alerting
Configure alerts at 80% and 100% of budget thresholds. Add anomaly detection for day-over-day spend increases above 20%. Route alerts to the responsible team, not just to finance.
4
Rightsize workloads based on utilization data
Pull 30-day CPU, memory, and I/O utilization. Identify instances with <15% average CPU utilization. Downsize, schedule, or terminate. Run compute optimizer recommendations with engineering review.
5
Apply reserved capacity for stable workloads
After rightsizing, commit to 1-year Reserved Instances or Savings Plans for workloads with >75% utilization consistency. Target 60–80% reservation coverage for steady-state infrastructure.
6
Measure and report savings monthly
Track absolute savings ($ vs. baseline), efficiency improvements ($ per workload unit), and coverage metrics (% of spend attributed, % reserved). Share results with leadership in a standardized report.
From Practice: What Takes Longest
The hardest part of FinOps implementation is not technical — it's behavioral. Getting engineers to care about cost requires connecting infrastructure decisions to outcomes they already care about: shipping faster, having more reliable systems, and avoiding firefighting. Cost culture is built through visibility, not mandates.
Get a FinOps Maturity Review
Understand where your organization sits on the FinOps maturity curve — and what specific steps will move you to the next level.
Get Free Review →
Cost-Effectiveness by Growth Stage
Cost-effectiveness strategies vary dramatically depending on where your organization sits in its growth curve. The right moves for a $3,000/month cloud spender are completely different from those for an enterprise spending $200,000/month.
Startup
<$5,000/month cloud spend
Priority Strategies
Maximize cloud credits — but design for paid operation from day one
Use managed services: your time costs more than the premium
Spot/Preemptible instances for all dev/test environments
Tag everything from the start — retroactive tagging is painful
Common Mistakes
Optimizing for the free tier instead of production costs
Running dev environments 24/7
Skipping logging/monitoring to "save money"
Governance
Monthly spend review is sufficient at this stage
One person owns cloud costs — ideally the CTO
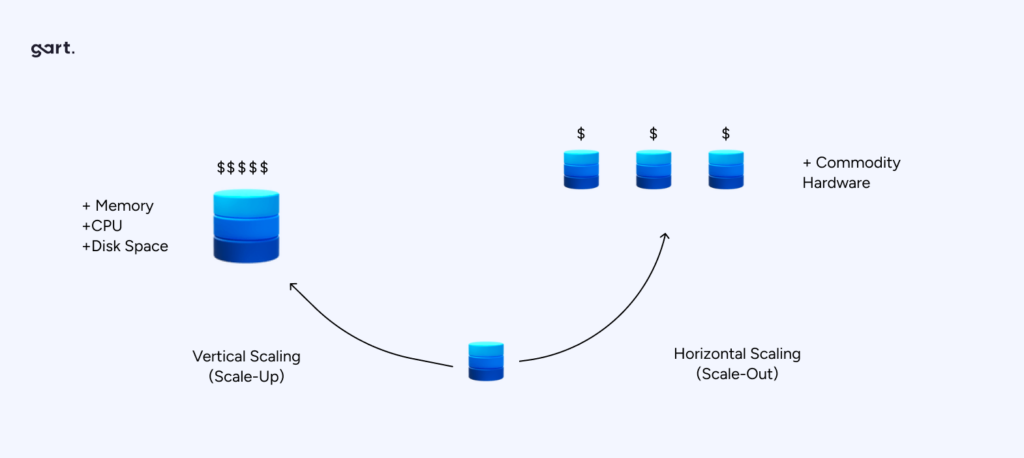
Scale-up
$5,000–$50,000/month
Priority Strategies
Rightsize aggressively — utilization data now justifies engineering time
Introduce reserved capacity for production workloads
Implement autoscaling for variable workloads
Start FinOps tagging and attribution by team
Common Mistakes
Reserving before rightsizing — locking in waste
No environment scheduling for non-production
Kubernetes without resource limits and VPA
Governance
Weekly FinOps review; budget alerts configured
Dedicated FinOps champion on engineering team
Enterprise
$50,000+/month
Priority Strategies
Multi-cloud cost governance and provider negotiation
AI/LLM workload cost management — inference can spike unexpectedly
GreenOps — carbon-aware workload scheduling
Full chargeback model by business unit
Common Mistakes
FinOps as a finance function, not an engineering practice
No anomaly detection — surprises cost $50K+
Reserved capacity decisions made annually without monthly review
Governance
Dedicated FinOps team; monthly executive reporting
Cloud cost embedded in engineering performance metrics
Case Studies: Cost-Effective DevOps in Depth
The following engagements are published with detailed methodology — not as marketing claims, but as evidence of what structured cost-effectiveness work actually looks like.
01
Startup · Google Cloud Platform · Infrastructure & FinOps
DevOps for Microsoft HoloLens Application on GCP
The Challenge
A startup leveraged Google Cloud startup credits to build and launch a HoloLens application. When credits expired, their monthly bill was unsustainable — primarily driven by egress costs from a network architecture that was never designed with production pricing in mind. Engineering had optimized for development speed, not operational cost.
Gart's Approach
We began with a full infrastructure audit covering resource utilization, network topology, data flow, and service dependencies. The audit identified excessive cross-region traffic, an underutilized Kubernetes cluster running 24/7, and no CI/CD pipeline. We restructured the architecture, implemented CI/CD, and introduced resource scheduling for non-production environments.
Before vs. After: Key Metrics (90-day period)
Before Optimization
Monthly infra: $14,200
Deployment: manual, weekly
MTTR: 4+ hours
Environment scheduling: none
Cost attribution: none
After Optimization
Monthly infra: $7,384 (−48%)
Deployment: CI/CD, daily
MTTR: <25 minutes
Environment scheduling: Auto-shutdown active
Cost attribution: Full tagging active
Lesson Learned
Free credits create a false sense of cost-effectiveness. Architecture decisions made during the "free" period determine your actual cost structure for years. The cheapest time to fix this is before go-live — the second cheapest is immediately after.
02
AI/ML Startup · Microsoft Azure · Compute Optimization & Spot VMs
81% Cloud Cost Reduction for Jewelry AI Vision Platform
The Challenge
A computer vision startup serving the jewelry industry was running heavy ML inference workloads on standard Azure VM instances. Monthly compute spend was $5,200 and growing. Workloads were batch-oriented — not requiring continuous availability — but were provisioned as always-on infrastructure due to the team's inexperience with Spot VM architecture.
Gart's Approach
We redesigned the ML pipeline for fault tolerance and elastic execution: workloads were refactored to checkpoint state, enabling interruption and resumption. Azure Spot VMs — available at 60–90% discount versus standard pricing — became viable. We also automated cost monitoring and introduced a queuing system so inference jobs distributed efficiently across available spot capacity.
Before vs. After: Key Metrics (90-day period)
Before Optimization
Monthly compute: $5,200
VM type: Standard D-series (on-demand)
Pipeline: stateful, non-interruptible
Scalability: manual resizing
Cost monitoring: none
After Optimization
Monthly compute: $988 (−81%)
VM type: Azure Spot VMs with auto-failover
Pipeline: Checkpointed, resumable workloads
Scalability: Automated elastic scaling
Cost monitoring: Real-time automated cost alerts
Lesson Learned
Cost savings of 80%+ do not require cutting features or accepting lower quality. They require understanding your workload's actual characteristics and designing infrastructure to match them. Most workloads have more tolerance for interruption than engineers assume — the challenge is making them resumable.
Contrarian Insights Worth Knowing
Cost-effectiveness advice in the cloud industry is often oversimplified. These are the nuanced positions that experienced practitioners hold — learned the hard way.
↯ Contrarian Insight #1
Moving to Kubernetes too early increases costs for small teams. Kubernetes is extraordinary at scale — but for teams running 5–10 services, the operational overhead of cluster management, node autoscaling, and networking complexity regularly costs more in engineering time than it saves in compute. Evaluate managed containers (ECS, Cloud Run, Container Apps) first.
↯ Contrarian Insight #2
Spot Instances are not always the right optimization strategy for stateful workloads. The 60–90% compute savings are real — but only for workloads designed for interruption. Retrofitting stateful databases or session-sensitive applications for Spot usage can require weeks of engineering work. Include that refactoring cost in your ROI calculation.
↯ Contrarian Insight #3
Observability spend is one of the highest-ROI investments in cost-effectiveness. Most organizations cut monitoring to save money — and then spend far more responding to incidents they couldn't detect quickly. A $2,000/month observability stack that reduces MTTR from 4 hours to 20 minutes pays for itself in the first incident alone. Never cut observability in the name of cost reduction.
↯ Contrarian Insight #4
Multi-cloud complexity often costs more than it saves. Multi-cloud is sound for risk management, but introduces operational complexity, tooling duplication, and skill fragmentation. For organizations under $500K/month in cloud spend, true multi-cloud is rarely cost-effective. Hybrid cloud — one primary cloud plus on-prem for stable workloads — is often the more pragmatic answer.
Long-Term Benefits of a Cost-Effective DevOps Strategy
Sustainable cost-effectiveness compounds over time in ways that short-term cost-cutting never can. Here's what our clients experience over 12–24 months.
1. Lower Total Cost of Ownership (TCO)
Efficient systems cost less to operate, require fewer emergency interventions, and eliminate the costly cycle of re-platforming. Organizations that invest in proper architecture early consistently report 30–50% lower 24-month TCO compared to those that optimize reactively.
2. Greater Reliability and Faster MTTR
Cost-effective systems are inherently more reliable. Proper autoscaling eliminates capacity-driven outages. CI/CD pipelines reduce deployment risk. IaC eliminates configuration drift. All of these reduce the frequency and cost of incidents — among the most expensive and hidden costs in any DevOps operation.
3. Future-Proof Architecture That Scales Without Rewrites
The most expensive infrastructure is the kind you have to rebuild. Strategic architecture choices — containerization, IaC, microservices where appropriate — allow systems to evolve incrementally. We've seen organizations spend 6–12 months rebuilding because early "cost savings" decisions painted them into architectural corners.
4. Engineering Teams That Build Instead of Firefight
When infrastructure is stable, well-monitored, and cost-attributed, engineering teams stop spending cycles on incidents and manual operations. Organizations implementing structured DevOps practices typically recover 20–30% of engineering capacity previously consumed by toil — capacity redirected toward product development.
5. AI and LLM Workload Cost Management
As organizations adopt AI features, inference costs are becoming a significant and poorly-managed budget line. Cost-effective AI workload management requires: choosing the right model size for each use case, implementing caching for repeated queries, monitoring token usage with the same rigor as compute, and batching inference requests where latency tolerance allows.
DevOps Cost Decision Table: Cheap vs. Sustainable
CriteriaCheap Approach✅ Sustainable ApproachInitial CostLow upfront — appears to save moneyModerate; aligned with business goalsScalabilityRequires rebuild at 2–3× current loadDesigned to scale incrementallyCompliance ReadinessLacks HIPAA, GDPR, SOC 2 safeguardsCompliance built into architectureMonitoring & ObservabilityMinimal or none — incidents are invisibleFull stack monitoring; fast MTTRMaintenance overheadHigh manual toil; frequent firefightingAutomated; low operational overheadEngineering riskConfiguration drift; no IaC; no rollbackIaC; version-controlled; reversible24-month TCOHigh — technical debt, rebuilds, incidentsLower — compounding efficiency gainsBusiness impactRisk of downtime; slower delivery velocityFaster delivery; greater stabilityDevOps Cost Decision Table: Cheap vs. Sustainable
Cost-Effectiveness Audit Checklist for IT Leaders
☑
Cloud Cost-Effectiveness Self-Assessment
Infrastructure & Cloud Usage
Are production workloads rightsized based on 30-day utilization data (not peak estimates)?
Are reserved instances or Savings Plans covering 60–80% of steady-state compute?
Do non-production environments auto-shut during off-hours and weekends?
Are Spot/Preemptible instances used for suitable batch and ML workloads?
Have orphaned resources (unattached EBS, unused IPs, idle load balancers) been audited in the last 30 days?
Kubernetes & Container Costs
Are resource requests and limits set on all pods?
Is Vertical Pod Autoscaler (VPA) or KEDA configured for variable workloads?
Are namespace-level cost dashboards visible to engineering teams?
Are persistent volumes cleaned up after pod deletion?
FinOps & Financial Governance
Are all resources tagged by team, environment, and project — enforced at IAM level?
Do budget alerts fire at 80% and 100% of monthly budgets?
Is cost visibility shared between engineering and finance teams weekly?
Has a FinOps champion been identified within the engineering organization?
Are chargeback reports distributed to business unit owners monthly?
DevOps & Automation
Is all infrastructure managed as code (Terraform, Pulumi, CDK)?
Are CI/CD pipelines automated to prevent manual deployment drift?
Is autoscaling configured based on real demand metrics, not static thresholds?
Are deployment rollbacks tested and confirmed functional?
How to Use This Checklist
Any "not implemented" item in the Infrastructure or FinOps sections represents a direct and typically sizable cost-saving opportunity. Prioritize items that take least engineering time to implement first — environment scheduling and orphan cleanup alone can recover 15–25% of monthly cloud spend within two weeks.
Lessons Learned from Real Engagements
We believe in sharing what didn't work as readily as what did. These are genuine lessons from client engagements.
✗
Lesson 1: We Optimized Compute Before Analyzing Networking
In one early engagement, we spent three weeks rightsizing EC2 instances before discovering the majority of the client's bill came from NAT gateway data processing fees — completely unrelated to compute. Always run a full cost attribution audit by service category before beginning targeted optimization. Compute is the most visible cost but not always the largest.
✗
Lesson 2: Reserved Instance Purchases Without Engineering Buy-In Fail
We've seen finance teams purchase Reserved Instances based on billing data without engineering input — only to have engineering migrate or resize those workloads within 90 days, leaving expensive reservations for infrastructure that no longer exists. FinOps decisions must involve engineering. Reserved capacity commitments require a minimum 6-month infrastructure stability forecast, which only engineers can provide.
✓
Lesson 3: The First Win Matters More Than the Biggest Win
When beginning a cost-effectiveness engagement, we now prioritize finding a quick, visible win in the first two weeks — typically environment scheduling or orphaned resource cleanup. This win builds trust, demonstrates that optimization doesn't disrupt operations, and creates organizational momentum for harder architectural changes later.
How Gart Delivers Cost-Effective DevOps
From cloud waste audits to full FinOps implementation — practical, engineering-led cost-effectiveness that compounds over time.
🔍
Cloud Cost Audit
Full infrastructure review identifying waste, rightsizing opportunities, and quick-win savings within 2 weeks.
⚙️
DevOps Services
CI/CD pipelines, IaC, and automation that eliminate operational toil and reduce the cost of delivery.
☁️
Cloud Migration
Right-sized, cost-conscious migration from on-premises or inefficient cloud configurations to optimized architecture.
📊
FinOps Implementation
Cost dashboards, tagging, budgets, and FinOps rituals embedded into your engineering team's workflow.
☸️
Kubernetes Optimization
Right-size node pools, configure VPA/HPA, and implement namespace cost attribution for container workloads.
🛡️
IT Audit Services
Infrastructure, compliance, and security audits that surface both risk exposure and cost reduction opportunities.
Book a Free Assessment
View All Case Studies
In my experience optimizing cloud costs, especially on AWS, I often find that many quick wins are in the "easy to implement - good savings potential" quadrant.
[lwptoc]
That's why I've decided to share some straightforward methods for optimizing expenses on AWS that will help you save over 80% of your budget.
Choose reserved instances
Potential Savings: Up to 72%
Choosing reserved instances involves committing to a subscription, even partially, and offers a discount for long-term rentals of one to three years. While planning for a year is often deemed long-term for many companies, especially in Ukraine, reserving resources for 1-3 years carries risks but comes with the reward of a maximum discount of up to 72%.
You can check all the current pricing details on the official website - Amazon EC2 Reserved Instances
Purchase Saving Plans (Instead of On-Demand)
Potential Savings: Up to 72%
There are three types of saving plans: Compute Savings Plan, EC2 Instance Savings Plan, SageMaker Savings Plan.
AWS Compute Savings Plan is an Amazon Web Services option that allows users to receive discounts on computational resources in exchange for committing to using a specific volume of resources over a defined period (usually one or three years). This plan offers flexibility in utilizing various computing services, such as EC2, Fargate, and Lambda, at reduced prices.
AWS EC2 Instance Savings Plan is a program from Amazon Web Services that offers discounted rates exclusively for the use of EC2 instances. This plan is specifically tailored for the utilization of EC2 instances, providing discounts for a specific instance family, regardless of the region.
AWS SageMaker Savings Plan allows users to get discounts on SageMaker usage in exchange for committing to using a specific volume of computational resources over a defined period (usually one or three years).
The discount is available for one and three years with the option of full, partial upfront payment, or no upfront payment. EC2 can help save up to 72%, but it applies exclusively to EC2 instances.
Utilize Various Storage Classes for S3 (Including Intelligent Tier)
Potential Savings: 40% to 95%
AWS offers numerous options for storing data at different access levels. For instance, S3 Intelligent-Tiering automatically stores objects at three access levels: one tier optimized for frequent access, 40% cheaper tier optimized for infrequent access, and 68% cheaper tier optimized for rarely accessed data (e.g., archives).
S3 Intelligent-Tiering has the same price per 1 GB as S3 Standard — $0.023 USD.
However, the key advantage of Intelligent Tiering is its ability to automatically move objects that haven't been accessed for a specific period to lower access tiers.
Every 30, 90, and 180 days, Intelligent Tiering automatically shifts an object to the next access tier, potentially saving companies from 40% to 95%. This means that for certain objects (e.g., archives), it may be appropriate to pay only $0.0125 USD per 1 GB or $0.004 per 1 GB compared to the standard price of $0.023 USD.
Information regarding the pricing of Amazon S3
AWS Compute Optimizer
Potential Savings: quite significant
The AWS Compute Optimizer dashboard is a tool that lets users assess and prioritize optimization opportunities for their AWS resources.
The dashboard provides detailed information about potential cost savings and performance improvements, as the recommendations are based on an analysis of resource specifications and usage metrics.
The dashboard covers various types of resources, such as EC2 instances, Auto Scaling groups, Lambda functions, Amazon ECS services on Fargate, and Amazon EBS volumes.
For example, AWS Compute Optimizer reproduces information about underutilized or overutilized resources allocated for ECS Fargate services or Lambda functions. Regularly keeping an eye on this dashboard can help you make informed decisions to optimize costs and enhance performance.
Use Fargate in EKS for underutilized EC2 nodes
If your EKS nodes aren't fully used most of the time, it makes sense to consider using Fargate profiles. With AWS Fargate, you pay for a specific amount of memory/CPU resources needed for your POD, rather than paying for an entire EC2 virtual machine.
For example, let's say you have an application deployed in a Kubernetes cluster managed by Amazon EKS (Elastic Kubernetes Service). The application experiences variable traffic, with peak loads during specific hours of the day or week (like a marketplace or an online store), and you want to optimize infrastructure costs. To address this, you need to create a Fargate Profile that defines which PODs should run on Fargate. Configure Kubernetes Horizontal Pod Autoscaler (HPA) to automatically scale the number of POD replicas based on their resource usage (such as CPU or memory usage).
Manage Workload Across Different Regions
Potential Savings: significant in most cases
When handling workload across multiple regions, it's crucial to consider various aspects such as cost allocation tags, budgets, notifications, and data remediation.
Cost Allocation Tags: Classify and track expenses based on different labels like program, environment, team, or project.
AWS Budgets: Define spending thresholds and receive notifications when expenses exceed set limits. Create budgets specifically for your workload or allocate budgets to specific services or cost allocation tags.
Notifications: Set up alerts when expenses approach or surpass predefined thresholds. Timely notifications help take actions to optimize costs and prevent overspending.
Remediation: Implement mechanisms to rectify expenses based on your workload requirements. This may involve automated actions or manual interventions to address cost-related issues.
Regional Variances: Consider regional differences in pricing and data transfer costs when designing workload architectures.
Reserved Instances and Savings Plans: Utilize reserved instances or savings plans to achieve cost savings.
AWS Cost Explorer: Use this tool for visualizing and analyzing your expenses. Cost Explorer provides insights into your usage and spending trends, enabling you to identify areas of high costs and potential opportunities for cost savings.
Transition to Graviton (ARM)
Potential Savings: Up to 30%
Graviton utilizes Amazon's server-grade ARM processors developed in-house. The new processors and instances prove beneficial for various applications, including high-performance computing, batch processing, electronic design automation (EDA) automation, multimedia encoding, scientific modeling, distributed analytics, and machine learning inference on processor-based systems.
The processor family is based on ARM architecture, likely functioning as a system on a chip (SoC). This translates to lower power consumption costs while still offering satisfactory performance for the majority of clients. Key advantages of AWS Graviton include cost reduction, low latency, improved scalability, enhanced availability, and security.
Spot Instances Instead of On-Demand
Potential Savings: Up to 30%
Utilizing spot instances is essentially a resource exchange. When Amazon has surplus resources lying idle, you can set the maximum price you're willing to pay for them. The catch is that if there are no available resources, your requested capacity won't be granted.
However, there's a risk that if demand suddenly surges and the spot price exceeds your set maximum price, your spot instance will be terminated.
Spot instances operate like an auction, so the price is not fixed. We specify the maximum we're willing to pay, and AWS determines who gets the computational power. If we are willing to pay $0.1 per hour and the market price is $0.05, we will pay exactly $0.05.
Use Interface Endpoints or Gateway Endpoints to save on traffic costs (S3, SQS, DynamoDB, etc.)
Potential Savings: Depends on the workload
Interface Endpoints operate based on AWS PrivateLink, allowing access to AWS services through a private network connection without going through the internet. By using Interface Endpoints, you can save on data transfer costs associated with traffic.
Utilizing Interface Endpoints or Gateway Endpoints can indeed help save on traffic costs when accessing services like Amazon S3, Amazon SQS, and Amazon DynamoDB from your Amazon Virtual Private Cloud (VPC).
Key points:
Amazon S3: With an Interface Endpoint for S3, you can privately access S3 buckets without incurring data transfer costs between your VPC and S3.
Amazon SQS: Interface Endpoints for SQS enable secure interaction with SQS queues within your VPC, avoiding data transfer costs for communication with SQS.
Amazon DynamoDB: Using an Interface Endpoint for DynamoDB, you can access DynamoDB tables in your VPC without incurring data transfer costs.
Additionally, Interface Endpoints allow private access to AWS services using private IP addresses within your VPC, eliminating the need for internet gateway traffic. This helps eliminate data transfer costs for accessing services like S3, SQS, and DynamoDB from your VPC.
Optimize Image Sizes for Faster Loading
Potential Savings: Depends on the workload
Optimizing image sizes can help you save in various ways.
Reduce ECR Costs: By storing smaller instances, you can cut down expenses on Amazon Elastic Container Registry (ECR).
Minimize EBS Volumes on EKS Nodes: Keeping smaller volumes on Amazon Elastic Kubernetes Service (EKS) nodes helps in cost reduction.
Accelerate Container Launch Times: Faster container launch times ultimately lead to quicker task execution.
Optimization Methods:
Use the Right Image: Employ the most efficient image for your task; for instance, Alpine may be sufficient in certain scenarios.
Remove Unnecessary Data: Trim excess data and packages from the image.
Multi-Stage Image Builds: Utilize multi-stage image builds by employing multiple FROM instructions.
Use .dockerignore: Prevent the addition of unnecessary files by employing a .dockerignore file.
Reduce Instruction Count: Minimize the number of instructions, as each instruction adds extra weight to the hash. Group instructions using the && operator.
Layer Consolidation: Move frequently changing layers to the end of the Dockerfile.
These optimization methods can contribute to faster image loading, reduced storage costs, and improved overall performance in containerized environments.
Use Load Balancers to Save on IP Address Costs
Potential Savings: depends on the workload
Starting from February 2024, Amazon begins billing for each public IPv4 address. Employing a load balancer can help save on IP address costs by using a shared IP address, multiplexing traffic between ports, load balancing algorithms, and handling SSL/TLS.
By consolidating multiple services and instances under a single IP address, you can achieve cost savings while effectively managing incoming traffic.
Optimize Database Services for Higher Performance (MySQL, PostgreSQL, etc.)
Potential Savings: depends on the workload
AWS provides default settings for databases that are suitable for average workloads. If a significant portion of your monthly bill is related to AWS RDS, it's worth paying attention to parameter settings related to databases.
Some of the most effective settings may include:
Use Database-Optimized Instances: For example, instances in the R5 or X1 class are optimized for working with databases.
Choose Storage Type: General Purpose SSD (gp2) is typically cheaper than Provisioned IOPS SSD (io1/io2).
AWS RDS Auto Scaling: Automatically increase or decrease storage size based on demand.
If you can optimize the database workload, it may allow you to use smaller instance sizes without compromising performance.
Regularly Update Instances for Better Performance and Lower Costs
Potential Savings: Minor
As Amazon deploys new servers in their data processing centers to provide resources for running more instances for customers, these new servers come with the latest equipment, typically better than previous generations. Usually, the latest two to three generations are available. Make sure you update regularly to effectively utilize these resources.
Take Memory Optimize instances, for example, and compare the price change based on the relevance of one instance over another. Regular updates can ensure that you are using resources efficiently.
InstanceGenerationDescriptionOn-Demand Price (USD/hour)m6g.large6thInstances based on ARM processors offer improved performance and energy efficiency.$0.077m5.large5thGeneral-purpose instances with a balanced combination of CPU and memory, designed to support high-speed network access.$0.096m4.large4thA good balance between CPU, memory, and network resources.$0.1m3.large3rdOne of the previous generations, less efficient than m5 and m4.Not avilable
Use RDS Proxy to reduce the load on RDS
Potential for savings: Low
RDS Proxy is used to relieve the load on servers and RDS databases by reusing existing connections instead of creating new ones. Additionally, RDS Proxy improves failover during the switch of a standby read replica node to the master.
Imagine you have a web application that uses Amazon RDS to manage the database. This application experiences variable traffic intensity, and during peak periods, such as advertising campaigns or special events, it undergoes high database load due to a large number of simultaneous requests.
During peak loads, the RDS database may encounter performance and availability issues due to the high number of concurrent connections and queries. This can lead to delays in responses or even service unavailability.
RDS Proxy manages connection pools to the database, significantly reducing the number of direct connections to the database itself.
By efficiently managing connections, RDS Proxy provides higher availability and stability, especially during peak periods.
Using RDS Proxy reduces the load on RDS, and consequently, the costs are reduced too.
Define the storage policy in CloudWatch
Potential for savings: depends on the workload, could be significant.
The storage policy in Amazon CloudWatch determines how long data should be retained in CloudWatch Logs before it is automatically deleted.
Setting the right storage policy is crucial for efficient data management and cost optimization. While the "Never" option is available, it is generally not recommended for most use cases due to potential costs and data management issues.
Typically, best practice involves defining a specific retention period based on your organization's requirements, compliance policies, and needs.
Avoid using an undefined data retention period unless there is a specific reason. By doing this, you are already saving on costs.
Configure AWS Config to monitor only the events you need
Potential for savings: depends on the workload
AWS Config allows you to track and record changes to AWS resources, helping you maintain compliance, security, and governance. AWS Config provides compliance reports based on rules you define. You can access these reports on the AWS Config dashboard to see the status of tracked resources.
You can set up Amazon SNS notifications to receive alerts when AWS Config detects non-compliance with your defined rules. This can help you take immediate action to address the issue. By configuring AWS Config with specific rules and resources you need to monitor, you can efficiently manage your AWS environment, maintain compliance requirements, and avoid paying for rules you don't need.
Use lifecycle policies for S3 and ECR
Potential for savings: depends on the workload
S3 allows you to configure automatic deletion of individual objects or groups of objects based on specified conditions and schedules. You can set up lifecycle policies for objects in each specific bucket. By creating data migration policies using S3 Lifecycle, you can define the lifecycle of your object and reduce storage costs.
These object migration policies can be identified by storage periods. You can specify a policy for the entire S3 bucket or for specific prefixes. The cost of data migration during the lifecycle is determined by the cost of transfers. By configuring a lifecycle policy for ECR, you can avoid unnecessary expenses on storing Docker images that you no longer need.
Switch to using GP3 storage type for EBS
Potential for savings: 20%
By default, AWS creates gp2 EBS volumes, but it's almost always preferable to choose gp3 — the latest generation of EBS volumes, which provides more IOPS by default and is cheaper.
For example, in the US-east-1 region, the price for a gp2 volume is $0.10 per gigabyte-month of provisioned storage, while for gp3, it's $0.08/GB per month. If you have 5 TB of EBS volume on your account, you can save $100 per month by simply switching from gp2 to gp3.
Switch the format of public IP addresses from IPv4 to IPv6
Potential for savings: depending on the workload
Starting from February 1, 2024, AWS will begin charging for each public IPv4 address at a rate of $0.005 per IP address per hour. For example, taking 100 public IP addresses on EC2 x $0.005 per public IP address per month x 730 hours = $365.00 per month.
While this figure might not seem huge (without tying it to the company's capabilities), it can add up to significant network costs. Thus, the optimal time to transition to IPv6 was a couple of years ago or now.
Here are some resources about this recent update that will guide you on how to use IPv6 with widely-used services — AWS Public IPv4 Address Charge.
Collaborate with AWS professionals and partners for expertise and discounts
Potential for savings: ~5% of the contract amount through discounts.
AWS Partner Network (APN) Discounts: Companies that are members of the AWS Partner Network (APN) can access special discounts, which they can pass on to their clients. Partners reaching a certain level in the APN program often have access to better pricing offers.
Custom Pricing Agreements: Some AWS partners may have the opportunity to negotiate special pricing agreements with AWS, enabling them to offer unique discounts to their clients. This can be particularly relevant for companies involved in consulting or system integration.
Reseller Discounts: As resellers of AWS services, partners can purchase services at wholesale prices and sell them to clients with a markup, still offering a discount from standard AWS prices. They may also provide bundled offerings that include AWS services and their own additional services.
Credit Programs: AWS frequently offers credit programs or vouchers that partners can pass on to their clients. These could be promo codes or discounts for a specific period.
Seek assistance from AWS professionals and partners. Often, this is more cost-effective than purchasing and configuring everything independently. Given the intricacies of cloud space optimization, expertise in this matter can save you tens or hundreds of thousands of dollars.
More valuable tips for optimizing costs and improving efficiency in AWS environments:
Scheduled TurnOff/TurnOn for NonProd environments: If the Development team is in the same timezone, significant savings can be achieved by, for example, scaling the AutoScaling group of instances/clusters/RDS to zero during the night and weekends when services are not actively used.
Move static content to an S3 Bucket & CloudFront: To prevent service charges for static content, consider utilizing Amazon S3 for storing static files and CloudFront for content delivery.
Use API Gateway/Lambda/Lambda Edge where possible: In such setups, you only pay for the actual usage of the service. This is especially noticeable in NonProd environments where resources are often underutilized.
If your CI/CD agents are on EC2, migrate to CodeBuild: AWS CodeBuild can be a more cost-effective and scalable solution for your continuous integration and delivery needs.
CloudWatch covers the needs of 99% of projects for Monitoring and Logging: Avoid using third-party solutions if AWS CloudWatch meets your requirements. It provides comprehensive monitoring and logging capabilities for most projects.
Feel free to reach out to me or other specialists for an audit, a comprehensive optimization package, or just advice.
Site Reliability Engineering (SRE) monitoring and application monitoring are two sides of the same coin: both exist to keep complex distributed systems reliable, performant, and transparent. For engineering teams managing microservices, Kubernetes, and cloud-native architectures, knowing what to measure—and how to act on it—is the difference between a 15-minute incident and an all-night outage.
This guide explains how the four Golden Signals serve as the foundation of production-grade application monitoring, how to connect them to SLIs, SLOs, and error budgets, and how to build dashboards and alerting workflows that actually reduce your MTTR.
KEY TAKEAWAYS
Golden Signals (latency, errors, traffic, saturation) are the universal language of SRE application monitoring across any tech stack.
Connecting signals to SLIs and SLOs turns raw metrics into reliability commitments your team can own.
Alert thresholds must be derived from baseline data and SLOs—the examples in this article are illustrative starting points, not universal rules.
After implementing Golden Signals, Gart clients have reduced MTTR by up to 60% within two months. Read the full case study context below.
What is SRE Monitoring?
SRE monitoring is the practice of continuously observing the health, performance, and availability of software systems using the methods and principles defined by Google's Site Reliability Engineering discipline. Unlike traditional system monitoring—which often tracks dozens of low-level infrastructure metrics—SRE monitoring is intentionally opinionated: it focuses on the signals that directly reflect user experience and system reliability.
At its core, SRE monitoring answers three questions at all times:
Is the system currently serving users correctly?
How close are we to breaching our reliability commitments (SLOs)?
Which service or component is responsible when something breaks?
This user-centric orientation is what separates SRE monitoring from generic infrastructure monitoring. An SRE team does not alert on "CPU at 80%"—they alert when that CPU spike is burning through their monthly error budget faster than expected.
Application Monitoring in the SRE Context
Application monitoring is the discipline of tracking how software applications behave in production: response times, error rates, throughput, resource consumption, and end-user experience. In an SRE context, application monitoring is the primary layer where Golden Signals are measured and where the gap between infrastructure health and user experience becomes visible.
A database node may be running at 40% CPU—perfectly healthy by infrastructure standards—while every query takes 4 seconds because of a missing index. Infrastructure monitoring shows green; application monitoring shows a latency crisis. This is why SRE teams invest heavily in application-level telemetry: it captures what infrastructure metrics miss.
Modern application monitoring spans three pillars:
Metrics — numerical time-series data (latency percentiles, error counts, RPS).
Logs — structured event records that capture request context and error detail.
Traces — distributed request journeys that map latency across service boundaries.
The Golden Signals framework unifies these pillars into four actionable categories that any team can monitor, regardless of their technology stack.
The Four Golden Signals in SRE
SRE principles streamline application monitoring by focusing on four metrics—latency, errors, traffic, and saturation—collectively known as Golden Signals. Instead of tracking hundreds of metrics across different technologies, this focused framework helps teams quickly identify and resolve issues.
Latency:Latency is the time it takes for a request to travel from the client to the server and back. High latency can cause a poor user experience, making it critical to keep this metric in check. For example, in web applications, latency might typically range from 200 to 400 milliseconds. Latency under 300 ms ensures good user experience; errors >1% necessitate investigation. Latency monitoring helps detect slowdowns early, allowing for quick corrective action.
Errors:Errors refer to the rate of failed requests. Monitoring errors is essential because not all errors have the same impact. For instance, a 500 error (server error) is more severe than a 400 error (client error) because the former often requires immediate intervention. Identifying error spikes can alert teams to underlying issues before they escalate into major problems.
Traffic:Traffic measures the volume of requests coming into the system. Understanding traffic patterns helps teams prepare for expected loads and identify anomalies that might indicate issues such as DDoS attacks or unplanned spikes in user activity. For example, if your system is built to handle 1,000 requests per second and suddenly receives 10,000, this surge might overwhelm your infrastructure if not properly managed.
Saturation:Saturation is about resource utilization; it shows how close your system is to reaching its full capacity. Monitoring saturation helps avoid performance bottlenecks caused by overuse of resources like CPU, memory, or network bandwidth. Think of it like a car's tachometer: once it redlines, you're pushing the engine too hard, risking a breakdown.
Why Golden Signals Matter
Golden Signals provide a comprehensive overview of a system's health, enabling SREs and DevOps teams to be proactive rather than reactive. By continuously monitoring these metrics, teams can spot trends and anomalies, address potential issues before they affect end-users, and maintain a high level of service reliability.
SRE Golden Signals help in proactive system monitoring
SRE Golden Signals are crucial for proactive system monitoring because they simplify the identification of root causes in complex applications. Instead of getting overwhelmed by numerous metrics from various technologies, SRE Golden Signals focus on four key indicators: latency, errors, traffic, and saturation.
By continuously monitoring these signals, teams can detect anomalies early and address potential issues before they affect the end-user. For instance, if there is an increase in latency or a spike in error rates, it signals that something is wrong, prompting immediate investigation.
What are the key benefits of using "golden signals" in a microservices environment?
The "golden signals" approach is especially beneficial in a microservices environment because it provides a simplified yet powerful framework to monitor essential metrics across complex service architectures.
Here’s why this approach is effective:
▪️Focuses on Key Performance Indicators (KPIs)
By concentrating on latency, errors, traffic, and saturation, the golden signals let teams avoid the overwhelming and often unmanageable task of tracking every metric across diverse microservices. This strategic focus means that only the most crucial metrics impacting user experience are monitored.
▪️Enhances Cross-Technology Clarity
In a microservices ecosystem where services might be built on different technologies (e.g., Node.js, DB2, Swift), using universal metrics minimizes the need for specific expertise. Teams can identify issues without having to fully understand the intricacies of every service’s technology stack.
▪️Speeds Up Troubleshooting
Golden signals quickly highlight root causes by filtering out non-essential metrics, allowing the team to narrow down potential problem areas in a large web of interdependent services. This is crucial for maintaining service uptime and a seamless user experience.
SRE Monitoring vs. Observability vs. Application Performance Monitoring (APM)
These three terms are often used interchangeably, but they refer to distinct practices with different scopes. Understanding where they overlap—and where they diverge—helps teams invest in the right tooling and processes.
DimensionSRE MonitoringObservabilityApplication Monitoring (APM)Primary questionAre we meeting our reliability targets?Why is the system behaving this way?How is this application performing right now?Core signalsGolden Signals + SLIs/SLOsLogs, metrics, traces (full telemetry)Response time, throughput, error rate, ApdexAudienceSRE / on-call engineersPlatform engineering, DevOps, SREDev teams, operations, managementTypical toolsPrometheus, Grafana, PagerDutyOpenTelemetry, Jaeger, ELK StackDatadog, New Relic, Dynatrace, AppDynamicsScopeService reliability & error budgetsFull system internal stateApplication transaction performanceSRE Monitoring vs. Observability vs. Application Performance Monitoring (APM)
In practice, mature engineering organizations treat these as complementary layers. Golden Signals surface what is wrong quickly; observability tooling explains why; APM dashboards give development teams actionable detail at the code level.
SLIs, SLOs, and Error Budgets in SRE Monitoring
Golden Signals generate raw measurements. SLIs and SLOs transform those measurements into reliability commitments that the business can understand and engineering teams can own.
Service Level Indicators (SLIs)
An SLI is a quantitative measure of a service behavior directly derived from a Golden Signal. For example:
Availability SLI: percentage of requests that return a non-5xx response.
Latency SLI: percentage of requests served in under 300ms (P95).
Throughput SLI: percentage of expected message batches processed within the SLA window.
Service Level Objectives (SLOs)
An SLO is the target value for an SLI over a rolling window. A well-formed SLO looks like: "99.5% of requests must return a non-5xx response over a rolling 28-day window." SLOs are the bridge between Golden Signals and business impact. When your SLO says 99.5% availability and you are at 99.2%, you are burning error budget—and that is the signal your team needs to prioritize reliability work over new features.
Error Budgets
An error budget is the allowable amount of unreliability defined by your SLO. For a 99.5% availability SLO over 28 days, the error budget is 0.5% of all requests—roughly 3.6 hours of complete downtime equivalent. When the error budget is healthy, teams can ship changes confidently. When it is depleted or burning fast, the SRE team has a data-driven mandate to freeze releases and focus on reliability.
Practical tip: Track error budget burn rate alongside your Golden Signals dashboard. A burn rate of 1x means you are consuming the budget at exactly the rate your SLO allows. A burn rate of 3x means you will exhaust your budget in one-third of the SLO window — an immediate escalation trigger.
How to Monitor Microservices Using Golden Signals
Monitoring microservices requires a disciplined approach in environments where dozens of services interact across different technology stacks. Golden Signals provide a clear framework for tracking system health across these distributed systems.
Step 1: Define Your Observability Pipeline per Service
Each microservice should expose telemetry for all four Golden Signals. Integrate them directly with your SLI definitions from day one:
Latency — measure P50, P95, and P99 request duration per service.
Errors — capture 4xx/5xx HTTP codes and application-level exceptions separately.
Traffic — monitor RPS, message throughput, and connection concurrency.
Saturation — track CPU, memory, thread pool usage, and queue depth.
Step 2: Choose a Unified Monitoring Stack
Popular platforms for production-grade application monitoring in microservices include:
Prometheus + Grafana — open-source, highly customizable, excellent for Kubernetes environments.
Datadog / New Relic — full-stack observability with built-in Golden Signals support and auto-instrumentation.
OpenTelemetry — CNCF-backed standard for vendor-neutral telemetry instrumentation.
Step 3: Isolate Service Boundaries
Group Golden Signals by service so you can detect where a problem originates rather than just knowing that something is wrong:
MicroserviceLatency (P95)Error RateTrafficSaturationAuth220ms1.2%5k RPS78% CPUPayments310ms3.1%3k RPS89% MemoryNotifications140ms0.4%12k RPS55% CPU
Step 4: Correlate Signals with Distributed Tracing
Use distributed tracing to map requests across services. Tools like Jaeger or Zipkin let you trace latency across hops, find the exact service causing error spikes, and visualize traffic flows and bottlenecks. A latency spike in the Payments service that traces back to a slow DB query is far more actionable than "P95 latency is high."
Learn how these principles apply in practice from our Centralized Monitoring case study for a B2C SaaS Music Platform.
Step 5. Automate Alerting with Context
Set thresholds and anomaly detection for each signal:
Latency > 500ms? Alert DevOps
Saturation > 90%? Trigger autoscaling
Error Rate > 2% over 5 mins? Notify engineering and create an incident ticket
Alerting Principles for SRE Teams
Effective application monitoring is only as useful as the alerting layer that translates signals into human action. Alert fatigue is one of the most common—and costly—failure modes in SRE programs. These principles help teams alert on what matters without overwhelming the on-call engineer.
Alert on Symptoms, Not Causes
Alert when the user experience is degraded (latency SLO is burning), not when a machine metric crosses a threshold. "CPU at 80%" is a cause; "P95 latency exceeding 500ms for 5 minutes" is a symptom your SLO cares about.
Use Error Budget Burn Rate as Your Primary Alert
A fast burn rate (e.g., 3x or 6x) on your error budget is a better paging condition than raw signal thresholds. It tells you not just that something is wrong, but how urgently you need to act based on your reliability commitments.
Sample Alert Thresholds (Illustrative Only)
SignalSample ThresholdSuggested ActionUrgencyLatency (P95)>500ms for 5 minPage on-call SREHighError Rate>2% over 5 minCreate incident ticket + notify engineeringHighSaturation (CPU)>90% for 10 minTrigger autoscaling policyMediumError Budget Burn3× rate for 1 hourIncident call, feature freeze considerationCritical
Methodology note: These thresholds are starting-point illustrations. Your production values should be calibrated against your own service baselines, user SLAs, and SLO definitions. A payment service tolerates far less latency than an async batch job.
Practical Application: Using APM Dashboards for SRE Monitoring
Application Performance Management (APM) dashboards integrate Golden Signals into a single view, allowing teams to monitor all critical metrics simultaneously. The operations team can use APM dashboards to get real-time insights into latency, errors, traffic, and saturation—reducing the cognitive load during incident response.
The most valuable APM features for SRE teams include:
One-hop dependency views — shows only the immediate upstream and downstream services of a failing component, dramatically narrowing the root-cause investigation scope and reducing MTTR.
Centralized Golden Signals panels — all four signals per service in one view, eliminating tool-switching during incidents.
SLO burn rate overlays — trend lines showing how quickly the error budget is being consumed, integrated alongside raw Golden Signals.
Proactive anomaly detection — ML-powered tools like Datadog and Dynatrace flag statistically unusual patterns before thresholds breach.
What is the Significance of Distinguishing 500 vs. 400 Errors in SRE Monitoring?
The distinction between 500 and 400 errors in application monitoring is fundamental to correct incident prioritization. Conflating them inflates your error rate SLI and may generate alerts that do not reflect actual service degradation.
Error TypeCauseSeveritySRE Response500 — Server errorSystem or application failureHighImmediate investigation, possible incident declaration400 — Client errorBad input, expired auth token, invalid requestLowerMonitor trends; investigate only on sustained spikes
A good SLI definition for errors counts only server-side failures (5xx) against your reliability budget. A sudden 400-error spike may signal a client SDK bug, a bot campaign, or a broken authentication flow—all worth investigating, but none of them are a service outage.
SRE Monitoring Dashboard Best Practices
A well-structured SRE dashboard makes or breaks incident response. It is not about displaying all available data—it is about surfacing the right insights at the right time. See the official Google SRE Book on monitoring for the principles that underpin these practices.
1. Prioritize Golden Signals and SLO Burn Rate at the Top
Place latency (P50/P95), error rate (%), traffic (RPS), and saturation front and center. Add SLO burn rate immediately below so engineers can assess reliability impact at a glance without scrolling.
2. Use Visual Cues Consistently
Color-code thresholds (green / yellow / red), use sparklines for trend visualization, and heatmaps to identify saturation patterns across clusters or availability zones.
3. Segment by Environment and Service
Separate production, staging, and dev views. Within production, segment by service or team ownership and by availability zone. This isolation dramatically reduces the time to pinpoint which service is responsible during an incident.
4. Link Metrics to Logs and Traces
Make your dashboards navigable: a latency spike should be one click away from the related trace in Jaeger, and a spike in errors should link directly to filtered log output in Kibana or Grafana Loki.
5. Provide Role-Appropriate Views
Use templating (Grafana variables, Datadog template variables) to serve multiple audiences from a single dashboard: SRE/on-call engineers need real-time signal detail; engineering teams need per-service deep dives; leadership needs SLO health summaries.
6. Treat Dashboards as Living Documents
Prune panels that nobody uses, reassess thresholds quarterly against updated baselines, and add deployment or incident annotations so that future engineers understand historical anomalies in context.
How Gart Implements SRE Monitoring in 30–60 Days
Generic best practices are helpful, but implementation details are where most teams struggle. Here is how Gart's SRE team approaches application monitoring engagements from day one, based on hands-on delivery experience across SaaS, cloud-native, and distributed environments—reviewed by Fedir Kompaniiets, Co-founder at Gart Solutions, who has designed monitoring and observability systems across multiple industries.
Days 1–14: Baseline and Instrumentation
Audit existing telemetry: what is already collected, what is missing, what is noisy.
Instrument all services with OpenTelemetry or native exporters for all four Golden Signals.
Deploy Prometheus + Grafana or connect to the client's existing observability platform.
Establish baseline latency, error rate, and saturation profiles per service under normal load.
Days 15–30: SLIs, SLOs, and Initial Alerting
Define SLIs for each critical service in collaboration with product and engineering stakeholders.
Draft SLOs and calculate initial error budgets based on business risk tolerance.
Configure symptom-based alerts (burn rate, not raw thresholds) with PagerDuty or Opsgenie routing.
Stand up the first three dashboards: overall service health, per-service Golden Signals, SLO burn rate.
Days 31–60: Noise Reduction and Handover
Tune alert thresholds against the observed baseline to eliminate alert fatigue.
Remove noisy, low-signal alerts that were generating false pages.
Integrate distributed tracing for the highest-traffic services.
Run a simulated incident to validate the monitoring stack end-to-end before handover.
Deliver runbooks and on-call documentation tied to each alert condition.
Real outcome: After implementing Golden Signals and SLO-based alerting for a B2C SaaS platform, the client reduced MTTR by 60% within two months. The primary driver was eliminating alert fatigue (previously 80+ daily alerts, reduced to 8 actionable ones) and linking every alert to a runbook with a clear first-responder action. Read the full context: Centralized Monitoring for a B2C SaaS Music Platform.
Watch How we Built "Advanced Monitoring for Sustainable Landfill Management"
Conclusion
Ready to take your system's reliability and performance to the next level? Gart Solutions offers top-tier SRE Monitoring services to ensure your systems are always running smoothly and efficiently. Our experts can help you identify and address potential issues before they impact your business, ensuring minimal downtime and optimal performance.
Gart Solutions · Expert SRE Services
Is Your Application Monitoring Ready for Production?
Engineering teams that invest in proper SRE monitoring and application monitoring reduce MTTR, protect error budgets, and ship with confidence. Gart's SRE team has designed and deployed monitoring stacks for SaaS platforms, Kubernetes-native environments, fintech, and healthcare systems.
60%
MTTR reduction for SaaS clients
30
Days to working SLO dashboards
99.9%
Availability target for managed clients
Our services cover the full monitoring lifecycle — from telemetry instrumentation and Golden Signal dashboards to SLO definition, alert tuning, and on-call runbooks.
Golden Signals Setup
SLI / SLO Definition
Prometheus + Grafana
Alert Tuning
Distributed Tracing
Kubernetes Monitoring
Incident Runbooks
Talk to an SRE Expert
Explore Monitoring Services
B2C SaaS Music Platform
Centralized monitoring across global infrastructure — 60% MTTR reduction in 2 months.
Digital Landfill Platform
Cloud-agnostic monitoring for IoT emissions data with multi-country compliance.
Fedir Kompaniiets
Co-founder & CEO, Gart Solutions · Cloud Architect & DevOps Consultant
Fedir is a technology enthusiast with over a decade of diverse industry experience. He co-founded Gart Solutions to address complex tech challenges related to Digital Transformation, helping businesses focus on what matters most — scaling. Fedir is committed to driving sustainable IT transformation, helping SMBs innovate, plan future growth, and navigate the "tech madness" through expert DevOps and Cloud managed services. Connect on LinkedIn.