In my experience optimizing cloud costs, especially on AWS, I often find that many quick wins are in the "easy to implement - good savings potential" quadrant.
[lwptoc]
That's why I've decided to share some straightforward methods for optimizing expenses on AWS that will help you save over 80% of your budget.
Choose reserved instances
Potential Savings: Up to 72%
Choosing reserved instances involves committing to a subscription, even partially, and offers a discount for long-term rentals of one to three years. While planning for a year is often deemed long-term for many companies, especially in Ukraine, reserving resources for 1-3 years carries risks but comes with the reward of a maximum discount of up to 72%.
You can check all the current pricing details on the official website - Amazon EC2 Reserved Instances
Purchase Saving Plans (Instead of On-Demand)
Potential Savings: Up to 72%
There are three types of saving plans: Compute Savings Plan, EC2 Instance Savings Plan, SageMaker Savings Plan.
AWS Compute Savings Plan is an Amazon Web Services option that allows users to receive discounts on computational resources in exchange for committing to using a specific volume of resources over a defined period (usually one or three years). This plan offers flexibility in utilizing various computing services, such as EC2, Fargate, and Lambda, at reduced prices.
AWS EC2 Instance Savings Plan is a program from Amazon Web Services that offers discounted rates exclusively for the use of EC2 instances. This plan is specifically tailored for the utilization of EC2 instances, providing discounts for a specific instance family, regardless of the region.
AWS SageMaker Savings Plan allows users to get discounts on SageMaker usage in exchange for committing to using a specific volume of computational resources over a defined period (usually one or three years).
The discount is available for one and three years with the option of full, partial upfront payment, or no upfront payment. EC2 can help save up to 72%, but it applies exclusively to EC2 instances.
Utilize Various Storage Classes for S3 (Including Intelligent Tier)
Potential Savings: 40% to 95%
AWS offers numerous options for storing data at different access levels. For instance, S3 Intelligent-Tiering automatically stores objects at three access levels: one tier optimized for frequent access, 40% cheaper tier optimized for infrequent access, and 68% cheaper tier optimized for rarely accessed data (e.g., archives).
S3 Intelligent-Tiering has the same price per 1 GB as S3 Standard — $0.023 USD.
However, the key advantage of Intelligent Tiering is its ability to automatically move objects that haven't been accessed for a specific period to lower access tiers.
Every 30, 90, and 180 days, Intelligent Tiering automatically shifts an object to the next access tier, potentially saving companies from 40% to 95%. This means that for certain objects (e.g., archives), it may be appropriate to pay only $0.0125 USD per 1 GB or $0.004 per 1 GB compared to the standard price of $0.023 USD.
Information regarding the pricing of Amazon S3
AWS Compute Optimizer
Potential Savings: quite significant
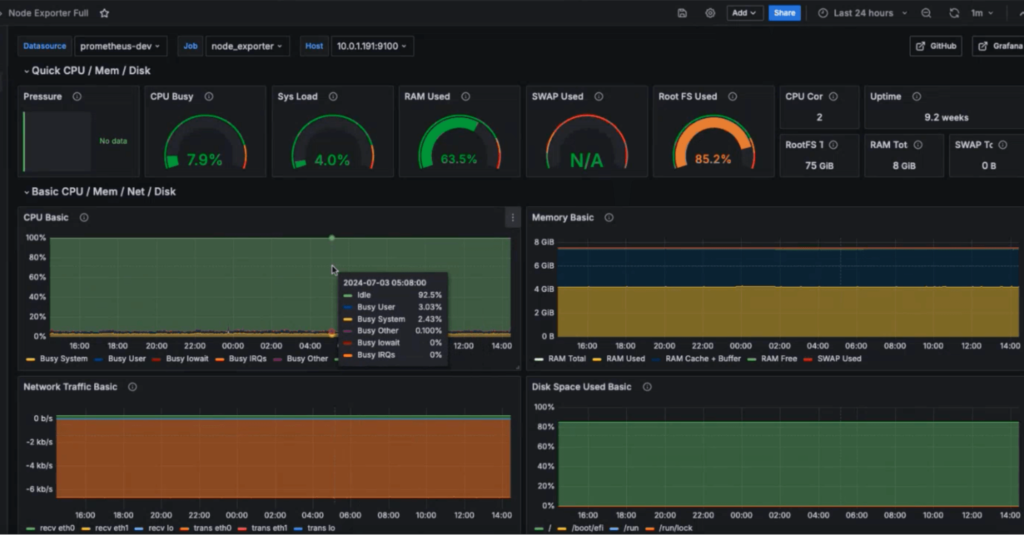
The AWS Compute Optimizer dashboard is a tool that lets users assess and prioritize optimization opportunities for their AWS resources.
The dashboard provides detailed information about potential cost savings and performance improvements, as the recommendations are based on an analysis of resource specifications and usage metrics.
The dashboard covers various types of resources, such as EC2 instances, Auto Scaling groups, Lambda functions, Amazon ECS services on Fargate, and Amazon EBS volumes.
For example, AWS Compute Optimizer reproduces information about underutilized or overutilized resources allocated for ECS Fargate services or Lambda functions. Regularly keeping an eye on this dashboard can help you make informed decisions to optimize costs and enhance performance.
Use Fargate in EKS for underutilized EC2 nodes
If your EKS nodes aren't fully used most of the time, it makes sense to consider using Fargate profiles. With AWS Fargate, you pay for a specific amount of memory/CPU resources needed for your POD, rather than paying for an entire EC2 virtual machine.
For example, let's say you have an application deployed in a Kubernetes cluster managed by Amazon EKS (Elastic Kubernetes Service). The application experiences variable traffic, with peak loads during specific hours of the day or week (like a marketplace or an online store), and you want to optimize infrastructure costs. To address this, you need to create a Fargate Profile that defines which PODs should run on Fargate. Configure Kubernetes Horizontal Pod Autoscaler (HPA) to automatically scale the number of POD replicas based on their resource usage (such as CPU or memory usage).
Manage Workload Across Different Regions
Potential Savings: significant in most cases
When handling workload across multiple regions, it's crucial to consider various aspects such as cost allocation tags, budgets, notifications, and data remediation.
Cost Allocation Tags: Classify and track expenses based on different labels like program, environment, team, or project.
AWS Budgets: Define spending thresholds and receive notifications when expenses exceed set limits. Create budgets specifically for your workload or allocate budgets to specific services or cost allocation tags.
Notifications: Set up alerts when expenses approach or surpass predefined thresholds. Timely notifications help take actions to optimize costs and prevent overspending.
Remediation: Implement mechanisms to rectify expenses based on your workload requirements. This may involve automated actions or manual interventions to address cost-related issues.
Regional Variances: Consider regional differences in pricing and data transfer costs when designing workload architectures.
Reserved Instances and Savings Plans: Utilize reserved instances or savings plans to achieve cost savings.
AWS Cost Explorer: Use this tool for visualizing and analyzing your expenses. Cost Explorer provides insights into your usage and spending trends, enabling you to identify areas of high costs and potential opportunities for cost savings.
Transition to Graviton (ARM)
Potential Savings: Up to 30%
Graviton utilizes Amazon's server-grade ARM processors developed in-house. The new processors and instances prove beneficial for various applications, including high-performance computing, batch processing, electronic design automation (EDA) automation, multimedia encoding, scientific modeling, distributed analytics, and machine learning inference on processor-based systems.
The processor family is based on ARM architecture, likely functioning as a system on a chip (SoC). This translates to lower power consumption costs while still offering satisfactory performance for the majority of clients. Key advantages of AWS Graviton include cost reduction, low latency, improved scalability, enhanced availability, and security.
Spot Instances Instead of On-Demand
Potential Savings: Up to 30%
Utilizing spot instances is essentially a resource exchange. When Amazon has surplus resources lying idle, you can set the maximum price you're willing to pay for them. The catch is that if there are no available resources, your requested capacity won't be granted.
However, there's a risk that if demand suddenly surges and the spot price exceeds your set maximum price, your spot instance will be terminated.
Spot instances operate like an auction, so the price is not fixed. We specify the maximum we're willing to pay, and AWS determines who gets the computational power. If we are willing to pay $0.1 per hour and the market price is $0.05, we will pay exactly $0.05.
Use Interface Endpoints or Gateway Endpoints to save on traffic costs (S3, SQS, DynamoDB, etc.)
Potential Savings: Depends on the workload
Interface Endpoints operate based on AWS PrivateLink, allowing access to AWS services through a private network connection without going through the internet. By using Interface Endpoints, you can save on data transfer costs associated with traffic.
Utilizing Interface Endpoints or Gateway Endpoints can indeed help save on traffic costs when accessing services like Amazon S3, Amazon SQS, and Amazon DynamoDB from your Amazon Virtual Private Cloud (VPC).
Key points:
Amazon S3: With an Interface Endpoint for S3, you can privately access S3 buckets without incurring data transfer costs between your VPC and S3.
Amazon SQS: Interface Endpoints for SQS enable secure interaction with SQS queues within your VPC, avoiding data transfer costs for communication with SQS.
Amazon DynamoDB: Using an Interface Endpoint for DynamoDB, you can access DynamoDB tables in your VPC without incurring data transfer costs.
Additionally, Interface Endpoints allow private access to AWS services using private IP addresses within your VPC, eliminating the need for internet gateway traffic. This helps eliminate data transfer costs for accessing services like S3, SQS, and DynamoDB from your VPC.
Optimize Image Sizes for Faster Loading
Potential Savings: Depends on the workload
Optimizing image sizes can help you save in various ways.
Reduce ECR Costs: By storing smaller instances, you can cut down expenses on Amazon Elastic Container Registry (ECR).
Minimize EBS Volumes on EKS Nodes: Keeping smaller volumes on Amazon Elastic Kubernetes Service (EKS) nodes helps in cost reduction.
Accelerate Container Launch Times: Faster container launch times ultimately lead to quicker task execution.
Optimization Methods:
Use the Right Image: Employ the most efficient image for your task; for instance, Alpine may be sufficient in certain scenarios.
Remove Unnecessary Data: Trim excess data and packages from the image.
Multi-Stage Image Builds: Utilize multi-stage image builds by employing multiple FROM instructions.
Use .dockerignore: Prevent the addition of unnecessary files by employing a .dockerignore file.
Reduce Instruction Count: Minimize the number of instructions, as each instruction adds extra weight to the hash. Group instructions using the && operator.
Layer Consolidation: Move frequently changing layers to the end of the Dockerfile.
These optimization methods can contribute to faster image loading, reduced storage costs, and improved overall performance in containerized environments.
Use Load Balancers to Save on IP Address Costs
Potential Savings: depends on the workload
Starting from February 2024, Amazon begins billing for each public IPv4 address. Employing a load balancer can help save on IP address costs by using a shared IP address, multiplexing traffic between ports, load balancing algorithms, and handling SSL/TLS.
By consolidating multiple services and instances under a single IP address, you can achieve cost savings while effectively managing incoming traffic.
Optimize Database Services for Higher Performance (MySQL, PostgreSQL, etc.)
Potential Savings: depends on the workload
AWS provides default settings for databases that are suitable for average workloads. If a significant portion of your monthly bill is related to AWS RDS, it's worth paying attention to parameter settings related to databases.
Some of the most effective settings may include:
Use Database-Optimized Instances: For example, instances in the R5 or X1 class are optimized for working with databases.
Choose Storage Type: General Purpose SSD (gp2) is typically cheaper than Provisioned IOPS SSD (io1/io2).
AWS RDS Auto Scaling: Automatically increase or decrease storage size based on demand.
If you can optimize the database workload, it may allow you to use smaller instance sizes without compromising performance.
Regularly Update Instances for Better Performance and Lower Costs
Potential Savings: Minor
As Amazon deploys new servers in their data processing centers to provide resources for running more instances for customers, these new servers come with the latest equipment, typically better than previous generations. Usually, the latest two to three generations are available. Make sure you update regularly to effectively utilize these resources.
Take Memory Optimize instances, for example, and compare the price change based on the relevance of one instance over another. Regular updates can ensure that you are using resources efficiently.
InstanceGenerationDescriptionOn-Demand Price (USD/hour)m6g.large6thInstances based on ARM processors offer improved performance and energy efficiency.$0.077m5.large5thGeneral-purpose instances with a balanced combination of CPU and memory, designed to support high-speed network access.$0.096m4.large4thA good balance between CPU, memory, and network resources.$0.1m3.large3rdOne of the previous generations, less efficient than m5 and m4.Not avilable
Use RDS Proxy to reduce the load on RDS
Potential for savings: Low
RDS Proxy is used to relieve the load on servers and RDS databases by reusing existing connections instead of creating new ones. Additionally, RDS Proxy improves failover during the switch of a standby read replica node to the master.
Imagine you have a web application that uses Amazon RDS to manage the database. This application experiences variable traffic intensity, and during peak periods, such as advertising campaigns or special events, it undergoes high database load due to a large number of simultaneous requests.
During peak loads, the RDS database may encounter performance and availability issues due to the high number of concurrent connections and queries. This can lead to delays in responses or even service unavailability.
RDS Proxy manages connection pools to the database, significantly reducing the number of direct connections to the database itself.
By efficiently managing connections, RDS Proxy provides higher availability and stability, especially during peak periods.
Using RDS Proxy reduces the load on RDS, and consequently, the costs are reduced too.
Define the storage policy in CloudWatch
Potential for savings: depends on the workload, could be significant.
The storage policy in Amazon CloudWatch determines how long data should be retained in CloudWatch Logs before it is automatically deleted.
Setting the right storage policy is crucial for efficient data management and cost optimization. While the "Never" option is available, it is generally not recommended for most use cases due to potential costs and data management issues.
Typically, best practice involves defining a specific retention period based on your organization's requirements, compliance policies, and needs.
Avoid using an undefined data retention period unless there is a specific reason. By doing this, you are already saving on costs.
Configure AWS Config to monitor only the events you need
Potential for savings: depends on the workload
AWS Config allows you to track and record changes to AWS resources, helping you maintain compliance, security, and governance. AWS Config provides compliance reports based on rules you define. You can access these reports on the AWS Config dashboard to see the status of tracked resources.
You can set up Amazon SNS notifications to receive alerts when AWS Config detects non-compliance with your defined rules. This can help you take immediate action to address the issue. By configuring AWS Config with specific rules and resources you need to monitor, you can efficiently manage your AWS environment, maintain compliance requirements, and avoid paying for rules you don't need.
Use lifecycle policies for S3 and ECR
Potential for savings: depends on the workload
S3 allows you to configure automatic deletion of individual objects or groups of objects based on specified conditions and schedules. You can set up lifecycle policies for objects in each specific bucket. By creating data migration policies using S3 Lifecycle, you can define the lifecycle of your object and reduce storage costs.
These object migration policies can be identified by storage periods. You can specify a policy for the entire S3 bucket or for specific prefixes. The cost of data migration during the lifecycle is determined by the cost of transfers. By configuring a lifecycle policy for ECR, you can avoid unnecessary expenses on storing Docker images that you no longer need.
Switch to using GP3 storage type for EBS
Potential for savings: 20%
By default, AWS creates gp2 EBS volumes, but it's almost always preferable to choose gp3 — the latest generation of EBS volumes, which provides more IOPS by default and is cheaper.
For example, in the US-east-1 region, the price for a gp2 volume is $0.10 per gigabyte-month of provisioned storage, while for gp3, it's $0.08/GB per month. If you have 5 TB of EBS volume on your account, you can save $100 per month by simply switching from gp2 to gp3.
Switch the format of public IP addresses from IPv4 to IPv6
Potential for savings: depending on the workload
Starting from February 1, 2024, AWS will begin charging for each public IPv4 address at a rate of $0.005 per IP address per hour. For example, taking 100 public IP addresses on EC2 x $0.005 per public IP address per month x 730 hours = $365.00 per month.
While this figure might not seem huge (without tying it to the company's capabilities), it can add up to significant network costs. Thus, the optimal time to transition to IPv6 was a couple of years ago or now.
Here are some resources about this recent update that will guide you on how to use IPv6 with widely-used services — AWS Public IPv4 Address Charge.
Collaborate with AWS professionals and partners for expertise and discounts
Potential for savings: ~5% of the contract amount through discounts.
AWS Partner Network (APN) Discounts: Companies that are members of the AWS Partner Network (APN) can access special discounts, which they can pass on to their clients. Partners reaching a certain level in the APN program often have access to better pricing offers.
Custom Pricing Agreements: Some AWS partners may have the opportunity to negotiate special pricing agreements with AWS, enabling them to offer unique discounts to their clients. This can be particularly relevant for companies involved in consulting or system integration.
Reseller Discounts: As resellers of AWS services, partners can purchase services at wholesale prices and sell them to clients with a markup, still offering a discount from standard AWS prices. They may also provide bundled offerings that include AWS services and their own additional services.
Credit Programs: AWS frequently offers credit programs or vouchers that partners can pass on to their clients. These could be promo codes or discounts for a specific period.
Seek assistance from AWS professionals and partners. Often, this is more cost-effective than purchasing and configuring everything independently. Given the intricacies of cloud space optimization, expertise in this matter can save you tens or hundreds of thousands of dollars.
More valuable tips for optimizing costs and improving efficiency in AWS environments:
Scheduled TurnOff/TurnOn for NonProd environments: If the Development team is in the same timezone, significant savings can be achieved by, for example, scaling the AutoScaling group of instances/clusters/RDS to zero during the night and weekends when services are not actively used.
Move static content to an S3 Bucket & CloudFront: To prevent service charges for static content, consider utilizing Amazon S3 for storing static files and CloudFront for content delivery.
Use API Gateway/Lambda/Lambda Edge where possible: In such setups, you only pay for the actual usage of the service. This is especially noticeable in NonProd environments where resources are often underutilized.
If your CI/CD agents are on EC2, migrate to CodeBuild: AWS CodeBuild can be a more cost-effective and scalable solution for your continuous integration and delivery needs.
CloudWatch covers the needs of 99% of projects for Monitoring and Logging: Avoid using third-party solutions if AWS CloudWatch meets your requirements. It provides comprehensive monitoring and logging capabilities for most projects.
Feel free to reach out to me or other specialists for an audit, a comprehensive optimization package, or just advice.
Compliance Monitoring is the ongoing process of verifying that an organization's systems, processes, and people continuously adhere to regulatory requirements, internal policies, and industry standards — not just at audit time, but every day. For cloud-native and regulated businesses in 2026, it is the difference between a clean audit and a costly breach.
What is Compliance Monitoring?
Compliance monitoring is the systematic, continuous practice of evaluating whether an organization's operations, systems, and people conform to the laws, regulations, and internal standards that govern them. Unlike a one-time audit, compliance monitoring runs as an always-on feedback loop — collecting evidence, flagging exceptions, and enabling rapid remediation before regulators ever knock on the door.
The practice is critical across heavily regulated industries:
Healthcare — HIPAA, HITECH, 21 CFR Part 11
Finance & Banking — PCI DSS, SOX, Basel III, MiFID II
Cloud & SaaS — SOC 2, ISO 27001, CSA CCM
EU-regulated entities — GDPR, NIS2, DORA
Energy & Utilities — NERC CIP, ISO 50001
Pharmaceuticals — GxP, FDA 21 CFR
💡 In short: Compliance monitoring is your organization's immune system. Audits are the annual check-up. Monitoring is what keeps you healthy between check-ups.
Why Compliance Monitoring Matters in 2026
Regulatory landscapes have never moved faster. GDPR fines reached record highs in 2024–2025, NIS2 entered enforcement mode across the EU, and DORA (Digital Operational Resilience Act) took effect for financial entities. Meanwhile, cloud adoption has created entirely new attack surfaces that traditional point-in-time audits simply cannot cover.
Risk Without MonitoringTypical Business ImpactProbability (unmonitored)Undetected misconfigured S3 bucket / cloud storageData breach, regulatory fine, brand damageHighStale privileged access not reviewedInsider threat, audit failure, SOX violationVery HighMissing audit log retentionInability to prove compliance, automatic audit failureHighBackup not testedUnrecoverable data loss, SLA breach, recovery failureMediumUnpatched critical CVE beyond SLAExploitable vulnerability, CVSS breach, PCI non-complianceHighWhy Compliance Monitoring Matters in 2026
Strong compliance monitoring builds trust with enterprise clients and partners, significantly reduces audit preparation time, and enables a proactive risk posture instead of a reactive, fire-fighting one.
Compliance Monitoring vs Compliance Audit vs Compliance Management
These three terms are often used interchangeably but they describe distinct activities that work together. Understanding the difference helps organizations allocate resources correctly.
DimensionCompliance MonitoringCompliance AuditCompliance ManagementFrequencyContinuous / near-real-timePeriodic (annual, quarterly)Ongoing governancePurposeDetect & alert on deviationsFormal independent assessmentPolicies, training, cultureOutputAlerts, dashboards, exception logsAudit report, findings, attestationPolicies, procedures, risk registerWho leadsEngineering / Security / DevOpsInternal audit / Third-party auditorCompliance Officer / GRC teamAnalogyBlood pressure cuff worn dailyAnnual physical with doctorHealthy lifestyle programCompliance Monitoring vs Compliance Audit vs Compliance Management
✅ Monitoring answers
Is MFA enforced right now?
Are all logs being retained?
Did anything change in IAM this week?
Are backups completing successfully?
Is encryption enabled on all storage?
📋 Auditing answers
Were controls effective over the period?
Did evidence satisfy the framework?
What is the organization's control maturity?
What formal findings require remediation?
Is the organization SOC 2 / ISO 27001 ready?
Explore our Compliance Audit services
The 7-Step Compliance Monitoring Process
Effective compliance monitoring is not a single tool or dashboard — it's a disciplined cycle. Here is the process Gart uses when setting up or maturing a client's compliance monitoring program:
1. Define Scope & Applicable Frameworks
Identify which regulations, standards, and internal policies apply. Map your systems, data flows, and third-party integrations to determine the monitoring perimeter. Ambiguous scope is the most common reason monitoring programs fail.
2. Inventory Systems & Controls
Catalogue all assets (cloud, on-prem, SaaS, CI/CD pipelines) and map each one to a control objective. Assign control owners. Without ownership, no one acts when an exception fires.
3. Define Evidence Collection Rules
For each control, specify what constitutes "evidence of compliance" — a log entry, a configuration state, a test result, a screenshot, or a signed document. Define collection frequency (real-time, daily, monthly) and acceptable format for auditors.
4. Instrument & Automate Collection
Deploy monitoring agents, SIEM rules, cloud policy engines (AWS Config, Azure Policy, GCP Security Command Center), and IaC scanning tools. Automate evidence collection wherever possible — manual evidence gathering at audit time is a costly, error-prone anti-pattern.
5. Monitor Exceptions & Triage Alerts
Create alert thresholds for control deviations. Not every alert is a breach — build a triage process that separates noise from genuine risk. Route high-priority exceptions to security/engineering immediately; lower-priority items to a weekly review queue.
6. Prioritize Risks & Remediate
Score exceptions by likelihood and impact. Maintain a risk register that tracks open findings, owners, and target remediation dates. Escalate unresolved critical findings to leadership with a clear business-impact framing.
7. Re-test, Report & Continuously Improve
After remediation, re-test the control to confirm it is effective. Produce compliance health reports for leadership and auditors. Run a quarterly retrospective to tune alert thresholds and update monitoring scope as regulations and infrastructure evolve.
Key Controls & Evidence to Monitor
Across hundreds of compliance engagements, the controls below consistently appear on auditor checklists. These are the areas where automated compliance monitoring delivers the highest return:
Control AreaWhat to MonitorEvidence Auditors WantRelevant FrameworksIdentity & Access (IAM)Privileged role assignments, inactive accounts, MFA status, service account permissionsAccess review logs, MFA adoption rate, least-privilege config exportsSOC 2, ISO 27001, HIPAAAudit LoggingLog completeness, retention period, tamper-evidence, SIEM ingestion healthLog retention policy, SIEM dashboard, CloudTrail / Audit Log exportsPCI DSS, SOX, NIS2, GDPREncryptionData-at-rest encryption on storage, TLS version on endpoints, key rotation schedulesEncryption config exports, key management audit logs, TLS scan reportsPCI DSS, HIPAA, GDPR, ISO 27001Patch ManagementCVE scan results, SLA adherence per severity, open critical/high vulnerabilitiesScan reports, patch cadence logs, SLA compliance metricsSOC 2, PCI DSS, ISO 27001Backup & RecoveryBackup job success rate, RPO/RTO test results, offsite replication statusBackup logs, recovery test records, DR test reportsSOC 2, ISO 22301, DORA, NIS2Vendor / Third-Party AccessActive vendor sessions, access scope, contract/NDA currency, SOC 2 report datesVendor access logs, contract register, third-party risk assessmentsISO 27001, SOC 2, GDPR, NIS2Network & PerimeterFirewall rule changes, open ports, egress filtering, WAF alert volumesFirewall config snapshots, IDS/IPS logs, pen test reportsPCI DSS, SOC 2, NIS2Incident ResponseMean time to detect (MTTD), mean time to respond (MTTR), breach notification timelinesIncident logs, CSIRT reports, post-mortemsGDPR (72h), NIS2, HIPAA, DORAKey Controls & Evidence to Monitor
Continuous Compliance Monitoring for Cloud Environments
Cloud infrastructure changes constantly — teams spin up resources, update IAM policies, and deploy code multiple times per day. This makes continuous compliance monitoring not a nice-to-have but a fundamental requirement. Manual checks against cloud state are obsolete before the ink dries.
AWS Compliance Monitoring — Key Automated Checks
AWS Config Rules — detect non-compliant resources in real time (e.g., unencrypted EBS volumes, public S3 buckets, missing CloudTrail)
AWS Security Hub — aggregates findings from GuardDuty, Inspector, Macie into a single compliance posture score
CloudTrail + Athena — query audit logs for unauthorized IAM changes, API calls outside approved regions
IAM Access Analyzer — surfaces external access to resources and unused roles/permissions
Azure Compliance Monitoring — Key Automated Checks
Azure Policy & Defender for Cloud — enforce and score compliance against CIS, NIST SP 800-53, ISO 27001 benchmarks
Microsoft Purview — data classification, governance, and audit trail across Azure and M365
Azure Monitor + Sentinel — SIEM-class alerting on suspicious activity with compliance-relevant playbooks
Privileged Identity Management (PIM) — just-in-time access with mandatory justification and approval workflows
GCP Compliance Monitoring — Key Automated Checks
Security Command Center — organization-wide misconfiguration detection and compliance benchmarking
VPC Service Controls — perimeter security policies that prevent data exfiltration
Cloud Audit Logs — immutable, per-service activity and data access logs
Policy Intelligence — recommends IAM role right-sizing based on actual usage data
🔗
For authoritative cloud security benchmarks, the CIS Benchmarks provide configuration baselines for AWS, Azure, GCP, Kubernetes, and 100+ other platforms — an industry-standard starting point for any cloud compliance monitoring program.
See Gart's Cloud Computing & Security services
Industry-Specific Compliance Monitoring Frameworks
Compliance monitoring requirements differ significantly by industry and geography. Below are the frameworks Gart's clients most commonly monitor against, along with the controls that require continuous (not just periodic) monitoring.
FrameworkIndustry / RegionKey Continuous Monitoring RequirementsResourcesISO 27001Global / All industriesAccess control review, log management, vulnerability scanning, supplier reviewISO.orgSOC 2 Type IISaaS / TechnologyContinuous availability, logical access, change management, incident responseAICPAHIPAAHealthcare (US)ePHI access logs, encryption at rest/transit, workforce activity auditsHHS.govPCI DSS v4.0Payment / E-commerceReal-time network monitoring, file integrity monitoring, quarterly vulnerability scansPCI SSCNIS2EU / Critical sectorsIncident detection within 24h, risk assessments, supply chain security checksENISAGDPREU / Global processing EU dataData subject request tracking, breach detection (<72h notification), processor auditsGDPR.euIndustry-Specific Compliance Monitoring Frameworks
How to prepare for a HIPAA Audit - Gart's PCI DSS Audit guide
First-Hand Experience
What We Usually Find During Compliance Monitoring Reviews
After reviewing postures across dozens of regulated environments, these are the patterns we encounter repeatedly — regardless of organization size.
👥
Incomplete or stale access reviews
Former employees and service accounts with active permissions weeks after departure. IAM hygiene is rarely automated, and reviews are often rubber-stamped.
📋
Missing backup test evidence
Backups appear healthy, but nobody has tested a restore in 6–18 months. Auditors want dated restore test logs with RPO/RTO outcomes, not just success metrics.
📊
Fragmented or incomplete audit logs
Gaps in the log chain (like disabled S3 data-event logging) make it impossible to reconstruct an incident or prove that one didn't happen.
🔔
Alert fatigue masking real issues
Thousands of low-fidelity alerts lead teams to mute notifications or build exceptions, inadvertently disabling detection for real threats.
📄
Policy-to-implementation gaps
Written policies say "encryption required," but reality reveals unencrypted legacy buckets. Continuous monitoring is the only way to detect this drift.
🔧
Automation is first patched, last monitored
CI/CD pipelines move faster than human reviewers. IaC repositories often lack policy-as-code scanning, leaving non-compliant resources active for months.
Featured Success Story
Case study: ISO 27001 compliance for Spiral Technology
→
Compliance Monitoring Tools & Automation
The right tooling depends on your stack, frameworks, and team maturity. Most organizations use a layered approach rather than a single platform:
CategoryRepresentative ToolsBest ForCloud Security Posture Management (CSPM)AWS Security Hub, Wiz, Prisma Cloud, Orca Security, Defender for CloudCloud misconfiguration detection, continuous benchmarkingSIEM / Log ManagementSplunk, Elastic SIEM, Microsoft Sentinel, Datadog SecurityLog correlation, anomaly detection, audit evidenceGRC PlatformsVanta, Drata, Secureframe, ServiceNow GRC, OneTrustEvidence collection automation, audit-ready reportingPolicy-as-Code / IaC ScanningOpen Policy Agent (OPA), Checkov, Terrascan, tfsec, ConftestPrevent non-compliant infrastructure from being deployedVulnerability ManagementTenable Nessus, Qualys, AWS Inspector, Trivy (containers)CVE detection, patch SLA monitoring, container scanningIdentity GovernanceSailPoint, CyberArk, Azure PIM, AWS IAM Access AnalyzerAccess reviews, least-privilege enforcement, PAM
⚠️ Tool sprawl is a compliance risk: More tools mean more integrations to maintain, more alert queues to manage, and more places where evidence can fall through the cracks. Start with native cloud tools and expand deliberately. The Linux Foundation and CNCF maintain open-source compliance tooling for cloud-native environments worth evaluating before adding commercial licenses.
Compliance Monitoring Best Practices
1. Shift compliance left into the development pipeline
The cheapest time to catch a compliance violation is before the resource is deployed. Integrate policy-as-code scanning (OPA, Checkov) into your CI/CD pipeline so that non-compliant Terraform or Helm charts never reach production. Treat compliance failures as build-breaking errors, not post-deploy recommendations.
2. Automate evidence collection — not just detection
Detection without evidence collection is useless at audit time. Configure your monitoring tools to export and archive compliance evidence (configuration snapshots, access review logs, scan reports) automatically to an immutable store. Auditors need evidence from a defined period — not a screenshot taken the morning of the audit.
3. Assign control owners, not just tool owners
Every control needs a named human owner who is accountable for exceptions. When an alert fires that MFA is disabled on a privileged account, "the security team" is not a sufficient owner — a specific person must be on call to investigate and remediate within the SLA.
4. Tune alerts ruthlessly to eliminate fatigue
Compliance monitoring programs that generate thousands of daily alerts quickly become ignored. Start with a small set of high-fidelity, high-impact alerts. Expand incrementally after each is tuned to near-zero false positive rates. A team that responds to 20 real alerts per day is more secure than one drowning in 2,000 noisy ones.
5. Monitor your monitoring
Monitoring pipelines break silently. Log shippers stop, API rate limits are hit, SIEM ingestion queues fill up. Build meta-monitoring to detect when evidence collection or alerting pipelines have gaps — and treat those gaps as compliance findings in their own right.
6. Conduct a quarterly compliance posture review
Beyond continuous automated monitoring, schedule a quarterly human review of the compliance posture. Review open exceptions, re-assess risk scores, retire obsolete controls, and update monitoring scope to cover new systems and regulatory changes.
Compliance Monitoring Checklist for Cloud Teams
A starting point for cloud-first compliance. Each item requires a named owner, a monitoring cadence, and a defined evidence artifact.
✓
MFA enforced on all privileged and administrative accounts
✓
Access reviews completed for all privileged roles (minimum quarterly)
✓
Service accounts audited for least-privilege and no unused permissions
✓
Audit logging enabled and retained (90 days min; 1 year for PCI/HIPAA)
✓
SIEM ingestion health monitored — no silent log gaps
✓
Data-at-rest encryption confirmed on all storage (S3, RDS, EBS, blobs)
✓
TLS 1.2+ enforced; TLS 1.0/1.1 disabled on all endpoints
✓
Encryption key rotation scheduled and verified
✓
Vulnerability scans run weekly; critical/high CVEs remediated within SLA
✓
Patch management SLA compliance tracked and reported
✓
Backups verified complete daily; restore tests documented quarterly
✓
DR test completed at least annually; RPO/RTO outcomes logged
✓
No public cloud storage buckets without explicit business justification
✓
Firewall change log reviewed; unauthorized rule changes alerting
✓
Vendor/third-party access scoped, time-limited, and reviewed quarterly
✓
Incident response plan tested; MTTD and MTTR tracked
✓
Policy-as-code scans integrated into CI/CD pipelines
✓
Compliance evidence archived in immutable storage for audit period
✓
Monitoring pipeline health checked — no silent collection failures
✓
Quarterly posture review conducted with named control owners
Gart Solutions · Compliance Monitoring Services
How Gart Helps You Build a Continuous Compliance Monitoring Program
We work with CTOs, CISOs, and engineering leaders to design, implement, and run compliance monitoring programs that hold up under real auditor scrutiny — not just on paper.
🗺️
Scope & Framework Mapping
We identify applicable frameworks (ISO 27001, SOC 2, HIPAA, PCI DSS, NIS2, GDPR) and map your cloud infrastructure to each control objective.
🔧
Monitoring Setup & Automation
We deploy CSPM tools, SIEM rules, and policy-as-code pipelines — so evidence is collected automatically, not manually on audit day.
📊
Gap Analysis & Risk Register
We deliver a clear view of your current compliance posture, prioritized by risk, with a remediation roadmap and accountable owners.
🔄
Ongoing Reviews & Readiness
Monthly exception reviews and pre-audit evidence packages — so you're never scrambling the week before an official audit.
☁️
Cloud-Native Expertise
AWS, Azure, GCP, Kubernetes, and CI/CD. We speak infrastructure as code and translate compliance into DevOps workflows.
📋
Audit-Ready Deliverables
Exception logs, risk matrices, and control evidence archives. Everything formatted for the specific framework you're being audited against.
Get a Compliance Audit
Talk to an Expert
Fedir Kompaniiets
Co-founder & CEO, Gart Solutions · Cloud Architect & DevOps Consultant
Fedir is a technology enthusiast with over a decade of diverse industry experience. He co-founded Gart Solutions to address complex tech challenges related to Digital Transformation, helping businesses focus on what matters most — scaling. Fedir is committed to driving sustainable IT transformation, helping SMBs innovate, plan future growth, and navigate the "tech madness" through expert DevOps and Cloud managed services. Connect on LinkedIn.
What defines real compliance in 2026 is sovereignty — who legally controls your infrastructure, who holds the cryptographic keys, who operates your systems, and which jurisdiction ultimately governs access to your data.
European organizations can host data in Frankfurt, Paris or Stockholm — and still remain exposed to non-EU authorities. That is why digital sovereignty has become the new compliance baseline across healthcare, finance, SaaS, public sector, manufacturing, and AI-driven businesses.
What Is Digital Sovereignty and Why Does It Matter for Europe?
The vast majority of cloud infrastructure today is controlled by U.S.-based hyperscalers like Amazon Web Services (AWS), Microsoft Azure, and Google Cloud.
These companies operate under U.S. law — most notably the CLOUD Act, which gives U.S. authorities the right to access data, even if it’s stored in European data centers.
This legal loophole creates an enormous risk. European governments, hospitals, banks, and startups often host sensitive workloads on foreign infrastructure without realizing they’re potentially exposing themselves to surveillance, data requests, and jurisdictional conflicts. Digital sovereignty is about correcting that imbalance — ensuring that European data stays in Europe, governed by European laws.
Sovereignty vs Residency vs Jurisdiction — The Control Framework
LayerWhat it controlsWhy it mattersData ResidencyWhere data is physically storedDetermines GDPR applicabilityData SovereigntyWhich legal system governs operationsDetermines NIS2, DORA & AI Act complianceJurisdictional ControlWho can legally compel accessDetermines CLOUD Act exposureSovereignty vs Residency vs Jurisdiction — The Control Framework
Sovereignty is not about geography.It is about legal authority, operational control, and cryptographic ownership.
But it’s more than just regulation. Digital sovereignty also touches on values — privacy, transparency, innovation, and economic sustainability. It’s a vision of a Europe that’s not just connected, but digitally independent.
The Data Explosion and Why Europe Is Reacting Now
Europe is generating data at unprecedented speed. Global data volumes grew from 33 zettabytes in 2018 to an estimated 175 zettabytes by 2025 — doubling roughly every 18 months. Yet despite this growth, the majority of European data is stored on infrastructure outside the EU, often governed by foreign laws.
The challenge is not just the volume of data, but the sensitivity of what is being collected:health records, financial data, industrial telemetry, geolocation streams, and now AI training datasets.Even metadata — logs, diagnostics, access patterns — can reveal valuable operational insights.
Rising cyberattacks, geopolitical tension, and the accelerating adoption of AI have pushed European regulators to tighten control over where data resides, how it moves, and who can legally access it.
Digital sovereignty is Europe’s answer to protecting its data economy while enabling innovation.
The Legal and Ethical Imperatives Behind Sovereign Cloud Choices
When a European organization uses a U.S.-based cloud provider, it may be fully GDPR-compliant on paper, but in reality, there's a major legal contradiction. That’s because foreign laws can override EU protections through extraterritorial reach. The U.S. CLOUD Act is a prime example. It allows American law enforcement to demand access to data, no matter where it's stored, as long as it's held by a U.S.-controlled entity.
This creates a fundamental conflict with the General Data Protection Regulation (GDPR) — which mandates strict data processing, protection, and transparency rules for all EU citizens. If a cloud provider is subject to both laws, whose orders do they follow?
This ethical and legal tension has spurred the development of sovereign cloud solutions. EU-based cloud providers offer an escape from this conundrum. They're headquartered and operated under European jurisdiction, meaning they can comply fully with EU data protection laws without foreign interference.
Levels of Sovereignty: Residency, Sovereignty, and Jurisdictional Control
Not all “sovereign clouds” offer the same guarantees. European organizations need to distinguish three layers of control:
1. Data ResidencyWhere the data physically lives. Hosting data in the EU ensures GDPR applies, but it does not eliminate risks if the provider is subject to foreign laws.
2. Data SovereigntyWhich legal system governs the data. True sovereignty ensures all processing, backup, and metadata are controlled by EU regulations only.
3. Jurisdictional ControlWho can compel access to the data.Even if stored in Frankfurt or Paris, data managed by a foreign-owned company may still fall under the CLOUD Act or other extraterritorial laws.
This framework helps organizations evaluate whether a cloud provider truly protects their data — or simply meets residency requirements on paper.
Why Digital Sovereignty Became Mandatory in 2025–2026
A regulatory triad has fundamentally redefined cloud compliance:
NIS2 – Supply-Chain Accountability
Organizations must maintain full visibility and control over their infrastructure supply chain — including subcontractors, MSPs, SaaS platforms, and cloud operators. Contracts alone are no longer sufficient.
DORA – Operational Resilience
Regulated sectors must demonstrate resilience, exit strategies, multi-vendor survivability, and continuity under failure — eliminating concentration risk on single hyperscalers.
EU AI Act – Sovereign AI Infrastructure
High-risk AI systems must operate entirely under EU jurisdiction, including training pipelines, inference environments, logs, telemetry and metadata.
US CLOUD Act – Jurisdictional Backdoor
US-controlled cloud providers can be legally compelled to provide access to EU-hosted data — creating a permanent sovereignty conflict.
Why Europe Needs Its Own Cloud Ecosystem
Dependency on Foreign Hyperscalers
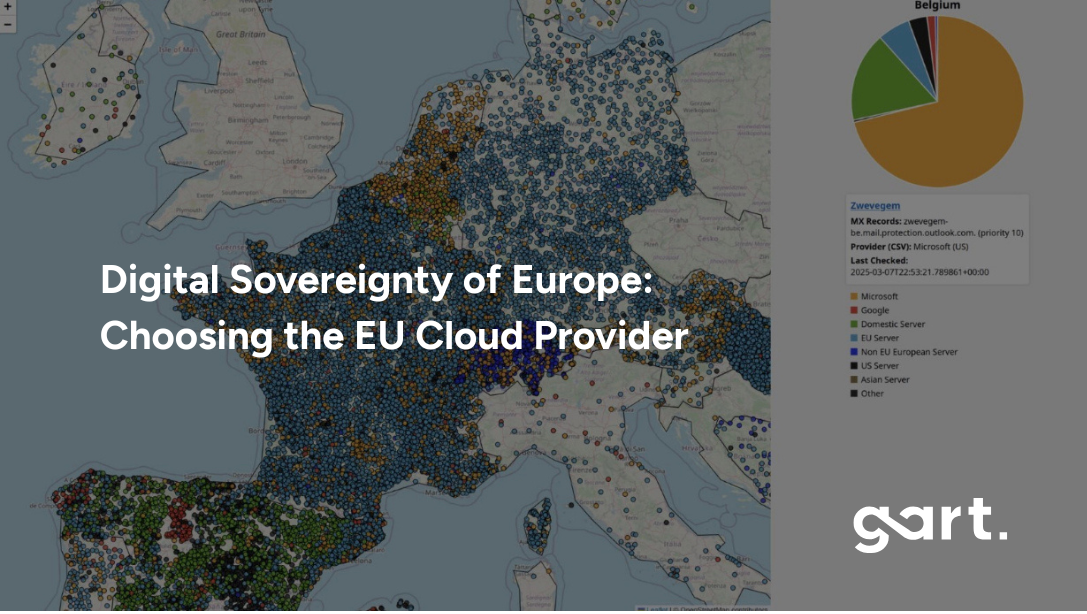
As of 2025, American tech giants control more than 70% of Europe’s cloud infrastructure. That’s a staggering figure — and one that leaves little room for self-determination.
Let’s take, for example, Belgium – Microsoft (with US stored data) has 70% of the market for cloud infrastructure. In Sweden, over 57% of public digital infrastructure — including cities and government services — runs on Microsoft mail servers. In Finland — 77%, Belgium — 72%, Netherlands — 60%, Norway — 64%.
Want to see what cloud services your country is using?
Explore the map: https://lnkd.in/eAdnFt74
Whether it’s a local municipality storing its citizens’ health records or a fintech startup handling millions of transactions, chances are, their data sits on servers operated by foreign entities.
Worse still, this monopoly can lead to vendor lock-in. Companies get tied into proprietary ecosystems that make switching costly and complicated. In contrast, European providers often focus on open-source compatibility and multi-cloud strategies, giving users more freedom and flexibility.
Europe needs its own cloud, not to build walls but to ensure it can compete fairly, uphold its laws, and foster a vibrant digital economy rooted in democratic principles.
The Regulatory Landscape Shaping Europe’s Cloud Strategy
Europe now operates under one of the world’s most comprehensive digital regulatory frameworks. Beyond GDPR, several major laws directly impact how organizations must evaluate cloud providers:
NIS2 Directive – strict cybersecurity and supply-chain obligations for essential and important entities.
Data Governance Act – rules for trusted data sharing across sectors and borders.
Data Act – clarity on who owns and can commercialize IoT-generated data.
Digital Services Act & Digital Markets Act – transparency, accountability, and competition rules for digital platforms.
EU Cybersecurity Act – EU-wide certification schemes for cloud services.
EU AI Act – governance, transparency, and risk-management requirements for AI systems.
This regulatory environment is driving organizations toward EU-native cloud providers that can guarantee compliance without the legal contradictions of foreign jurisdiction.
Key Features to Look for in a European Cloud Provider
Data Residency Within EU Borders
One of the most essential features to demand from any cloud provider in Europe is guaranteed data residency within the EU. Why? Because where data lives determines which laws apply to it. If your business stores sensitive customer information — emails, financial records, medical data — on a cloud hosted in the EU, it's protected by the General Data Protection Regulation (GDPR) and other local laws.
Storing data in the EU ensures:
It cannot be accessed by non-EU jurisdictions without violating EU law.
It remains subject to EU-based audit, regulation, and enforcement.
It aligns with emerging policies like the EU Data Governance Act and Digital Services Act.
EU-based cloud providers like OVHcloud, Scaleway, Hetzner, and Aruba Cloud maintain fully European data center infrastructure, with no dependency on U.S. control. This is particularly important for regulated industries like healthcare, banking, legal, and public services, where compliance breaches can lead to devastating penalties and reputational damage.
Data sovereignty starts with location — but it ends with legal control. Choosing a provider that guarantees both gives you peace of mind and legal clarity.
Metadata Sovereignty — The Hidden Risk Most Organizations Miss
Even when sensitive data is encrypted, cloud platforms still collect metadata:logs, diagnostics, traffic patterns, API calls, access credentials, and telemetry.
This metadata can reveal more about your operations than you might expect — and if handled by a foreign-owned provider, it may fall under foreign jurisdiction even if stored in the EU.
A truly sovereign cloud provider keeps:✔ data in the EU✔ metadata in the EU✔ support services in the EU
This closes one of the most overlooked gaps in compliance architectures.
Transparent Pricing and Vendor Lock-In Avoidance
One common complaint with U.S. hyperscalers is the complexity and unpredictability of pricing. Want to know how much it costs to move 10TB of data out of AWS? You might need a PhD in fine print. By contrast, many European cloud providers prioritize pricing transparency.
Providers like Hetzner and Scaleway offer flat-rate pricing, pay-as-you-go models, and clear invoicing structures. This allows businesses to forecast cloud costs more accurately, especially important for SMEs and startups.
Another key differentiator is freedom from vendor lock-in. Many European providers focus on open-source compatibility and open APIs, which makes it easier to move workloads between cloud platforms or even back on-premises. That’s crucial for long-term agility and cost control.
If you're planning a cloud strategy for the next 5–10 years, flexibility should be as important as functionality.
A Roadmap to Digital Sovereignty (5-Step Framework)
For many organizations, sovereignty is not a single decision — it is a multi-phase transformation.
1. Assess & MapIdentify where your data lives today, who controls it, and which workloads require sovereignty.
2. Govern & SteerEstablish internal roles, policies, data classification, and governance structures aligned with EU directives.
3. Plan & DesignArchitect multi-cloud or sovereign-cloud environments that separate critical data from non-critical workloads.
4. Transform & ImplementMigrate workloads, adopt zero-trust principles, enforce encryption, and integrate monitoring and audit tools.
5. Run & ManageContinuously validate compliance, update classifications, manage identity, and evolve architecture as regulations change.
This structured framework helps organizations modernize cloud infrastructure without sacrificing regulatory alignment or operational agility.
Two Sovereign Cloud Operating Models in Europe
1️⃣ Full EU Isolation Model (Maximum Legal Immunity)
100% EU-owned, EU-operated, EU-law governed infrastructure.No legal backdoors. No foreign jurisdictional exposure.
Best for: government, healthcare, banking, utilities, critical infrastructure.
2️⃣ Guardrail Sovereign Model (Balanced Innovation)
Hyperscaler-grade platforms operated under EU legal entities with EU cryptographic control, EU operations, and technical guardrails.
Best for: regulated enterprises, SaaS, AI platforms, scaleups.
Top European Cloud Providers Supporting Digital Sovereignty
Full EU Sovereign Providers
ProviderCore StrengthHetzner (DE)Cost-efficient, high-performance infrastructureOVHcloud (FR)Full-stack EU hyperscaler alternativeScaleway (FR)Developer-centric cloud & GPU infrastructureT-Systems / Open Telekom Cloud (DE)Government & enterprise complianceAruba Cloud (IT)SME-friendly sovereign infrastructureFull EU Sovereign Providers
Guardrail Sovereign Providers
ProviderPositioningAWS EU Sovereign CloudHyperscaler services under EU legal & operational controlDelos Cloud / GCP / T-SystemsNational guardrail sovereign deploymentsAzure EU entitiesEU-operated, key-controlled environmentsGuardrail Sovereign Providers
OVHcloud (France)
As one of the largest EU-native cloud providers, OVHcloud has become a go-to choice for businesses seeking sovereignty. Based in France, it operates over 30 data centers worldwide with a strong emphasis on EU jurisdiction, sustainability, and open standards.
Strengths:
Extensive product catalog (IaaS, PaaS, Kubernetes, AI)
Certified for GDPR, ISO 27001, HDS, and more
Active participant in Gaia-X
Green data centers with water-cooled servers
OVHcloud offers a user experience similar to AWS but with less vendor lock-in and better EU-specific support.
Scaleway (France)
Scaleway is one of Europe’s most developer-friendly cloud providers, known for its sleek design, open-source tools, and transparent business model. It’s fully GDPR-compliant and headquartered in Paris, with data centers exclusively within the EU.
Highlights:
Flexible virtual instances and GPU-powered machines
Containers, serverless functions, and managed databases
Strong edge and ARM infrastructure for innovation
Scaleway is ideal for startups, SaaS providers, and dev teams who want sovereignty and simplicity.
Hetzner (Germany)
Hetzner has built a stellar reputation for high-performance, affordable cloud and dedicated servers. With its data centers in Germany and Finland, Hetzner ensures GDPR-compliant storage and processing at a fraction of the cost of global hyperscalers.
Unique features:
Flat-rate pricing and extremely low cost-per-GB
Full control with root access and SSH
Ideal for hosting, SaaS, and DevOps workflows
Case Study – Scaling a Global Environmental Platform
To support ReSource International’s global ambitions, Gart Solutions re-architected elandfill.io into a scalable SaaS platform on Hetzner Cloud. The solution replaced costly AWS plans with a Kubernetes-based setup, enabling real-time processing of geospatial and environmental data. As a result, the platform expanded from Iceland to 14 countries, cut infrastructure costs by 60%, and stayed true to its green tech values. Hetzner helped turn a local environmental tool into a global digital platform, without the AWS price tag.
Learn more.
T-Systems / Open Telekom Cloud (Germany)
Backed by Deutsche Telekom, T-Systems operates the Open Telekom Cloud, one of the most secure and enterprise-ready clouds in Europe. With high availability zones in Germany and the Netherlands, it’s perfect for businesses with compliance-heavy workloads.
Best for:
Government agencies and public services
Large enterprises needing hybrid cloud options
Healthcare, finance, and automotive sectors
T-Systems combines German engineering with global IT support, and it's deeply involved in Gaia-X and sovereign cloud initiatives.
Aruba Cloud (Italy)
Aruba Cloud is one of Italy’s leading cloud providers with a robust infrastructure across Europe. Known for its simplicity and cost-effectiveness, Aruba is a great choice for small and mid-sized businesses.
Benefits:
Data centers in Italy, France, Germany, and Czech Republic
Compliant with EU standards
Offers both VPS and enterprise IaaS solutions
If you're looking for sovereign cloud hosting with strong regional presence, Aruba is a top contender.
Industry-Specific Requirements for Sovereign Cloud
Different sectors face different sovereignty obligations. Understanding these nuances helps organizations select the right provider:
SectorSovereignty RequirementPublic SectorFull national & EU legal controlBanking & FinTechDORA-compliant resilience & exit strategiesHealthcareAI Act + GDPR + NIS2 enforcementSaaS PlatformsSovereign AI pipelines & data processingUtilitiesCritical-infrastructure continuity mandatesIndustry-Specific Sovereignty Requirements
Public SectorMust ensure data remains fully under national and EU jurisdiction, with strict auditing, support transparency, and high-assurance certification.
Banking & Financial ServicesSensitive personal and transactional data require robust sovereignty, continuous monitoring, and compliance with EBA, PSD2, and NIS2 guidelines.
Utilities & Critical InfrastructureAs “essential entities,” they must meet strict incident reporting, supply-chain controls, and ensure operational continuity under EU law.
SaaS & Digital PlatformsNeed sovereignty to serve regulated industries and expand globally, while preventing foreign access to customer datasets and analytics pipelines.
These requirements demonstrate why one-size-fits-all cloud strategies rarely work in Europe — sovereignty depends on sector, sensitivity, and scale.
Gaia-X and the Future of Federated Cloud Infrastructure
What Gaia-X Is and Why It Matters
Gaia-X is the EU’s most ambitious project aimed at reclaiming control over Europe’s digital future. Instead of creating another cloud provider, Gaia-X acts as a federated cloud ecosystem, connecting providers, users, and platforms under a common framework of trust, transparency, and interoperability.
It’s designed to ensure:
Sovereign data sharing between companies and countries
Vendor-neutral cloud architectures
Portability and reversibility of services
Full GDPR compliance by design
The ultimate goal of Gaia-X is to enable innovation while maintaining control over how and where data is used. It promotes open standards, multi-cloud strategies, and secure data flows across industries—from finance and energy to health and smart cities.
Gaia-X is not just a tech play. It’s a political and economic declaration that Europe will no longer rely solely on foreign tech monopolies. It’s about building a digitally autonomous future from the ground up.
Who’s Participating in Gaia-X?
Gaia-X brings together a mix of public institutions, startups, established tech companies, research centers, and policy groups. Major players include:
OVHcloud
T-Systems / Deutsche Telekom
Orange Business Services
Atos
Siemens
Scaleway
But it’s not just for the big guys — hundreds of SMEs and open-source projects have joined Gaia-X, contributing to use cases, governance frameworks, and technological standards.
In short, Gaia-X is building a community. By making sovereignty a shared responsibility, it encourages cooperation over competition. It’s about creating a European answer to AWS and Google Cloud without replicating their centralized models.
Gaia-X vs. Traditional Cloud Models
Here’s how Gaia-X fundamentally differs from the global cloud giants:
While Gaia-X won’t replace hyperscalers overnight, it will provide a blueprint for how Europe can innovate without compromising its values.
Sovereign AI — The Next Stage of European Autonomy
As AI adoption accelerates, sovereignty concerns extend far beyond traditional cloud services.
AI systems depend on massive datasets — customer information, behavioral patterns, industrial telemetry, and operational metadata. If this data is processed or stored by non-EU providers, it may fall under non-EU jurisdiction, even if anonymized.
The upcoming EU AI Act introduces strict governance requirements:
transparency of datasets
traceability and auditability
control over model training and inference
risk classifications for high-impact AI systems
For many organizations, this means AI workloads must run on EU-governed infrastructure with EU-controlled metadata, model weights, logging, and monitoring.
Sovereign AI is no longer optional — it will soon be an essential compliance requirement.
Challenges in Adopting EU Cloud Providers
Lack of Feature Parity with Global Giants
Despite their growth, many EU cloud providers still lack the breadth of services offered by hyperscalers. If your organization relies on cutting-edge AI/ML pipelines, advanced serverless infrastructure, or global CDN optimization, you may find some gaps.
For example:
OVHcloud may not match AWS in managed AI services.
Scaleway doesn’t yet offer the global distribution options of Google Cloud.
Hetzner, while powerful, lacks native integrations for enterprise software stacks like Salesforce or Microsoft 365.
The Hidden Cost of Sovereignty
Cloud migration is not only a legal challenge — it is a financial one.
Egress fees ($0.05–$0.09 per GB) create material cost exposure for enterprises migrating regulated workloads. Poorly planned migrations multiply sovereignty risk and long-term operational costs.
Sovereign-first architectures typically reduce egress spend by 30–50% through:
• Pipeline locality redesign• Data gravity containment• Multi-region replication strategies• Exit-optimized storage models
How to Choose the Right EU Cloud Provider
Assessing Security, Scalability, and Support
Choosing the right European cloud provider means balancing technical capabilities with regulatory requirements and business goals. Here's a quick checklist to guide your decision:
Security: Does the provider offer end-to-end encryption, ISO 27001 certification, DDoS protection, and GDPR-compliant data handling?
Scalability: Can the infrastructure scale horizontally and vertically? Are there options for load balancing, container orchestration, or serverless deployment?
Support: Is there 24/7 customer support in your local language? Do they offer clear Service Level Agreements (SLAs) and migration support?
Ecosystem Fit: Does the provider support open APIs, DevOps tooling, and integration with your software stack?
Data Jurisdiction: Are your workloads 100% located in EU jurisdictions, and not subject to non-EU laws like the CLOUD Act?
Providers like Scaleway are ideal for developers and agile startups, while T-Systems suits highly regulated enterprises. Hetzner is unbeatable for performance-per-euro, and OVHcloud delivers full-stack capabilities at scale.
Hybrid and Multi-Cloud Sovereignty Strategies
Not every workload needs to be moved off AWS or Azure today. A practical approach for many businesses is to adopt a hybrid or multi-cloud model:
Use hyperscalers for global edge services or non-sensitive content delivery.
Deploy critical workloads — like customer databases, compliance logs, or analytics pipelines — on sovereign EU clouds.
Leverage Kubernetes, Terraform, and Ansible to orchestrate resources across environments with minimal lock-in.
This strategy offers the best of both worlds: access to global performance when needed, and sovereignty where it matters. Just make sure your orchestration tools support cloud-agnostic deployments.
Conclusion
Europe stands at a crossroads. It can continue to rely on foreign digital giants — or it can take control of its digital destiny. Choosing a European cloud provider is about much more than IT infrastructure.
It’s about:
Preserving privacy
Empowering local innovation
Strengthening legal autonomy
Driving economic growth
https://youtu.be/9VratGTxbZQ?si=LwnmskfbGPQ9RpKE
Providers like OVHcloud, Scaleway, Hetzner, T-Systems, and Aruba Cloud offer real, battle-tested alternatives that align with these goals. The emergence of Gaia-X and sovereign frameworks is accelerating this shift.
How Gart Solutions Supports Sovereign Cloud Transformation
Gart Solutions designs sovereign-first cloud architectures, NIS2/DORA/AI-Act compliant migration roadmaps, egress-optimized multi-cloud strategies, and EU sovereign AI infrastructure.
If your workloads involve regulated data, AI pipelines, public integrations, or cross-border SaaS — your cloud architecture is now a legal architecture decision.
For businesses, the path is clear: audit your cloud strategy, embrace sovereignty where it counts, and invest in a future where Europe owns its cloud — and not the other way around. Contact Us and let's find the best cloud provider, that support your business needs and future plans.
Download our Digital Sovereignty Readiness & EU Cloud Assessment Guide
Digital-Sovereignty-Readiness-EU-Cloud-Assessment-GuideDownload