Cost-effectiveness in cloud and DevOps isn't about finding the cheapest provider — it's about building systems that reduce total cost of ownership while supporting long-term business growth. Here's what that actually looks like in practice.
27%
of cloud spend estimated wasted
Flexera State of the Cloud, 2024
81%
compute cost reduction via Azure Spot VMs
Gart Solutions Case Study
48%
infrastructure cost reduction after FinOps audit
Gart Solutions Case Study
65%
dev/test cost reduction with environment scheduling
AWS Well-Architected Framework
What Cost-Effectiveness Really Means in DevOps and Cloud
Most IT leaders define cost-effectiveness as "spending less." That's wrong — and it's an expensive misunderstanding.
True cost-effectiveness means maximizing the value generated by every dollar of infrastructure and engineering investment. It demands that you ask not "How do I pay less this month?" but "How do I build systems that cost less over the next 24 months while delivering higher performance, reliability, and innovation velocity?"
In DevOps and cloud contexts specifically, cost-effectiveness sits at the intersection of three disciplines:
Engineering efficiency — architectures that avoid waste, scale predictably, and minimize manual toil
Financial governance — visibility, accountability, and discipline over variable cloud spend (FinOps)
Strategic investment — knowing where to spend more now to spend significantly less later
💡Key TakeawayCost-effectiveness is not a cost-cutting exercise. It is a discipline that aligns engineering decisions with financial reality — and it requires ongoing operational practice, not a one-time audit.
According to the FinOps Foundation, cloud financial management is "an evolving discipline that enables organizations to get maximum business value by helping engineering, finance, technology, and business teams collaborate on data-driven spending decisions." That's the operating definition we work from at Gart.
Why the Cheapest Option Is Never the Cost-Effective One
Businesses chasing cheap options in cloud and DevOps consistently encounter the same patterns of failure. Here's what actually happens.
The Free Credits Trap
Cloud startup programs from Google Cloud, AWS, and Azure are genuinely valuable — but they create a dangerous incentive. Engineering teams optimize for "doesn't cost us anything right now" rather than "performs well when we're paying for it." When credits expire, organizations face infrastructure costs 3–5× higher than necessary because no one designed for efficiency.
This happened to a startup we worked with that built its entire HoloLens application on GCP. When startup program credits ran out, their monthly bill became unmanageable — primarily driven by egress costs from a network architecture that was invisible during the free period.
Read the full case study
According to Flexera's 2024 State of the Cloud Report, organizations estimate that 27% of cloud spend is wasted. For a company spending $50,000/month on cloud infrastructure, that's $162,000 in annual waste — far exceeding any short-term savings from choosing cheaper tooling upfront.
Hidden Costs of "Budget" DevOps Solutions
Choosing the cheapest DevOps tooling or most junior engineers to "save money" introduces costs that never appear on the invoice:
Technical debt that requires expensive rewrites within 12–18 months
Incidents and downtime — every hour of downtime costs engineering time, customer trust, and revenue
Re-platforming costs when infrastructure can't scale with the business
Security vulnerabilities from skipped compliance and patching practices
Talent attrition from teams forced to maintain poor infrastructure
Common MistakeEvaluating cloud infrastructure costs on a monthly basis instead of a 24-month TCO. Month-one "savings" from cheap choices almost always invert by month 12 when technical debt accumulates and rebuilding begins.
Estimate Your Real Cloud Waste
Our engineers run a free 30-minute cloud waste assessment — identifying where your budget is leaking before it becomes a bigger problem.
Book Free Assessment →
Sustainable IT Cost Reductions vs. Short-Term Cuts
Economic pressure creates a predictable pattern: CIOs issue blanket cost-reduction mandates, teams cut immediately visible line items, and six months later the organization is dealing with the consequences of those cuts while overspending in new areas.
The Four Traps of Reckless Cost-Cutting
1Short-term focus
Cutting without understanding which investments generate future savings. Eliminating a $2,000/month monitoring tool can cause a $50,000 incident that goes undetected for 48 hours.
2Overreliance on consultants
External consultants often identify low-hanging fruit but rarely address the structural issues that cause waste to return within 6 months.
3Ignoring stakeholders
Cutting DevOps tooling that engineering teams rely on creates invisible productivity drag. A $5,000/month tool that saves 40 hours of engineering time is deeply cost-effective.
4Skipping rightsizing
Organizations consistently run workloads on instance types provisioned for peak load from 18 months ago. Average CPU utilization in enterprise cloud is 12–15% (Gartner, 2023).
✓
Expert Insight — Fedir Kompaniiets
In every cost reduction engagement we run, we start with observation before optimization. Two weeks of detailed cost attribution by environment, team, and workload consistently reveals 3–4 major cost drivers that don't appear on any executive dashboard. Fix those first, then establish process to prevent recurrence.
Avoid These 3 Common Mistakes:
Short-term focus: Cutting across the board can hinder future growth and innovation.
Overreliance on consultants: Consultants often suggest low-hanging fruit, leaving limited potential for long-term savings.
Neglecting stakeholders: Ignoring the impact of IT cuts on business operations can damage relationships and hinder outcomes.
The GART Sustainable DevOps Framework
Over seven years of cloud and DevOps engagements, we've codified our approach into a repeatable five-stage methodology. Every client engagement moves through these stages — sometimes rapidly, sometimes over 12 months — depending on starting maturity.
Proprietary Methodology
GART Sustainable DevOps Framework™
Five stages from cloud chaos to compounding cost efficiency
1
Visibility
Full cost attribution by team, service, and environment. No optimization without visibility.
2
Optimization
Rightsize, schedule, and re-architect for efficiency. Target waste before adding governance.
3
Automation
IaC, autoscaling, and CI/CD eliminate manual drift and provisioning waste.
4
Governance
Budgets, alerts, tagging standards, and FinOps rituals embedded into team workflows.
5
Sustainability
Continuous improvement, GreenOps, and cost culture that compounds savings over time.
Most organizations arrive at Gart somewhere in Stage 1 or early Stage 2 — they have cloud spend, but limited attribution. The fastest ROI comes from moving through Stage 2 quickly: systematic rightsizing, environment scheduling, and reserved capacity typically deliver 20–40% cost reduction before any architectural changes.
Methodology
Framework stages are sequential by design. Organizations that attempt Stage 4 governance without Stage 1 visibility consistently fail — teams cannot govern what they cannot see. All percentage savings cited in this article reflect results measured over 60–90 day periods after implementation, compared to the 60-day baseline period preceding engagement.
How to Audit Cloud Waste: A Practical Guide
Before optimizing anything, you need to know where money is going. A cloud waste audit is not a one-time exercise — it's a structured review that should happen quarterly at minimum, and monthly for organizations spending over $20,000/month.
In one AWS environment audit completed in 2024, 22% of monthly spend came from idle non-production clusters left running after work hours. A single automated shutdown schedule eliminated $8,400/month with zero impact on developer productivity.
The Seven Categories of Cloud Waste
Waste CategoryWhat to Look ForTypical ImpactFix DifficultyIdle non-production environmentsClusters, VMs running 24/7 despite 8-hour usage patterns15–25% of computeLowOrphaned resourcesUnattached EBS volumes, unused Elastic IPs, idle load balancers5–12% of spendLowOverprovisioned instancesVMs at <10% average CPU; memory wastage >60%10–30% of computeMediumStorage wasteOld snapshots, stale S3 objects in hot tier, logging bloat8–20% of storageLowExcessive NAT gateway costsHigh data processing from poorly routed traffic5–15% of networkingMediumOverprovisioned Kubernetes clustersNode pools sized for peak; pod autoscaling not configured20–40% of computeHighReserved capacity mismatchReserved Instances for deprecated instance types or dead workloads10–20% of reserved spendMediumThe Seven Categories of Cloud Waste
Kubernetes Cost Optimization: The Hidden Driver
For organizations running container-based workloads, Kubernetes cost optimization deserves special attention. The CNCF reports container adoption accelerating, while cost governance for containerized workloads consistently lags. Common Kubernetes waste sources:
Oversized node pools — teams provision for maximum workload and never scale down
Missing Vertical Pod Autoscaler (VPA) — pods run at requested resources, not actual usage
No namespace-level cost attribution — developers can't see the financial impact of their services
Persistent volumes left after pod deletion — a common source of mystery storage charges
Inefficient base images — large images increase pull time, storage, and data transfer costs
Understanding Cloud Costs in DevOps: OpEx vs. CapEx
Summary:
DevOps-related cloud costs fall into two main categories: Operational Expenses (OpEx) and Capital Expenses (CapEx). Knowing the difference helps you budget and optimize more effectively.
Operational Expenses (OpEx)
OpEx refers to ongoing costs of running DevOps workloads in the cloud, such as:
Cloud instance runtime (compute)
Storage usage
Managed services (like databases or monitoring tools)
Traffic and bandwidth
These costs are typically pay-as-you-go and vary month-to-month.
Capital Expenses (CapEx)
CapEx refers to one-time or upfront investments, such as:
Reserved cloud capacity (e.g., AWS Reserved Instances)
On-premise infrastructure purchases
Software licenses or setup fees
Choosing CapEx can reduce monthly spending, but it requires commitment and forecasting.
The shift from on-premises CapEx to cloud OpEx is one of the most consequential changes in enterprise IT finance — and one of the most misunderstood. Getting this right is foundational to cost-effectiveness.
CriteriaCapEx (On-premises)OpEx (Cloud)Nature of expenseLarge upfront investmentOngoing, usage-based costsTax treatmentDepreciated over 3–7 yearsFully deductible in year incurredCapacity flexibilitySized for peak; most capacity often idleElastic; scales with actual demandBudget predictabilityPredictable after purchaseVariable — requires FinOps disciplineRefresh cycle riskTechnology obsolescence every 3–5 yearsAlways on current-generation hardwareOptimization leverLimited after purchaseContinuous — rightsize at any timeUnderstanding Cloud Costs in DevOps: OpEx vs. CapEx
⚠️ Key Risk
The OpEx model's flexibility is also its danger. Without FinOps governance, cloud costs can grow unchecked. Organizations that achieve genuine cost-effectiveness pair cloud adoption with FinOps discipline from day one — not after the first unpleasant invoice.
Reserved Instances vs. Savings Plans: A Practical Decision
One of the highest-ROI cost-effectiveness decisions is committing to reserved capacity for stable, predictable workloads. The AWS Well-Architected Framework recommends reserving 70–80% of steady-state workloads on 1-year or 3-year terms — savings typically range from 30–60% versus on-demand pricing.
The critical nuance: never reserve capacity before rightsizing. Organizations that purchase Reserved Instances for oversized instances lock in waste for up to three years. The sequence must always be: rightsize → reserve → monitor.
What is FinOps and Why It Matters for Cost-Effectiveness
FinOps — Financial Operations for Cloud — bridges engineering, finance, and product to ensure cloud spending generates proportional business value. According to the FinOps Foundation's State of FinOps Report, organizations with mature FinOps practices achieve 20–35% better cloud cost efficiency than those without, while also shipping faster because engineers spend less time firefighting budget overruns.
FinOps Maturity Stages
StageCharacteristicsTypical Cloud WasteCrawlReactive cost management; no attribution; single monthly review30–40%WalkCost dashboards in place; basic tagging; weekly review; some rightsizing15–25%RunReal-time visibility; anomaly alerts; automated optimization; team accountability5–12%FinOps Maturity Stages
What is FinOps and Why Does It Matter in Cost Optimization
Summary:
FinOps (Financial Operations) is a framework that brings financial discipline into DevOps, ensuring cloud spending is aligned with business value and usage.
Defining FinOps in Simple Terms
FinOps helps teams:
Understand where cloud dollars are going
Predict costs before deploying
Optimize spend without stalling innovation
It’s the bridge between engineering, finance, and operations.
Why FinOps is a Game-Changer
In traditional IT, budgets are fixed. But in the cloud, expenses are variable and usage-driven. That makes cost control harder, unless teams actively manage and monitor costs.
FinOps brings visibility and accountability across:
Engineers (who build infrastructure)
Finance teams (who manage budgets)
Product managers (who track business value)
Key FinOps Practices:
Real-time cloud cost reporting
Cost forecasting by team/project
Tagging resources for accountability
Optimization sprints focused on spend reduction.
FinOps, or Financial Operations, is an evolving cloud financial management discipline that brings financial accountability to the variable spend model of cloud, enabling distributed teams to make business trade-offs between speed, cost, and quality.
Practical FinOps Workflow: What We Actually Do
Most FinOps guides describe what FinOps is. This is what a real FinOps workflow looks like in practice — the process we run with clients from month one.
1
Tag all resources consistently
Implement mandatory tagging: team, environment, project, owner. Enforce at IAM policy level so untagged resources cannot be created. This is the foundation without which nothing else works.
2
Group by business unit and create budgets
Assign cost center ownership to each team. Set budgets based on prior 60-day actuals + growth rate. Finance and engineering must agree on these numbers together — not separately.
3
Identify anomalies with automated alerting
Configure alerts at 80% and 100% of budget thresholds. Add anomaly detection for day-over-day spend increases above 20%. Route alerts to the responsible team, not just to finance.
4
Rightsize workloads based on utilization data
Pull 30-day CPU, memory, and I/O utilization. Identify instances with <15% average CPU utilization. Downsize, schedule, or terminate. Run compute optimizer recommendations with engineering review.
5
Apply reserved capacity for stable workloads
After rightsizing, commit to 1-year Reserved Instances or Savings Plans for workloads with >75% utilization consistency. Target 60–80% reservation coverage for steady-state infrastructure.
6
Measure and report savings monthly
Track absolute savings ($ vs. baseline), efficiency improvements ($ per workload unit), and coverage metrics (% of spend attributed, % reserved). Share results with leadership in a standardized report.
From Practice: What Takes Longest
The hardest part of FinOps implementation is not technical — it's behavioral. Getting engineers to care about cost requires connecting infrastructure decisions to outcomes they already care about: shipping faster, having more reliable systems, and avoiding firefighting. Cost culture is built through visibility, not mandates.
Get a FinOps Maturity Review
Understand where your organization sits on the FinOps maturity curve — and what specific steps will move you to the next level.
Get Free Review →
Cost-Effectiveness by Growth Stage
Cost-effectiveness strategies vary dramatically depending on where your organization sits in its growth curve. The right moves for a $3,000/month cloud spender are completely different from those for an enterprise spending $200,000/month.
Startup
<$5,000/month cloud spend
Priority Strategies
Maximize cloud credits — but design for paid operation from day one
Use managed services: your time costs more than the premium
Spot/Preemptible instances for all dev/test environments
Tag everything from the start — retroactive tagging is painful
Common Mistakes
Optimizing for the free tier instead of production costs
Running dev environments 24/7
Skipping logging/monitoring to "save money"
Governance
Monthly spend review is sufficient at this stage
One person owns cloud costs — ideally the CTO
Scale-up
$5,000–$50,000/month
Priority Strategies
Rightsize aggressively — utilization data now justifies engineering time
Introduce reserved capacity for production workloads
Implement autoscaling for variable workloads
Start FinOps tagging and attribution by team
Common Mistakes
Reserving before rightsizing — locking in waste
No environment scheduling for non-production
Kubernetes without resource limits and VPA
Governance
Weekly FinOps review; budget alerts configured
Dedicated FinOps champion on engineering team
Enterprise
$50,000+/month
Priority Strategies
Multi-cloud cost governance and provider negotiation
AI/LLM workload cost management — inference can spike unexpectedly
GreenOps — carbon-aware workload scheduling
Full chargeback model by business unit
Common Mistakes
FinOps as a finance function, not an engineering practice
No anomaly detection — surprises cost $50K+
Reserved capacity decisions made annually without monthly review
Governance
Dedicated FinOps team; monthly executive reporting
Cloud cost embedded in engineering performance metrics
Case Studies: Cost-Effective DevOps in Depth
The following engagements are published with detailed methodology — not as marketing claims, but as evidence of what structured cost-effectiveness work actually looks like.
01
Startup · Google Cloud Platform · Infrastructure & FinOps
DevOps for Microsoft HoloLens Application on GCP
The Challenge
A startup leveraged Google Cloud startup credits to build and launch a HoloLens application. When credits expired, their monthly bill was unsustainable — primarily driven by egress costs from a network architecture that was never designed with production pricing in mind. Engineering had optimized for development speed, not operational cost.
Gart's Approach
We began with a full infrastructure audit covering resource utilization, network topology, data flow, and service dependencies. The audit identified excessive cross-region traffic, an underutilized Kubernetes cluster running 24/7, and no CI/CD pipeline. We restructured the architecture, implemented CI/CD, and introduced resource scheduling for non-production environments.
Before vs. After: Key Metrics (90-day period)
Before Optimization
Monthly infra: $14,200
Deployment: manual, weekly
MTTR: 4+ hours
Environment scheduling: none
Cost attribution: none
After Optimization
Monthly infra: $7,384 (−48%)
Deployment: CI/CD, daily
MTTR: <25 minutes
Environment scheduling: Auto-shutdown active
Cost attribution: Full tagging active
Lesson Learned
Free credits create a false sense of cost-effectiveness. Architecture decisions made during the "free" period determine your actual cost structure for years. The cheapest time to fix this is before go-live — the second cheapest is immediately after.
02
AI/ML Startup · Microsoft Azure · Compute Optimization & Spot VMs
81% Cloud Cost Reduction for Jewelry AI Vision Platform
The Challenge
A computer vision startup serving the jewelry industry was running heavy ML inference workloads on standard Azure VM instances. Monthly compute spend was $5,200 and growing. Workloads were batch-oriented — not requiring continuous availability — but were provisioned as always-on infrastructure due to the team's inexperience with Spot VM architecture.
Gart's Approach
We redesigned the ML pipeline for fault tolerance and elastic execution: workloads were refactored to checkpoint state, enabling interruption and resumption. Azure Spot VMs — available at 60–90% discount versus standard pricing — became viable. We also automated cost monitoring and introduced a queuing system so inference jobs distributed efficiently across available spot capacity.
Before vs. After: Key Metrics (90-day period)
Before Optimization
Monthly compute: $5,200
VM type: Standard D-series (on-demand)
Pipeline: stateful, non-interruptible
Scalability: manual resizing
Cost monitoring: none
After Optimization
Monthly compute: $988 (−81%)
VM type: Azure Spot VMs with auto-failover
Pipeline: Checkpointed, resumable workloads
Scalability: Automated elastic scaling
Cost monitoring: Real-time automated cost alerts
Lesson Learned
Cost savings of 80%+ do not require cutting features or accepting lower quality. They require understanding your workload's actual characteristics and designing infrastructure to match them. Most workloads have more tolerance for interruption than engineers assume — the challenge is making them resumable.
Contrarian Insights Worth Knowing
Cost-effectiveness advice in the cloud industry is often oversimplified. These are the nuanced positions that experienced practitioners hold — learned the hard way.
↯ Contrarian Insight #1
Moving to Kubernetes too early increases costs for small teams. Kubernetes is extraordinary at scale — but for teams running 5–10 services, the operational overhead of cluster management, node autoscaling, and networking complexity regularly costs more in engineering time than it saves in compute. Evaluate managed containers (ECS, Cloud Run, Container Apps) first.
↯ Contrarian Insight #2
Spot Instances are not always the right optimization strategy for stateful workloads. The 60–90% compute savings are real — but only for workloads designed for interruption. Retrofitting stateful databases or session-sensitive applications for Spot usage can require weeks of engineering work. Include that refactoring cost in your ROI calculation.
↯ Contrarian Insight #3
Observability spend is one of the highest-ROI investments in cost-effectiveness. Most organizations cut monitoring to save money — and then spend far more responding to incidents they couldn't detect quickly. A $2,000/month observability stack that reduces MTTR from 4 hours to 20 minutes pays for itself in the first incident alone. Never cut observability in the name of cost reduction.
↯ Contrarian Insight #4
Multi-cloud complexity often costs more than it saves. Multi-cloud is sound for risk management, but introduces operational complexity, tooling duplication, and skill fragmentation. For organizations under $500K/month in cloud spend, true multi-cloud is rarely cost-effective. Hybrid cloud — one primary cloud plus on-prem for stable workloads — is often the more pragmatic answer.
Long-Term Benefits of a Cost-Effective DevOps Strategy
Sustainable cost-effectiveness compounds over time in ways that short-term cost-cutting never can. Here's what our clients experience over 12–24 months.
1. Lower Total Cost of Ownership (TCO)
Efficient systems cost less to operate, require fewer emergency interventions, and eliminate the costly cycle of re-platforming. Organizations that invest in proper architecture early consistently report 30–50% lower 24-month TCO compared to those that optimize reactively.
2. Greater Reliability and Faster MTTR
Cost-effective systems are inherently more reliable. Proper autoscaling eliminates capacity-driven outages. CI/CD pipelines reduce deployment risk. IaC eliminates configuration drift. All of these reduce the frequency and cost of incidents — among the most expensive and hidden costs in any DevOps operation.
3. Future-Proof Architecture That Scales Without Rewrites
The most expensive infrastructure is the kind you have to rebuild. Strategic architecture choices — containerization, IaC, microservices where appropriate — allow systems to evolve incrementally. We've seen organizations spend 6–12 months rebuilding because early "cost savings" decisions painted them into architectural corners.
4. Engineering Teams That Build Instead of Firefight
When infrastructure is stable, well-monitored, and cost-attributed, engineering teams stop spending cycles on incidents and manual operations. Organizations implementing structured DevOps practices typically recover 20–30% of engineering capacity previously consumed by toil — capacity redirected toward product development.
5. AI and LLM Workload Cost Management
As organizations adopt AI features, inference costs are becoming a significant and poorly-managed budget line. Cost-effective AI workload management requires: choosing the right model size for each use case, implementing caching for repeated queries, monitoring token usage with the same rigor as compute, and batching inference requests where latency tolerance allows.
DevOps Cost Decision Table: Cheap vs. Sustainable
CriteriaCheap Approach✅ Sustainable ApproachInitial CostLow upfront — appears to save moneyModerate; aligned with business goalsScalabilityRequires rebuild at 2–3× current loadDesigned to scale incrementallyCompliance ReadinessLacks HIPAA, GDPR, SOC 2 safeguardsCompliance built into architectureMonitoring & ObservabilityMinimal or none — incidents are invisibleFull stack monitoring; fast MTTRMaintenance overheadHigh manual toil; frequent firefightingAutomated; low operational overheadEngineering riskConfiguration drift; no IaC; no rollbackIaC; version-controlled; reversible24-month TCOHigh — technical debt, rebuilds, incidentsLower — compounding efficiency gainsBusiness impactRisk of downtime; slower delivery velocityFaster delivery; greater stabilityDevOps Cost Decision Table: Cheap vs. Sustainable
Cost-Effectiveness Audit Checklist for IT Leaders
☑
Cloud Cost-Effectiveness Self-Assessment
Infrastructure & Cloud Usage
Are production workloads rightsized based on 30-day utilization data (not peak estimates)?
Are reserved instances or Savings Plans covering 60–80% of steady-state compute?
Do non-production environments auto-shut during off-hours and weekends?
Are Spot/Preemptible instances used for suitable batch and ML workloads?
Have orphaned resources (unattached EBS, unused IPs, idle load balancers) been audited in the last 30 days?
Kubernetes & Container Costs
Are resource requests and limits set on all pods?
Is Vertical Pod Autoscaler (VPA) or KEDA configured for variable workloads?
Are namespace-level cost dashboards visible to engineering teams?
Are persistent volumes cleaned up after pod deletion?
FinOps & Financial Governance
Are all resources tagged by team, environment, and project — enforced at IAM level?
Do budget alerts fire at 80% and 100% of monthly budgets?
Is cost visibility shared between engineering and finance teams weekly?
Has a FinOps champion been identified within the engineering organization?
Are chargeback reports distributed to business unit owners monthly?
DevOps & Automation
Is all infrastructure managed as code (Terraform, Pulumi, CDK)?
Are CI/CD pipelines automated to prevent manual deployment drift?
Is autoscaling configured based on real demand metrics, not static thresholds?
Are deployment rollbacks tested and confirmed functional?
How to Use This Checklist
Any "not implemented" item in the Infrastructure or FinOps sections represents a direct and typically sizable cost-saving opportunity. Prioritize items that take least engineering time to implement first — environment scheduling and orphan cleanup alone can recover 15–25% of monthly cloud spend within two weeks.
Lessons Learned from Real Engagements
We believe in sharing what didn't work as readily as what did. These are genuine lessons from client engagements.
✗
Lesson 1: We Optimized Compute Before Analyzing Networking
In one early engagement, we spent three weeks rightsizing EC2 instances before discovering the majority of the client's bill came from NAT gateway data processing fees — completely unrelated to compute. Always run a full cost attribution audit by service category before beginning targeted optimization. Compute is the most visible cost but not always the largest.
✗
Lesson 2: Reserved Instance Purchases Without Engineering Buy-In Fail
We've seen finance teams purchase Reserved Instances based on billing data without engineering input — only to have engineering migrate or resize those workloads within 90 days, leaving expensive reservations for infrastructure that no longer exists. FinOps decisions must involve engineering. Reserved capacity commitments require a minimum 6-month infrastructure stability forecast, which only engineers can provide.
✓
Lesson 3: The First Win Matters More Than the Biggest Win
When beginning a cost-effectiveness engagement, we now prioritize finding a quick, visible win in the first two weeks — typically environment scheduling or orphaned resource cleanup. This win builds trust, demonstrates that optimization doesn't disrupt operations, and creates organizational momentum for harder architectural changes later.
How Gart Delivers Cost-Effective DevOps
From cloud waste audits to full FinOps implementation — practical, engineering-led cost-effectiveness that compounds over time.
🔍
Cloud Cost Audit
Full infrastructure review identifying waste, rightsizing opportunities, and quick-win savings within 2 weeks.
⚙️
DevOps Services
CI/CD pipelines, IaC, and automation that eliminate operational toil and reduce the cost of delivery.
☁️
Cloud Migration
Right-sized, cost-conscious migration from on-premises or inefficient cloud configurations to optimized architecture.
📊
FinOps Implementation
Cost dashboards, tagging, budgets, and FinOps rituals embedded into your engineering team's workflow.
☸️
Kubernetes Optimization
Right-size node pools, configure VPA/HPA, and implement namespace cost attribution for container workloads.
🛡️
IT Audit Services
Infrastructure, compliance, and security audits that surface both risk exposure and cost reduction opportunities.
Book a Free Assessment
View All Case Studies
Downtime costs more than money — it erodes trust, damages reputation, and in critical systems, can cost lives. At Gart Solutions, we engineer software systems that don't just function — they excel in reliability. Using proven DevOps and SRE practices across production environments, we ensure your digital product is fast, stable, and always ready.
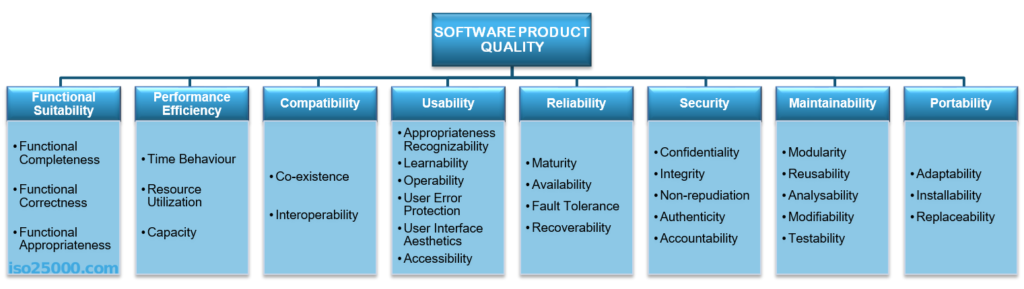
When you use a software product, you expect it to work well and meet your needs. But what does it mean for software to be "high quality"? According to the ISO 9126 standard, the quality of a software product is defined by all its features and characteristics that allow it to meet the needs of its users. One key aspect of quality is how reliable the software is.
This 2026 guide covers software reliability from the ground up: what it means, how to measure it, how to achieve it through SRE and DevOps, and how to handle the hardest operational challenges — from Kubernetes cluster failures to multi-cloud incident response.
$5,600
Average cost of IT downtime per minute (Gartner, 2024)
60%
MTTR reduction achieved by Gart clients after implementing Golden Signal monitoring
99.99%
Availability target requiring less than 52 minutes downtime per year
What is software reliability?
Software reliability is the probability that a software system will perform its required functions under specified conditions for a specified period. It is one of the six core dimensions of software quality defined by the ISO/IEC 9126 standard, alongside functionality, usability, efficiency, maintainability, and portability.
Two elements are central to any practical definition of software reliability:
The environment: the deployment context — cloud, on-premises, containerized, edge — directly determines what "correct operation" looks like and which failure modes are most probable.
The time frame: reliability is always expressed over a period (e.g., 99.9% availability over 30 days), not as an absolute state.
Unlike hardware reliability — which is largely determined by physical manufacturing tolerances — software reliability emerges from the quality of design decisions. A single overlooked null pointer, an unhandled race condition, or an improperly configured retry policy can cascade into a total service outage. This is why modern SRE and DevOps disciplines treat reliability as an engineering problem, not an operational afterthought.
At Gart Solutions, we understand that software reliability isn't just a technical goal—it's a critical component of business success. Our approach to building reliable digital solutions leverages the best practices of DevOps and Site Reliability Engineering (SRE), ensuring that your software not only meets but exceeds industry standards for reliability.
⚡ Key Insight
According to Carnegie Mellon University, software reliability is defined as the probability that software will operate without failure under specified conditions for a specified period. Unlike hardware reliability — which depends on manufacturing precision — software reliability is rooted in design perfection: careful architecture, rigorous testing, and continuous operational feedback.
Reliability in Life-Critical vs. Business-Critical Systems
The stakes of software reliability vary dramatically by context. In life-critical systems — aviation, medical devices, nuclear control software — a single failure can result in catastrophic loss. The Boeing 737 Max MCAS software defect contributed to two fatal crashes; the root cause was a reliability failure in sensor data validation logic.
In business-critical systems, reliability failures translate to measurable financial and reputational harm. Gartner estimates the average cost of unplanned downtime at $5,600 per minute — exceeding $300,000 per hour for enterprise environments. For high-traffic e-commerce platforms, a 10-minute checkout system failure during peak hours can result in hundreds of thousands of dollars in lost conversions and irreversible customer churn.
Reliability vs. Availability vs. Resilience
These three terms are frequently confused — even by experienced engineers. Understanding how they differ is foundational to building and operating reliable systems.
The Software Reliability Triad
Three distinct properties — all required for production-grade systems
Reliability
Works Correctly
Probability of correct function over time. Focused on failures per unit time (MTBF). A system can be available but unreliable (returns wrong data).
Availability
Is Accessible
Percentage of time a system is operational and reachable. Expressed as uptime percentage. A highly available system can still deliver incorrect results.
Resilience
Recovers Fast
Ability to withstand and recover from failures — hardware faults, traffic spikes, dependency outages. Measured by MTTR and failure blast radius.
Availability Targets: What "Nines" Actually Mean
When engineering teams set availability SLOs, they express them as percentages — commonly called "nines." The table below shows what each level means in concrete downtime terms:
Key Reliability Metrics: MTTR, MTBF, MTTD, and Error Rate
Reliability engineering lives and dies by measurable signals. The following four metrics form the operational backbone of any SRE program. Without them, reliability is aspirational — with them, it becomes engineerable.
MTTR
Mean Time To Recover
Total Downtime ÷ # Incidents
Average time to restore service after a failure. The single most impactful metric for user experience. Target: under 30 minutes for critical systems.
MTBF
Mean Time Between Failures
Total Uptime ÷ # Failures
How often failures occur. A higher MTBF indicates more stable, reliable software. Foundation for long-term reliability trend analysis.
MTTD
Mean Time To Detect
Detection Time − Incident Start
How quickly your team detects issues after they occur. Driven entirely by monitoring quality. Undetected failures are the silent killers of reliability.
Error Rate
Request Failure Rate
Failed Requests ÷ Total Requests
Percentage of requests resulting in errors (5xx). Directly linked to your SLIs. A spike in error rate is frequently the first indicator of a degrading service.
Gart Solutions — Real-World Example
Reducing MTTR by 60% for a SaaS Platform
During a Kubernetes migration for a high-traffic SaaS client, we implemented Prometheus + Grafana Golden Signal dashboards with automated PagerDuty escalation. Combined with ArgoCD progressive delivery and automated rollback triggers, we achieved the following over a 60-day period:
60%
Reduction in MTTR
45 → 4 min
Rollback time
3×
MTBF improvement
99.97%
Availability achieved
Achieving Software Reliability Through Design
Reliability is not retrofitted — it is architected from the first design decision. Organizations that treat reliability as a post-deployment concern invariably accumulate technical debt that becomes exponentially more expensive to address under production pressure.
Core Design Principles for Reliable Systems
Design for failure: Assume every component will fail. Build services that degrade gracefully, implement circuit breakers, and use bulkhead patterns to contain failure blast radius.
Stateless services where possible: Stateless components are horizontally scalable and trivially restartable. State should be externalized to purpose-built stores with their own reliability guarantees.
Idempotency: Retrying failed operations should be safe. Design APIs and message handlers to be idempotent — the same request processed twice must produce the same result.
Consistency vs. availability trade-off (CAP theorem): In distributed systems, you cannot simultaneously guarantee consistency, availability, and partition tolerance. Define which you prioritize — and design accordingly.
Avoid synchronous chains: Long chains of synchronous service calls multiply latency and create cascading failure vectors. Use asynchronous messaging with dead-letter queues for non-blocking reliability.
Achieving high levels of software reliability begins with the design phase. Design perfection is the foundation upon which reliable software is built. This involves not only the creation of robust algorithms and data structures but also careful consideration of how the software will interact with other systems and environments.
For example, a software application that runs smoothly on a local server may experience reliability issues when deployed in a cloud environment due to differences in infrastructure. Therefore, understanding the target environment and designing the software to perform well under those conditions is crucial for achieving reliability.
Another important consideration is the trade-off between availability and consistency. In highly available systems, such as those used in financial transactions, ensuring that the system is always online may come at the cost of data consistency. For instance, to ensure high availability, a system might cache data locally to reduce dependency on external systems, but this can lead to data inconsistency if the cache is not regularly updated. Additionally, as availability targets increase (e.g., moving from 99.9% to 99.999%), the complexity of the system architecture also increases exponentially.
SREs must carefully balance these trade-offs to ensure that the system remains both reliable and consistent.
Common Reliability Anti-Patterns to Avoid
Anti-PatternRiskCorrect ApproachUnbounded retry loopsAmplifies load during outages; causes cascading failuresExponential backoff + jitter + retry limitsNo health checksLoad balancers route to dead instancesLiveness + readiness probes (Kubernetes)Synchronous external calls without timeoutThread exhaustion; full service unavailabilityTimeouts + circuit breaker patternSingle database instanceSingle point of failure; zero failoverPrimary-replica with automatic promotionUndifferentiated error handlingSwallowed errors; invisible failuresStructured error taxonomy + alerting per typeNo capacity limitsResource exhaustion under load spikesRate limiting, connection pooling, queue depth limitsCommon Reliability Anti-Patterns to Avoid
SLIs, SLOs, and SLAs Explained
Service Level Indicators, Objectives, and Agreements form the language of reliability commitments. Understanding how they differ — and how they connect — is foundational for every SRE and engineering leader.
Acronym
SLI
Service Level Indicator — a specific, measurable metric that directly reflects user experience.
Examples: Request latency at P95, availability percentage, error rate.
Acronym
SLO
Service Level Objective — the target value or range for an SLI, expressed over a rolling window.
Example: 99.5% of requests must return non-5xx over a 28-day window.
Acronym
SLA
Service Level Agreement — a contractual commitment to customers, typically with financial penalties for breach. SLAs are set conservatively below SLOs to provide a buffer.
Derived From
Error Budget
The allowable margin of unreliability derived from the SLO.
Example: If your SLO is 99.9%, your error budget is 0.1% — roughly 43.8 minutes of downtime per month.
Measuring Software Reliability: SLOs and SLIs
To quantify and manage software reliability, organizations often use Service Level Objectives (SLOs) and Service Level Indicators (SLIs). SLOs are specific targets for system performance, such as the time it takes to acknowledge an order on an e-commerce platform. SLIs, on the other hand, are metrics that measure how well the system is performing against these targets.
For example, an SLO might specify that 99.9% of order acknowledgments must occur within two seconds. The SLI would then measure the actual performance of the system to determine if this target is being met. If the SLI indicates that the system is failing to meet the SLO, this serves as an early warning sign that the system's reliability is at risk, prompting further investigation and remediation.
SLOs and SLIs provide a customer-centric view of reliability, helping organizations ensure that their systems meet user expectations. They also create a feedback loop that allows teams to continuously improve their systems by making data-driven decisions based on real-world performance.
SLOs are a key component of SRE. They define the desired reliability level of a service, usually expressed in terms of availability, latency, or error rates
Practical SLO Example: E-Commerce Checkout Service
📋 SLO Definition
checkout-api.prod
Availability Metric
SLI Formula
non-5xx responses / total requests
SLO Target
≥ 99.9% over rolling 28 days
Latency Metric
SLI Threshold
P95 response time < 400ms
SLO Target
≥ 95% of requests within 400ms
Monthly Error Budget
43.8 minutes
SLA (Customer-facing)
99.5% (with service credit)
Measurement Window
Rolling 28-day (1-min intervals)
SLI Formula Examples
📐 Common SLI Formula
Availability SLI
(Total Requests − Failed Requests) ÷ Total Requests × 100
📐 Common SLI Formula
Latency SLI
Requests served under threshold (e.g., 300ms) ÷ Total Requests × 100
📐 Common SLI Formula
Throughput SLI
Messages processed within SLA window ÷ Expected messages × 100
Error Budgets in Practice
Error budgets are one of SRE's most powerful innovations — they transform the reliability vs. velocity tension from a cultural conflict into a data-driven policy. The core concept: if your SLO is 99.9% availability, you have a 0.1% "budget" of allowable errors per rolling window. Spend that budget wisely.
📊 Error Budget Health Dashboard — Illustrative Example
28-day rolling window — Checkout API (Target: 99.9%)
Week 1
Normal operations
82%
Week 2
Feature deploy with minor rollback
51%
Week 3
Database failover event — FREEZE deployments
12%
Week 4
Post-incident hardening, no releases
67%
Error budgets
SRE introduces the concept of error budgets, which define the acceptable amount of unreliability for a given period (balance low quality releases with operational circumstances). This allows teams to balance innovation and reliability.
If the error budget is exceeded, development slows down, and efforts are refocused on improving stability.
Error Budget Policy: What Happens When You Run Out
Budget > 50% remaining: Normal development velocity. Feature releases proceed on schedule.
Budget 25–50% remaining: Reliability review required before each release. On-call team reviews deployment risk.
Budget < 25% remaining: High-risk deployments paused. Engineering focus shifts to reliability improvements and postmortems.
Budget exhausted: All non-critical deployments frozen until SLO window resets. Leadership escalation required.
Key Takeaway
Error budgets make the reliability vs. innovation trade-off explicit and quantitative. Rather than engineering and operations teams debating whether a service is "stable enough" to release, the error budget provides an objective answer — one that both sides agreed to define before any crisis occurred.
The Three Pillars of Observability
Metrics: Numerical time-series data aggregated at regular intervals. Fast to query, efficient to store. Best for trend analysis and alerting. Examples: request rate, latency percentiles, error count.
Logs: Structured, timestamped event records capturing the context of individual operations. Essential for debugging — answering "what exactly happened for request ID X?" Requires structured logging (JSON) for practical analysis at scale.
Traces: Distributed request journeys showing how a single user request flows across multiple services. Critical for diagnosing latency in microservice architectures. OpenTelemetry has become the de-facto standard for trace instrumentation.
The Four Golden Signals (Google SRE Framework)
Golden Signal 1
Latency
Time from request to response. Distinguish successful request latency from error latency — errors that return in 1ms are still failures. Monitor P50, P95, P99.
Golden Signal 2
Errors
Rate of failed requests — explicit (5xx), implicit (success code but wrong content), and policy failures. Error rate is the most direct SLI for availability SLOs.
Golden Signal 3
Traffic
Volume of demand on your system — requests per second, messages consumed, active WebSocket connections. Traffic context makes other signals meaningful.
Golden Signal 4
Saturation
Resource utilization approaching limits — CPU, memory, disk I/O, connection pool exhaustion. Many performance failures are predictable from saturation trends 30+ minutes in advance.
Kubernetes Reliability: Engineering for Container-Native Systems
Kubernetes has become the dominant substrate for production workloads — and it introduces a distinct set of reliability challenges that go beyond traditional VM-based infrastructure. A misconfigured liveness probe, an absent Pod Disruption Budget, or an unset resource request can silently degrade your SLO while your dashboards show green.
Essential Kubernetes Reliability Practices
PracticeWhy It MattersCommon MistakeLiveness & Readiness ProbesKubernetes restarts unhealthy pods and withholds traffic from unready onesIdentical probe logic — probing the wrong endpoint or missing the probe entirelyResource Requests & LimitsEnables scheduler to guarantee compute; limits prevent noisy-neighbor problemsSetting limits too low (OOMKilled); setting no requests (unpredictable scheduling)Pod Disruption Budgets (PDB)Ensures minimum pod count during voluntary disruptions (node drain, cluster upgrades)No PDB set — rolling updates can take all pods offline simultaneouslyHorizontal Pod Autoscaler (HPA)Scales pod count based on CPU/custom metrics to handle traffic spikesScaling on CPU alone while the bottleneck is I/O or database connectionsMulti-Zone Topology SpreadDistributes pods across availability zones — prevents zonal failure from taking the service downAll replicas scheduled in the same zone due to missing topology constraintsProgressive Delivery (ArgoCD Rollouts)Canary and blue-green deployments limit blast radius of bad releasesAll-at-once deployments that fail 100% of traffic on a broken releaseEssential Kubernetes Reliability Practices
Gart Solutions — Production Example
Implementing ArgoCD Progressive Delivery for Zero-Downtime Releases
A fintech client was experiencing 3–5 minute service degradations during each deployment due to rolling update misconfiguration. We implemented ArgoCD Rollouts with automated Prometheus-based analysis gates: if error rate exceeded 0.5% during the canary phase, the rollout automatically paused and rolled back.
Result: deployment rollback time dropped from 45 minutes to under 4 minutes, and zero customer-impacting deployments in the following 6 months.
Chaos Engineering: Testing Reliability Under Adversarial Conditions
Chaos engineering is the discipline of intentionally introducing controlled failures into production (or production-like) systems to verify that they behave reliably under adversarial conditions. The guiding principle, from Netflix's pioneering work: "the best time to find out your system handles failure poorly is before your users do."
📌 Definition
Chaos engineering is not "breaking things randomly" — it is a disciplined, hypothesis-driven experiment. You define a steady state (e.g., "P95 latency < 300ms"), introduce a specific perturbation (e.g., "kill one of three database replicas"), then observe whether the steady state holds. If it doesn't, you've discovered a reliability gap before it became a customer-impacting incident.
Chaos Engineering Experiment Workflow
1
Define Steady State
What does "normal" look like? Set baseline SLI values.
2
Form Hypothesis
"Killing one pod should not degrade availability below 99.9%"
3
Introduce Failure
Use Chaos Mesh / LitmusChaos to inject fault in a controlled scope.
4
Observe & Measure
Monitor Golden Signals against baseline throughout experiment.
5
Learn & Fix
If steady state broke, identify root cause and harden system.
Common Chaos Experiment Types
Pod kill / node drain: Tests Kubernetes self-healing and PDB correctness
Network latency injection: Validates timeout and circuit breaker configurations
Memory pressure: Confirms OOMKilled pods restart within SLO
Dependency outage: Tests graceful degradation when external APIs are unavailable
Zone failure simulation: Confirms multi-AZ traffic rerouting works correctly
Incident Management Workflow
A well-defined incident management process is the difference between a 10-minute recovery and a 10-hour war room. Effective SRE teams treat incident response as an engineered workflow — not a heroic improvisation.
The 5-Phase Incident Lifecycle
1
Detection
Alert fired from monitoring (Prometheus/PagerDuty), customer report, or anomaly detection. MTTD goal: under 5 minutes for critical services. Key tool: automated alerting on SLO burn rate — not raw metric thresholds.
2
Triage & Severity Assignment
On-call engineer assesses user impact and assigns severity level (SEV1–SEV4). SEV1 = full service down; SEV4 = minor degradation, no SLO impact. Severity determines escalation path and response team composition.
3
Containment & Mitigation
First priority: stop the bleeding. Rollback the last deployment, reroute traffic, scale up replicas, or enable feature flags to disable the failing component. Mitigation is not fixing the root cause — it's restoring user-facing service.
4
Root Cause Analysis
Use distributed traces, structured logs, and timeline reconstruction to identify the specific trigger. Ask "why" five times. Distinguish proximate cause (what broke) from contributing factors (why it was breakable).
5
Blameless Postmortem
Document the full incident timeline, contributing factors, and — critically — specific action items with owners and deadlines. Blameless culture is non-negotiable: psychological safety is a prerequisite for learning from failures. Distribute postmortem to all engineering stakeholders within 48 hours.
Incident Severity Matrix
SeverityImpactResponse TimeEscalationSEV1Total service outage — all users affected< 5 minImmediate — CTO/VP EngineeringSEV2Major feature degraded — >20% users affected< 15 minEngineering Lead + On-call teamSEV3Minor feature degraded — workaround available< 1 hourOn-call engineerSEV4Cosmetic or non-impacting issueNext business dayTicket created, no immediate actionIncident Severity Matrix
Production Readiness Review (PRR)
A Production Readiness Review is a structured assessment conducted before a new service or major feature reaches production. Its purpose: verify that the system is ready to operate reliably at scale before users depend on it.
At Gart Solutions, our PRR process evaluates 7 domains for every service entering production:
Reliability targets defined:SLIs and SLOs documented and agreed upon by engineering and product
Monitoring and alerting in place:Golden Signals instrumented, dashboards created, PagerDuty routing configured
Runbooks written:On-call engineers know how to respond to every alert without escalation
Load testing completed:System validated at 2× expected peak traffic with no SLO breach
Failure modes identified:Dependency failures, data corruption scenarios, and resource exhaustion paths documented
Deployment and rollback plan documented:Progressive delivery strategy defined; rollback validated in staging
On-call coverage assigned:Primary and secondary on-call identified with escalation path confirmed
Reliability Testing Strategies
Reliability is only real if it's been tested under conditions that approximate production reality. The following testing strategies form a complementary suite — each catches failure modes the others miss.
Test TypePurposeToolsWhen to RunLoad TestingValidate performance at expected peak traffick6, Locust, GatlingPre-release, post-architecture changeStress TestingFind the breaking point beyond normal loadk6, JMeterQuarterly, before major traffic eventsSoak / Endurance TestingDetect memory leaks and degradation over timeCustom scripts + APMPre-major releasesChaos EngineeringVerify behavior under unexpected component failuresChaos Mesh, LitmusChaosOngoing, in staging + productionFailover TestingConfirm automatic failover works as expectedCloud provider toolingAfter infrastructure changesDisaster Recovery (DR) DrillsValidate RTO and RPO in realistic scenariosRunbook executionAt minimum twice per yearReliability Testing Strategies
⚠️ Common Pitfall
Most organizations run load tests before launch — then never again. Production traffic patterns evolve, new dependencies are added, database schemas change. A system that passed a load test 18 months ago may have completely different performance characteristics today. Schedule reliability tests as recurring engineering calendar items, not one-time pre-launch rituals.
How SRE & DevOps Work Together
While DevOps and Site Reliability Engineering (SRE) share similar goals, they take distinct approaches to improving software quality and operational excellence. Together, they form a powerful combination for building and maintaining highly reliable systems.
DevOps focuses on unifying development and operations teams to enable continuous integration and delivery (CI/CD), faster releases, and automation throughout the software lifecycle. It’s about breaking silos and enabling speed without sacrificing control.
SRE, introduced by Google, brings a more metrics-driven, engineering-centric approach to reliability. It emphasizes SLOs (Service Level Objectives), error budgets, monitoring, and incident response to ensure systems meet reliability targets without slowing innovation. SRE uses engineering principles to solve operations challenges, making it a natural evolution of DevOps.
Here’s how they compare in key areas:
DimensionDevOpsSite Reliability Engineering (SRE)Primary FocusAutomating delivery & collaborationEnsuring system reliability and availabilityKey PracticesCI/CD, IaC, automation, shift-left testingSLOs, SLIs, error budgets, monitoring, postmortemsGoalFast, frequent, reliable deploymentsMaintain reliability while enabling innovationApproachCultural transformation + toolingEngineering rigor + quantitative metricsKey MetricsDeployment frequency, lead time, change failure rateLatency, availability, error rate, MTTROn-Call?Shared responsibility — devs on-call for what they shipDedicated SRE on-call rotation with escalation pathsHow SRE & DevOps Work Together
The Reliability Engineering Stack
A modern reliability engineering stack integrates tools across the full observability and delivery lifecycle:
Prometheus
Metrics collection & alerting
Grafana
Dashboards & visualization
OpenTelemetry
Tracing & instrumentation
Loki
Log aggregation
PagerDuty
On-call alerting
ArgoCD
Progressive delivery
Kubernetes
Container orchestration
Terraform
Infrastructure as code
Chaos Mesh
Chaos engineering
k6
Load testing
Business Impact of Reliable Software
Software reliability is not a technical goal disconnected from business outcomes — it is one of the highest-ROI investments an organization can make in its engineering capability.
The Financial Case
Gartner's research consistently places the average cost of IT downtime at $5,600 per minute — exceeding $300,000 per hour for enterprise organizations. For SaaS platforms, the compounding effects of downtime include:
Direct revenue loss: Every minute of checkout unavailability is revenue that cannot be recovered.
SLA penalty payments: Enterprise contracts increasingly include uptime SLAs with financial remedies.
Customer acquisition cost amplification: Each churned user due to reliability failure requires marketing spend to replace.
Engineering opportunity cost: Post-incident remediation consumes engineering capacity that could otherwise deliver features.
Reliability as a Competitive Differentiator
In saturated markets, reliability is increasingly the factor that differentiates category leaders from everyone else. Expedia famously increased annual revenue by $12 million by eliminating a single confusing field from their payment form — a reliability improvement in user experience that directly converted to measurable business outcomes.
Organizations that invest in SRE programs consistently report:
Higher Net Promoter Scores (NPS) — reliability builds user trust over time
Lower customer support load — reliable software generates fewer tickets
Faster enterprise sales cycles — robust SLA commitments reduce procurement risk
Higher engineering team retention — on-call engineers on well-monitored, reliable systems experience significantly lower burnout
🚀 Gart Solutions — SRE & DevOps Services
Ready to Engineer Reliability Into Your Systems?
Gart Solutions brings hands-on SRE and DevOps expertise to companies scaling their digital products. From SLO design and monitoring stack implementation to full incident management programs — we help engineering teams build systems that stay up, recover fast, and scale confidently.
SRE Services
SLO/SLI design, error budget implementation, Golden Signal monitoring, on-call program setup
DevOps Engineering
CI/CD pipelines, Infrastructure as Code (Terraform), Kubernetes setup, progressive delivery
IT Monitoring & Observability
Prometheus + Grafana + OpenTelemetry stack, alerting design, dashboard engineering
Kubernetes Reliability
Cluster hardening, multi-zone deployments, HPA, PDB, progressive delivery with ArgoCD
Disaster Recovery
RTO/RPO design, backup strategies, DR drill facilitation, multi-region failover
IT Audit
Infrastructure and reliability maturity assessment with actionable improvement roadmap
Get a Free Reliability Consultation →
View Client Case Studies
The stakes are high. According to Gartner, the average cost of IT downtime is $5,600 per minute —that’s more than $300,000 per hour. For customer-facing platforms, each moment of unavailability can result in lost sales, churn, and negative reviews. For internal systems, downtime stalls productivity and decision-making.
This is why reliability is no longer optional. It’s a strategic necessity.
Conclusion
Software reliability is a complex but essential aspect of modern software systems. It requires a deep understanding of the software's design, the environment in which it operates, and the expectations of its users. By focusing on design perfection, setting clear reliability objectives, and leveraging the practices of Site Reliability Engineering, organizations can build and maintain systems that are not only functional but also reliable.
Ready to enhance your system’s reliability?Partner with Gart to design, build, and maintain a robust digital solution that meets your business needs. Our experts are here to guide you through every step of the process, ensuring your software operates flawlessly and efficiently.Learn more from our cases.
Get a Free Software Reliability ConsultationWhether you're launching or scaling, our SRE experts will build a plan to help your product stay fast, reliable, and secure.
Roman Burdiuzha
Co-founder & CTO, Gart Solutions · Cloud Architecture Expert
Roman has 15+ years of experience in DevOps and cloud architecture, with prior leadership roles at SoftServe and lifecell Ukraine. He co-founded Gart Solutions, where he leads cloud transformation and infrastructure modernization engagements across Europe and North America. In one recent client engagement, Gart reduced infrastructure waste by 38% through consolidating idle resources and introducing usage-aware automation. Read more on Startup Weekly.
Is your software ready for growth, or will it crumble under pressure?
Businesses are under immense pressure to innovate and grow. While technology is the backbone of these advancements, understanding its intricacies can be a daunting task for non-technical business owners. This is especially true when it comes to complex concepts like scalability.
Scalability is the ability of a system to handle increasing workloads and user demands. Without it, businesses risk experiencing slow performance, system crashes, and ultimately, lost customers. It's the difference between a website that can handle a sudden surge in traffic during a holiday sale and one that crashes under the pressure.
This is where the disciplines of DevOps and Site Reliability Engineering (SRE) come into play. These complementary practices, which have gained significant traction in the tech industry, offer a roadmap for ensuring the scalability and resilience of your digital projects without sacrificing reliability.
This guide dives into how scaling delivers business ROI, the practices that make it possible, and the strategic partnership Gart Solutions provides.
Understanding Scalability
Pilots are easy, but scaling up is hard
Scalability is simply the ability of a system to grow and handle increased demand. Imagine a small restaurant that becomes incredibly popular. If it can't expand its kitchen or seating, it will struggle to serve more customers. A scalable restaurant, on the other hand, can adjust its operations to accommodate the growing crowd.
The consequences of poor scalability can be dire for your business. Imagine your company's website grinding to a halt during a major marketing campaign, frustrating potential customers and causing them to abandon their shopping carts or search for your competitors. Or consider the impact of a critical business application crashing under the strain of increased usage, leading to lost productivity, missed deadlines, and dissatisfied clients.
The consequences of poor scalability extend beyond lost customers and revenue. A system that can't handle increased demand can damage a company's reputation. Major online retailers like Amazon or ticket sales platforms have invested heavily in scalability to prevent these issues during peak shopping periods. They understand that a seamless customer experience is crucial to their success.
Scaling for Success: The Proven Path to Revenue Growth and Cost Savings
Recent research from the Boston Consulting Group (BCG) has shed light on the tangible business benefits of scaling digital solutions. The study, which covered approximately 2,000 global companies, found that scaling individual digital solutions can generate revenue increases of 9% to 25% and cost savings of 8% to 28% compared to the relevant baseline (see Exhibits 2 and 3).
But the real game-changer emerges when companies scale several digital solutions across the enterprise. In these cases, the research indicates that organizations can achieve an enterprise-wide revenue increase of almost 17%, along with a 17% reduction in costs.
Individual digital solutions saw 9–25% revenue growth and 8–28% cost savings
Enterprise-wide scaling resulted in ~17% revenue increase and ~17% cost reduction.
The advantages of scaling digital solutions extend beyond just the financial bottom line. Businesses that successfully scale their digital capabilities also experience qualitative benefits, such as:
Reimagined customer experiences that drive loyalty and satisfaction
Greater ability to integrate digital and data ecosystems for competitive advantage
Stronger business resilience and adaptability to market changes
More inclusive and diverse workplaces that foster innovation
Get a sample of IT Audit
Sign up now
Get on email
Loading...
Thank you!
You have successfully joined our subscriber list.
How DevOps and SRE Practices Enable Scalability
It's a valid question, and one that deserves a clear, practical explanation. Let's dive in and explore the key ways these complementary disciplines can future-proof your technology investments.
Automation
One of the core principles of DevOps is the automation of repetitive tasks, such as software deployment, infrastructure provisioning, and testing. By automating these processes, you can significantly reduce the time and effort required to scale your project. Imagine being able to spin up new servers or deploy the latest version of your application with just a few clicks – that's the power of DevOps automation.
Infrastructure as Code (IaC)
DevOps and SRE emphasize the use of IaC, where your infrastructure is defined and managed using code, rather than manual, error-prone processes. This approach makes it much easier to replicate and scale your infrastructure as your business grows. It's like having a digital blueprint that you can use to quickly and consistently build out new environments.
Continuous Integration and Continuous Deployment (CI/CD)
DevOps practices like CI/CD help to automate the entire build, test, and deployment pipeline. This means that changes to your codebase can be quickly and reliably rolled out to production, supporting faster iterations and scalability. Imagine being able to launch new features or updates without the risk of lengthy downtime or service disruptions.
Monitoring and Observability
SRE places a strong emphasis on monitoring and observability, which are essential for understanding the health and performance of your digital systems. By implementing robust monitoring tools and practices, you can quickly identify bottlenecks, performance issues, and other problems that may arise as you scale your project. This allows you to address challenges proactively, rather than waiting for your customers to experience the impact.
Read more: Monitoring DevOps: Types, Practices, and Tools
Scalable Architecture
DevOps and SRE encourage the adoption of scalable architectural patterns, such as microservices, serverless, and cloud-native approaches. These modern architectural styles make it much easier to scale individual components of your project independently, rather than having to scale the entire system at once. It's like building with Lego blocks – you can add or remove pieces as needed without disrupting the whole structure.
Read more: Cloud Scalability: Horizontal vs. Vertical Scaling of IT Infrastructures
Capacity Planning
SRE practices include proactive capacity planning, where you continuously monitor and forecast the resource requirements of your system. This allows you to scale your infrastructure and resources ahead of time, avoiding sudden spikes in demand that could cause performance issues or service disruptions.
Incident Response and Resilience
DevOps and SRE focus on building resilient systems that can withstand failures and recover quickly. This includes implementing practices like chaos engineering, incident response, and self-healing mechanisms. By making your digital solutions more robust and reliable, you can ensure that they continue to function smoothly even as you scale to meet growing demands.
DevOps vs. SRE: Complementary Strengths for Scaling
AspectDevOpsSREApproachCulture + automation toolsReliability engineering with metricsScalability EnablementCI/CD, IaCCapacity planning, error budgets, resiliencyGoalFast, consistent releasesReliable operation during growthFocusDevelopment process optimizationSystem availability and error management
By adopting these DevOps and SRE practices, you can unlock the true scalability of your digital projects, empowering your business to adapt and thrive in the face of changing market conditions and customer needs. It's a strategic investment that will pay dividends for years to come.
Key considerations for scalability:
Vertical scaling: Increasing resources of existing hardware (e.g., CPU, RAM).
Horizontal scaling: Adding more servers or instances to distribute the load.
Load balancing: Distributing incoming traffic across multiple servers.
Caching: Storing frequently accessed data for faster retrieval.
Database optimization: Improving database performance to handle increased data volume.
Cloud computing: Leveraging elastic resources for on-demand scalability.
Understanding your business needs is the first step. What challenges are you facing? Are you looking to accelerate development, improve system reliability, or optimize costs? Having a clear picture of your requirements will help you find a partner that aligns with your objectives.
The capacity to scale your digital solutions is no longer a nice-to-have – it's a strategic imperative. The companies that master this art will be well-positioned to outpace the competition, capitalize on growth opportunities, and future-proof their success.
The choice is clear: you can continue to rely on outdated, manually intensive processes that put your business at risk of performance issues, service disruptions, and lost revenue, or you can invest in the proven practices that will transform your digital operations and position your company for sustainable growth.
How Gart Solutions Drives Scalable Performance
Gart combines consulting and hands-on delivery across:
Automation services: IaC with Terraform, CI/CD pipelines
Observability platforms: Prometheus, Grafana, CloudWatch setups
Architecture design: Microservices, container orchestration (ECS/EKS)
Capacity forecasting: Scaling planning, cloud resource optimization
Incident readiness: Auto‑remediation, runbook development, SRE coaching
Scale your business without limits. Contact Gart today.