Compliance Monitoring is the ongoing process of verifying that an organization's systems, processes, and people continuously adhere to regulatory requirements, internal policies, and industry standards — not just at audit time, but every day. For cloud-native and regulated businesses in 2026, it is the difference between a clean audit and a costly breach.
What is Compliance Monitoring?
Compliance monitoring is the systematic, continuous practice of evaluating whether an organization's operations, systems, and people conform to the laws, regulations, and internal standards that govern them. Unlike a one-time audit, compliance monitoring runs as an always-on feedback loop — collecting evidence, flagging exceptions, and enabling rapid remediation before regulators ever knock on the door.
The practice is critical across heavily regulated industries:
Healthcare — HIPAA, HITECH, 21 CFR Part 11
Finance & Banking — PCI DSS, SOX, Basel III, MiFID II
Cloud & SaaS — SOC 2, ISO 27001, CSA CCM
EU-regulated entities — GDPR, NIS2, DORA
Energy & Utilities — NERC CIP, ISO 50001
Pharmaceuticals — GxP, FDA 21 CFR
💡 In short: Compliance monitoring is your organization's immune system. Audits are the annual check-up. Monitoring is what keeps you healthy between check-ups.
Why Compliance Monitoring Matters in 2026
Regulatory landscapes have never moved faster. GDPR fines reached record highs in 2024–2025, NIS2 entered enforcement mode across the EU, and DORA (Digital Operational Resilience Act) took effect for financial entities. Meanwhile, cloud adoption has created entirely new attack surfaces that traditional point-in-time audits simply cannot cover.
Risk Without MonitoringTypical Business ImpactProbability (unmonitored)Undetected misconfigured S3 bucket / cloud storageData breach, regulatory fine, brand damageHighStale privileged access not reviewedInsider threat, audit failure, SOX violationVery HighMissing audit log retentionInability to prove compliance, automatic audit failureHighBackup not testedUnrecoverable data loss, SLA breach, recovery failureMediumUnpatched critical CVE beyond SLAExploitable vulnerability, CVSS breach, PCI non-complianceHighWhy Compliance Monitoring Matters in 2026
Strong compliance monitoring builds trust with enterprise clients and partners, significantly reduces audit preparation time, and enables a proactive risk posture instead of a reactive, fire-fighting one.
Compliance Monitoring vs Compliance Audit vs Compliance Management
These three terms are often used interchangeably but they describe distinct activities that work together. Understanding the difference helps organizations allocate resources correctly.
DimensionCompliance MonitoringCompliance AuditCompliance ManagementFrequencyContinuous / near-real-timePeriodic (annual, quarterly)Ongoing governancePurposeDetect & alert on deviationsFormal independent assessmentPolicies, training, cultureOutputAlerts, dashboards, exception logsAudit report, findings, attestationPolicies, procedures, risk registerWho leadsEngineering / Security / DevOpsInternal audit / Third-party auditorCompliance Officer / GRC teamAnalogyBlood pressure cuff worn dailyAnnual physical with doctorHealthy lifestyle programCompliance Monitoring vs Compliance Audit vs Compliance Management
✅ Monitoring answers
Is MFA enforced right now?
Are all logs being retained?
Did anything change in IAM this week?
Are backups completing successfully?
Is encryption enabled on all storage?
📋 Auditing answers
Were controls effective over the period?
Did evidence satisfy the framework?
What is the organization's control maturity?
What formal findings require remediation?
Is the organization SOC 2 / ISO 27001 ready?
Explore our Compliance Audit services
The 7-Step Compliance Monitoring Process
Effective compliance monitoring is not a single tool or dashboard — it's a disciplined cycle. Here is the process Gart uses when setting up or maturing a client's compliance monitoring program:
1. Define Scope & Applicable Frameworks
Identify which regulations, standards, and internal policies apply. Map your systems, data flows, and third-party integrations to determine the monitoring perimeter. Ambiguous scope is the most common reason monitoring programs fail.
2. Inventory Systems & Controls
Catalogue all assets (cloud, on-prem, SaaS, CI/CD pipelines) and map each one to a control objective. Assign control owners. Without ownership, no one acts when an exception fires.
3. Define Evidence Collection Rules
For each control, specify what constitutes "evidence of compliance" — a log entry, a configuration state, a test result, a screenshot, or a signed document. Define collection frequency (real-time, daily, monthly) and acceptable format for auditors.
4. Instrument & Automate Collection
Deploy monitoring agents, SIEM rules, cloud policy engines (AWS Config, Azure Policy, GCP Security Command Center), and IaC scanning tools. Automate evidence collection wherever possible — manual evidence gathering at audit time is a costly, error-prone anti-pattern.
5. Monitor Exceptions & Triage Alerts
Create alert thresholds for control deviations. Not every alert is a breach — build a triage process that separates noise from genuine risk. Route high-priority exceptions to security/engineering immediately; lower-priority items to a weekly review queue.
6. Prioritize Risks & Remediate
Score exceptions by likelihood and impact. Maintain a risk register that tracks open findings, owners, and target remediation dates. Escalate unresolved critical findings to leadership with a clear business-impact framing.
7. Re-test, Report & Continuously Improve
After remediation, re-test the control to confirm it is effective. Produce compliance health reports for leadership and auditors. Run a quarterly retrospective to tune alert thresholds and update monitoring scope as regulations and infrastructure evolve.
Key Controls & Evidence to Monitor
Across hundreds of compliance engagements, the controls below consistently appear on auditor checklists. These are the areas where automated compliance monitoring delivers the highest return:
Control AreaWhat to MonitorEvidence Auditors WantRelevant FrameworksIdentity & Access (IAM)Privileged role assignments, inactive accounts, MFA status, service account permissionsAccess review logs, MFA adoption rate, least-privilege config exportsSOC 2, ISO 27001, HIPAAAudit LoggingLog completeness, retention period, tamper-evidence, SIEM ingestion healthLog retention policy, SIEM dashboard, CloudTrail / Audit Log exportsPCI DSS, SOX, NIS2, GDPREncryptionData-at-rest encryption on storage, TLS version on endpoints, key rotation schedulesEncryption config exports, key management audit logs, TLS scan reportsPCI DSS, HIPAA, GDPR, ISO 27001Patch ManagementCVE scan results, SLA adherence per severity, open critical/high vulnerabilitiesScan reports, patch cadence logs, SLA compliance metricsSOC 2, PCI DSS, ISO 27001Backup & RecoveryBackup job success rate, RPO/RTO test results, offsite replication statusBackup logs, recovery test records, DR test reportsSOC 2, ISO 22301, DORA, NIS2Vendor / Third-Party AccessActive vendor sessions, access scope, contract/NDA currency, SOC 2 report datesVendor access logs, contract register, third-party risk assessmentsISO 27001, SOC 2, GDPR, NIS2Network & PerimeterFirewall rule changes, open ports, egress filtering, WAF alert volumesFirewall config snapshots, IDS/IPS logs, pen test reportsPCI DSS, SOC 2, NIS2Incident ResponseMean time to detect (MTTD), mean time to respond (MTTR), breach notification timelinesIncident logs, CSIRT reports, post-mortemsGDPR (72h), NIS2, HIPAA, DORAKey Controls & Evidence to Monitor
Continuous Compliance Monitoring for Cloud Environments
Cloud infrastructure changes constantly — teams spin up resources, update IAM policies, and deploy code multiple times per day. This makes continuous compliance monitoring not a nice-to-have but a fundamental requirement. Manual checks against cloud state are obsolete before the ink dries.
AWS Compliance Monitoring — Key Automated Checks
AWS Config Rules — detect non-compliant resources in real time (e.g., unencrypted EBS volumes, public S3 buckets, missing CloudTrail)
AWS Security Hub — aggregates findings from GuardDuty, Inspector, Macie into a single compliance posture score
CloudTrail + Athena — query audit logs for unauthorized IAM changes, API calls outside approved regions
IAM Access Analyzer — surfaces external access to resources and unused roles/permissions
Azure Compliance Monitoring — Key Automated Checks
Azure Policy & Defender for Cloud — enforce and score compliance against CIS, NIST SP 800-53, ISO 27001 benchmarks
Microsoft Purview — data classification, governance, and audit trail across Azure and M365
Azure Monitor + Sentinel — SIEM-class alerting on suspicious activity with compliance-relevant playbooks
Privileged Identity Management (PIM) — just-in-time access with mandatory justification and approval workflows
GCP Compliance Monitoring — Key Automated Checks
Security Command Center — organization-wide misconfiguration detection and compliance benchmarking
VPC Service Controls — perimeter security policies that prevent data exfiltration
Cloud Audit Logs — immutable, per-service activity and data access logs
Policy Intelligence — recommends IAM role right-sizing based on actual usage data
🔗
For authoritative cloud security benchmarks, the CIS Benchmarks provide configuration baselines for AWS, Azure, GCP, Kubernetes, and 100+ other platforms — an industry-standard starting point for any cloud compliance monitoring program.
See Gart's Cloud Computing & Security services
Industry-Specific Compliance Monitoring Frameworks
Compliance monitoring requirements differ significantly by industry and geography. Below are the frameworks Gart's clients most commonly monitor against, along with the controls that require continuous (not just periodic) monitoring.
FrameworkIndustry / RegionKey Continuous Monitoring RequirementsResourcesISO 27001Global / All industriesAccess control review, log management, vulnerability scanning, supplier reviewISO.orgSOC 2 Type IISaaS / TechnologyContinuous availability, logical access, change management, incident responseAICPAHIPAAHealthcare (US)ePHI access logs, encryption at rest/transit, workforce activity auditsHHS.govPCI DSS v4.0Payment / E-commerceReal-time network monitoring, file integrity monitoring, quarterly vulnerability scansPCI SSCNIS2EU / Critical sectorsIncident detection within 24h, risk assessments, supply chain security checksENISAGDPREU / Global processing EU dataData subject request tracking, breach detection (<72h notification), processor auditsGDPR.euIndustry-Specific Compliance Monitoring Frameworks
How to prepare for a HIPAA Audit - Gart's PCI DSS Audit guide
First-Hand Experience
What We Usually Find During Compliance Monitoring Reviews
After reviewing postures across dozens of regulated environments, these are the patterns we encounter repeatedly — regardless of organization size.
👥
Incomplete or stale access reviews
Former employees and service accounts with active permissions weeks after departure. IAM hygiene is rarely automated, and reviews are often rubber-stamped.
📋
Missing backup test evidence
Backups appear healthy, but nobody has tested a restore in 6–18 months. Auditors want dated restore test logs with RPO/RTO outcomes, not just success metrics.
📊
Fragmented or incomplete audit logs
Gaps in the log chain (like disabled S3 data-event logging) make it impossible to reconstruct an incident or prove that one didn't happen.
🔔
Alert fatigue masking real issues
Thousands of low-fidelity alerts lead teams to mute notifications or build exceptions, inadvertently disabling detection for real threats.
📄
Policy-to-implementation gaps
Written policies say "encryption required," but reality reveals unencrypted legacy buckets. Continuous monitoring is the only way to detect this drift.
🔧
Automation is first patched, last monitored
CI/CD pipelines move faster than human reviewers. IaC repositories often lack policy-as-code scanning, leaving non-compliant resources active for months.
Featured Success Story
Case study: ISO 27001 compliance for Spiral Technology
→
Compliance Monitoring Tools & Automation
The right tooling depends on your stack, frameworks, and team maturity. Most organizations use a layered approach rather than a single platform:
CategoryRepresentative ToolsBest ForCloud Security Posture Management (CSPM)AWS Security Hub, Wiz, Prisma Cloud, Orca Security, Defender for CloudCloud misconfiguration detection, continuous benchmarkingSIEM / Log ManagementSplunk, Elastic SIEM, Microsoft Sentinel, Datadog SecurityLog correlation, anomaly detection, audit evidenceGRC PlatformsVanta, Drata, Secureframe, ServiceNow GRC, OneTrustEvidence collection automation, audit-ready reportingPolicy-as-Code / IaC ScanningOpen Policy Agent (OPA), Checkov, Terrascan, tfsec, ConftestPrevent non-compliant infrastructure from being deployedVulnerability ManagementTenable Nessus, Qualys, AWS Inspector, Trivy (containers)CVE detection, patch SLA monitoring, container scanningIdentity GovernanceSailPoint, CyberArk, Azure PIM, AWS IAM Access AnalyzerAccess reviews, least-privilege enforcement, PAM
⚠️ Tool sprawl is a compliance risk: More tools mean more integrations to maintain, more alert queues to manage, and more places where evidence can fall through the cracks. Start with native cloud tools and expand deliberately. The Linux Foundation and CNCF maintain open-source compliance tooling for cloud-native environments worth evaluating before adding commercial licenses.
Compliance Monitoring Best Practices
1. Shift compliance left into the development pipeline
The cheapest time to catch a compliance violation is before the resource is deployed. Integrate policy-as-code scanning (OPA, Checkov) into your CI/CD pipeline so that non-compliant Terraform or Helm charts never reach production. Treat compliance failures as build-breaking errors, not post-deploy recommendations.
2. Automate evidence collection — not just detection
Detection without evidence collection is useless at audit time. Configure your monitoring tools to export and archive compliance evidence (configuration snapshots, access review logs, scan reports) automatically to an immutable store. Auditors need evidence from a defined period — not a screenshot taken the morning of the audit.
3. Assign control owners, not just tool owners
Every control needs a named human owner who is accountable for exceptions. When an alert fires that MFA is disabled on a privileged account, "the security team" is not a sufficient owner — a specific person must be on call to investigate and remediate within the SLA.
4. Tune alerts ruthlessly to eliminate fatigue
Compliance monitoring programs that generate thousands of daily alerts quickly become ignored. Start with a small set of high-fidelity, high-impact alerts. Expand incrementally after each is tuned to near-zero false positive rates. A team that responds to 20 real alerts per day is more secure than one drowning in 2,000 noisy ones.
5. Monitor your monitoring
Monitoring pipelines break silently. Log shippers stop, API rate limits are hit, SIEM ingestion queues fill up. Build meta-monitoring to detect when evidence collection or alerting pipelines have gaps — and treat those gaps as compliance findings in their own right.
6. Conduct a quarterly compliance posture review
Beyond continuous automated monitoring, schedule a quarterly human review of the compliance posture. Review open exceptions, re-assess risk scores, retire obsolete controls, and update monitoring scope to cover new systems and regulatory changes.
Compliance Monitoring Checklist for Cloud Teams
A starting point for cloud-first compliance. Each item requires a named owner, a monitoring cadence, and a defined evidence artifact.
✓
MFA enforced on all privileged and administrative accounts
✓
Access reviews completed for all privileged roles (minimum quarterly)
✓
Service accounts audited for least-privilege and no unused permissions
✓
Audit logging enabled and retained (90 days min; 1 year for PCI/HIPAA)
✓
SIEM ingestion health monitored — no silent log gaps
✓
Data-at-rest encryption confirmed on all storage (S3, RDS, EBS, blobs)
✓
TLS 1.2+ enforced; TLS 1.0/1.1 disabled on all endpoints
✓
Encryption key rotation scheduled and verified
✓
Vulnerability scans run weekly; critical/high CVEs remediated within SLA
✓
Patch management SLA compliance tracked and reported
✓
Backups verified complete daily; restore tests documented quarterly
✓
DR test completed at least annually; RPO/RTO outcomes logged
✓
No public cloud storage buckets without explicit business justification
✓
Firewall change log reviewed; unauthorized rule changes alerting
✓
Vendor/third-party access scoped, time-limited, and reviewed quarterly
✓
Incident response plan tested; MTTD and MTTR tracked
✓
Policy-as-code scans integrated into CI/CD pipelines
✓
Compliance evidence archived in immutable storage for audit period
✓
Monitoring pipeline health checked — no silent collection failures
✓
Quarterly posture review conducted with named control owners
Gart Solutions · Compliance Monitoring Services
How Gart Helps You Build a Continuous Compliance Monitoring Program
We work with CTOs, CISOs, and engineering leaders to design, implement, and run compliance monitoring programs that hold up under real auditor scrutiny — not just on paper.
🗺️
Scope & Framework Mapping
We identify applicable frameworks (ISO 27001, SOC 2, HIPAA, PCI DSS, NIS2, GDPR) and map your cloud infrastructure to each control objective.
🔧
Monitoring Setup & Automation
We deploy CSPM tools, SIEM rules, and policy-as-code pipelines — so evidence is collected automatically, not manually on audit day.
📊
Gap Analysis & Risk Register
We deliver a clear view of your current compliance posture, prioritized by risk, with a remediation roadmap and accountable owners.
🔄
Ongoing Reviews & Readiness
Monthly exception reviews and pre-audit evidence packages — so you're never scrambling the week before an official audit.
☁️
Cloud-Native Expertise
AWS, Azure, GCP, Kubernetes, and CI/CD. We speak infrastructure as code and translate compliance into DevOps workflows.
📋
Audit-Ready Deliverables
Exception logs, risk matrices, and control evidence archives. Everything formatted for the specific framework you're being audited against.
Get a Compliance Audit
Talk to an Expert
Fedir Kompaniiets
Co-founder & CEO, Gart Solutions · Cloud Architect & DevOps Consultant
Fedir is a technology enthusiast with over a decade of diverse industry experience. He co-founded Gart Solutions to address complex tech challenges related to Digital Transformation, helping businesses focus on what matters most — scaling. Fedir is committed to driving sustainable IT transformation, helping SMBs innovate, plan future growth, and navigate the "tech madness" through expert DevOps and Cloud managed services. Connect on LinkedIn.
IT infrastructure monitoring is the continuous collection and analysis of performance data — from servers and networks to cloud services and applications — to prevent downtime, reduce costs, and maintain reliability. This guide covers what to monitor, the six major types, a tool comparison table, implementation best practices, and a checklist to get started today.
In today's digital economy, businesses live and die by the reliability of their IT systems. A single hour of unplanned downtime now costs enterprises an average of $300,000, according to research cited by Gartner. Yet many organizations still operate with incomplete visibility into their IT infrastructure — reacting to outages instead of preventing them.
IT infrastructure monitoring closes that gap. It gives engineering teams the real-time intelligence to act before issues become incidents, optimize costs, and build systems that meet the reliability expectations of modern software.
In this guide — built on hands-on experience from hundreds of Gart infrastructure engagements — we cover everything: from the foundational definition and architecture to tools, types, best practices, and a practical implementation checklist.
What Is IT Infrastructure Monitoring?
IT infrastructure monitoring is the systematic process of continuously collecting, analyzing, and acting on telemetry data from every component of an organization's technology environment — including physical servers, virtual machines, containers, cloud services, databases, and network devices — to ensure optimal performance, availability, and security.
Unlike reactive incident response, IT infrastructure monitoring is inherently proactive. Monitoring agents deployed across the environment stream metrics, logs, and traces to a central platform, where anomaly detection and threshold-based alerting surface problems before they impact users.
Why it matters now: Modern software is distributed, cloud-native, and updated continuously. A monolith deployed once a quarter could survive without formal monitoring. A microservices platform deployed dozens of times a day cannot. IT infrastructure monitoring is the operational nervous system that keeps that environment coherent.
The discipline sits at the intersection of three related practices that are often confused:
ConceptCore QuestionPrimary OutputIT Infrastructure MonitoringIs the system healthy right now?Dashboards, alerts, uptime metricsObservabilityWhy is the system behaving this way?Distributed traces, structured logs, high-cardinality metricsSREWhat is our acceptable failure level?SLOs, error budgets, runbooksWhat Is IT Infrastructure Monitoring?
A mature organization needs all three working in concert. The Cloud Native Computing Foundation (CNCF) provides a useful open-source landscape for understanding how these disciplines intersect with tool selection.
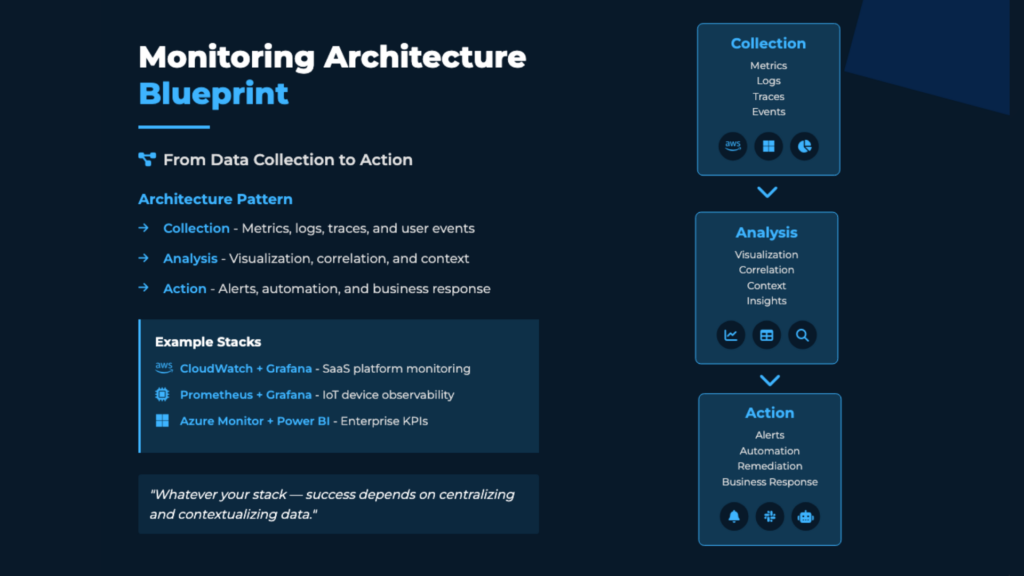
How IT Infrastructure Monitoring Works: Architecture Overview
At its core, IT infrastructure monitoring follows a four-layer architecture: data collection, aggregation, analysis, and action. Here is how these layers interact in a modern cloud-native environment.
IT Infrastructure Monitoring — Architecture
1. COLLECTION
Agents, exporters, and instrumentation libraries gather metrics, logs, and traces from every infrastructure component in real time.
2. TRANSPORT
Telemetry is shipped to a central aggregator — via pull (Prometheus) or push (agents streaming to Datadog, Loki, etc.).
3. STORAGE & ANALYSIS
Time-series databases (Prometheus, VictoriaMetrics) store metrics. Log platforms (Loki, Elasticsearch) index events. Trace backends (Tempo, Jaeger) correlate distributed requests.
4. ALERTING & ACTION
Rule-based and SLO-driven alerts route to PagerDuty or Slack. Dashboards surface patterns. Runbooks guide remediation.
The most important design principle: correlation across all three telemetry types. When an alert fires, engineers must be able to jump from the metric spike to the relevant logs and the distributed trace for the same time window — in seconds, not minutes. Tools like Grafana, Datadog, and Dynatrace increasingly make this three-way correlation a single click.
Google's Four Golden Signals framework — Latency, Traffic, Errors, and Saturation — remains the most practical starting point for deciding what to collect and how to alert on it.
74% of enterprises report IT downtime costs exceed $100k per hour (Gartner)
74%
of enterprises report IT downtime costs exceed $100k per hour (Gartner)
4×
faster Mean Time to Detect achieved with centralized monitoring vs. siloed alerts
38%
infrastructure cost reduction Gart achieved for one client via usage-aware automation
Ready to level up your Infrastructure Management? Contact us today and let our experienced team empower your organization with streamlined processes, automation, and continuous integration.
Types of IT Infrastructure Monitoring
Effective IT infrastructure monitoring spans multiple layers. Missing any layer creates blind spots that surface as incidents. These are the six essential types every engineering organization should cover.
🖥️
Server & Host Monitoring
Tracks CPU, memory, disk I/O, and process health on physical and virtual servers. The foundational layer for any monitoring program.
🌐
Network Monitoring
Monitors latency, packet loss, bandwidth utilization, and throughput across switches, routers, and VPNs. Critical for diagnosing connectivity-related incidents.
☁️
Cloud Infrastructure Monitoring
Provides visibility into AWS, Azure, and GCP resources — EC2 instances, managed databases, load balancers, and serverless functions.
📦
Container & Kubernetes Monitoring
Tracks pod restarts, OOMKill events, HPA scaling, and control plane health. The standard stack: kube-state-metrics + Prometheus + Grafana.
⚡
Application Performance Monitoring (APM)
Focuses on runtime application behavior: response times, error rates, database query performance, and memory leaks.
🔒
Security Monitoring
Detects anomalies in authentication events, network traffic, and container runtime behavior using tools like Falco for threat detection.
For teams with cloud-native environments, the Linux Foundation and its CNCF project maintain an extensive open-source ecosystem covering each of these layers — useful for evaluating vendor-neutral tooling options.
What Should You Monitor? Key Metrics by Layer
Identifying the right metrics is more important than collecting everything. Cardinality explosions and alert fatigue are common consequences of monitoring too broadly without structure. The table below maps infrastructure layer to the most important metric categories, grounded in the Google SRE Golden Signals and the USE method (Utilization, Saturation, Errors).
Infrastructure LayerKey Metrics to TrackAlerting PriorityServers / HostsCPU utilization, memory usage, disk I/O, network throughput, process healthHighNetworkLatency, packet loss, bandwidth usage, throughput, BGP statusHighApplicationsResponse time (p95/p99), error rates, request throughput, transaction volumeCriticalDatabasesQuery response time, connection pool usage, replication lag, slow queriesHighKubernetes / ContainersPod restarts, OOMKill events, HPA scaling, node pressure, ingress 5xx rateCriticalCloud CostCost per service, idle resource spend, reserved instance utilizationMediumSecurityFailed logins, unauthorized access attempts, anomalous network traffic, CVE alertsCritical
Practical advice from Gart audits: Most teams monitor what is easy to collect — CPU and memory — but leave deployment failure rates and user-facing latency untracked. Always start from the user experience and work inward toward infrastructure. If a metric does not map to a business outcome, question whether it needs an alert.
IT Infrastructure Monitoring Tools Comparison (2026)
Choosing the right monitoring tool depends on your team's size, cloud footprint, budget, and maturity stage. Below is a concise comparison of the most widely adopted platforms, based on Gart's hands-on implementation experience and public vendor documentation.
ToolBest ForPricingKey StrengthsMain LimitationsPrometheusMetrics collection, Kubernetes environmentsFree / OSSPull-based, powerful PromQL query language, massive ecosystemNo long-term storage natively; high cardinality causes performance issuesGrafanaVisualization & dashboardsFreemiumMulti-source dashboards, rich plugin library, Grafana Cloud optionDashboard sprawl without governance; alerting UX not always intuitiveDatadogFull-stack observability, enterprisePer host/GBBest-in-class UX, unified metrics/logs/traces/APM, AI featuresExpensive at scale; bill shock without governance; vendor lock-in riskNagiosNetwork & host checks, legacy environmentsFreemiumHighly extensible plugin architecture, battle-tested for 20+ yearsDated UI; complex config for large deployments; limited cloud-native supportZabbixBroad infrastructure coverage, on-premisesFree / OSSRich auto-discovery, custom alerting, strong communitySteeper learning curve; resource-intensive at scale; UI can overwhelmNew RelicAPM & user monitoringPer user/usageDeep transaction tracing, browser/mobile RUM, synthetic monitoringPricing model shift makes cost unpredictable; can be costly for large teamsDynatraceEnterprise AI-driven monitoringPer host / DEM unitAI root cause analysis (Davis), auto-discovery, full-stack, cloud-nativePremium pricing, complex licensing, steep onboarding curveGrafana LokiLog aggregation, cost-conscious teamsFreemiumLabel-based indexing makes it very cost-efficient; integrates natively with GrafanaFull-text search slower than Elasticsearch; less mature than ELK
For most cloud-native teams starting out, a Prometheus + Grafana + Loki + Tempo stack provides comprehensive coverage at near-zero licensing cost. As you scale or need enterprise SLAs, Datadog or Dynatrace become serious options — but budget accordingly and implement cost governance from day one.
The Platform Engineering community has produced a useful comparison of open-source and commercial observability stacks that is worth reviewing when evaluating options for multi-team environments.
IT Infrastructure Monitoring Best Practices
Based on Gart infrastructure audits across SaaS platforms, healthcare systems, fintech products, and Kubernetes-native environments, these are the practices that separate mature monitoring programs from those that generate noise without insight.
1. Define monitoring requirements during sprint planning — not after deployment
Observability is a feature, not an afterthought. Every new service should ship with a defined set of SLIs (Service Level Indicators), dashboards, and alert runbooks. If a team cannot describe what "healthy" looks like for a service, it is not ready for production.
2. Use structured alerting frameworks — not static thresholds
Alerting on "CPU > 80%" generates noise during every traffic spike. SLO-based alerting, built on error budget burn rates, is dramatically more actionable. An alert that fires because "we will exhaust the monthly error budget in 24 hours" gives teams time to act before users are impacted. AWS, Google Cloud, and Azure all provide native guidance on monitoring best practices aligned with this approach.
3. Deploy monitoring agents across your entire environment — not just key apps
Partial coverage creates blind spots. Deploy collection agents — whether node_exporter, the Google Ops Agent, or AWS Systems Manager — across the full production environment. A host that falls outside the monitoring perimeter will be the one that causes your next incident.
4. Instrument with OpenTelemetry from day one
Using a vendor-proprietary instrumentation agent locks you to that vendor's backend. OpenTelemetry provides a single SDK that exports metrics, logs, and traces to any compatible backend — Prometheus, Datadog, Jaeger, Grafana Tempo, or others. It is the de facto instrumentation standard endorsed by the CNCF and increasingly the only approach that makes long-term sense.
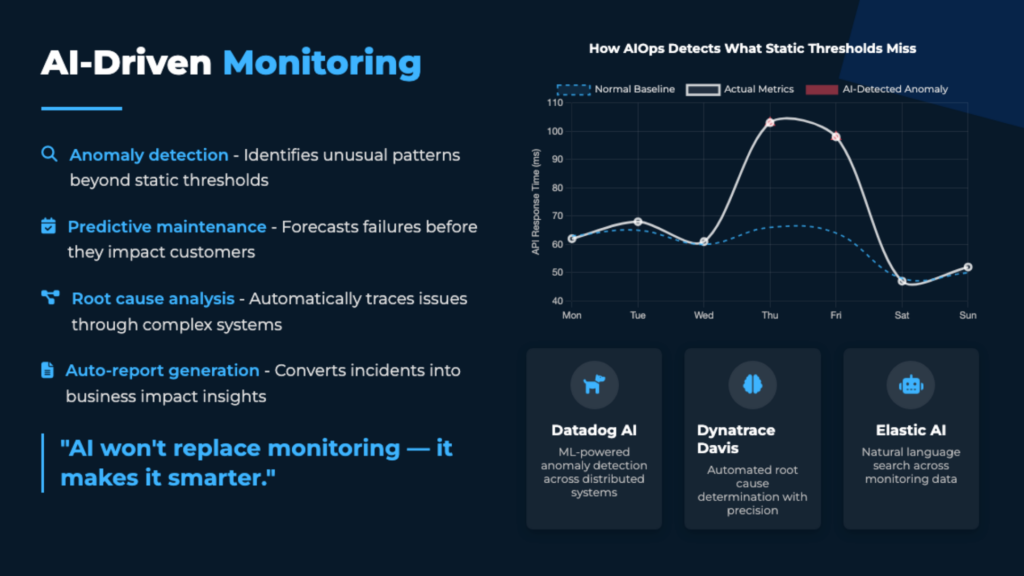
5. Automate: adopt AIOps for infrastructure monitoring
Modern IT infrastructure monitoring tools offer AI-powered anomaly detection that learns baseline behavior for every service and surface deviations before thresholds are breached. Platforms like Dynatrace (Davis AI) and Datadog (Watchdog) reduce both Mean Time to Detect and alert fatigue simultaneously. For teams not yet ready for commercial AI tooling, Prometheus anomaly detection via MetricSets and Alertmanager provides a strong open-source baseline.
6. Create filter sets and custom dashboards for each team
A unified platform should still deliver role-specific views. Infrastructure engineers need node-level dashboards. Developers need service-level RED dashboards. Finance teams need cost allocation views. Tools like Grafana and Datadog support this through tag-based filtering and custom dashboard permissions. Organize hosts and workloads by tag from day one — retrofitting tags across an existing environment is painful.
7. Test your monitoring — with chaos engineering
The most common finding in Gart monitoring audits: alerts that are configured but never fire — even when the system is broken. Chaos engineering experiments (Chaos Mesh, Chaos Monkey) validate that dashboards and alerts actually trigger when something breaks. If your monitoring cannot detect a simulated failure, it will not detect a real one. The Green Software Foundation also notes that effective monitoring is foundational to sustainable infrastructure — you cannot optimize what you cannot measure.
8. Review and prune regularly
A dashboard no one opens is a maintenance cost with no return. A monthly review cycle — checking which alerts never fire and which dashboards are never visited — keeps the monitoring program lean and trusted.
Use Cases of IT Infrastructure Monitoring
DevOps engineers, SREs, and platform teams apply IT infrastructure monitoring across four primary operational scenarios:
Troubleshooting performance issues. When a latency spike or error rate increase hits, monitoring tools let engineers immediately identify the failing host, container, or downstream service — without manual log archaeology. Mean Time to Detect drops from hours to minutes when logs, metrics, and traces are correlated on a single platform.
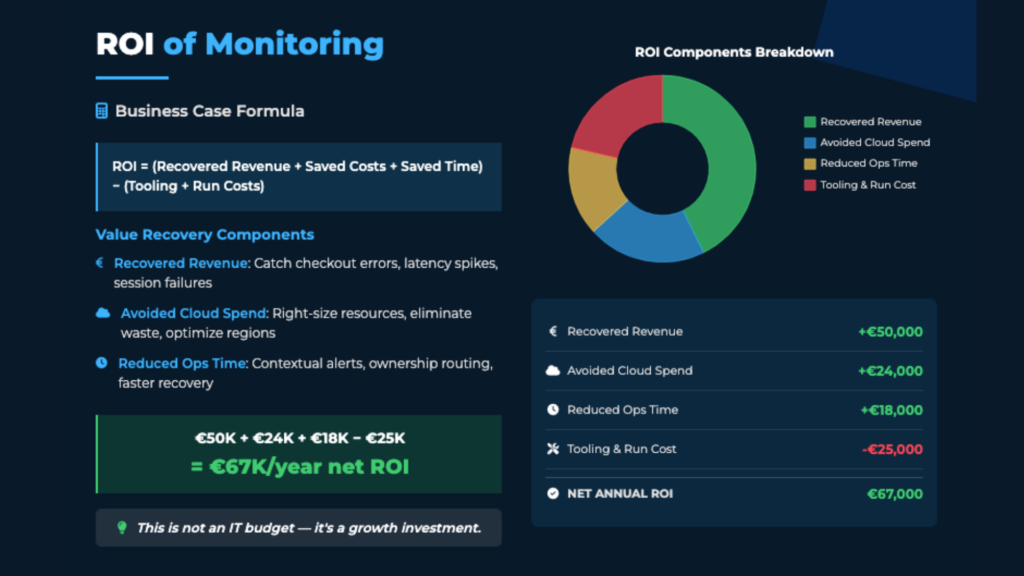
Optimizing infrastructure cost. Historical utilization data surfaces overprovisioned servers, idle EC2 instances, and underutilized database clusters. Organizations consistently find 15–40% of cloud spend is recoverable through monitoring-driven right-sizing. Read how Gart helped an entertainment platform achieve AWS cost optimization through infrastructure visibility.
Forecasting backend capacity. Trend analysis on resource consumption during product launches, seasonal traffic peaks, or user growth allows infrastructure teams to provision ahead of demand — rather than reacting to overloaded nodes during the event.
Configuration assurance testing. Monitoring the infrastructure during and after feature deployments validates that new releases do not degrade existing services. This is the operational backbone of safe continuous delivery.
Ready to level up your Infrastructure Management? Contact us today and let our experienced team empower your organization with streamlined processes, automation, and continuous integration.
Our Monitoring Case Study: Music SaaS Platform at Scale
A B2C SaaS music platform serving millions of concurrent global users needed real-time visibility across a geographically distributed infrastructure spanning three AWS regions. Prior to engaging Gart, the team relied on ad hoc CloudWatch dashboards with no centralized alerting or SLO definitions.
Gart integrated AWS CloudWatch and Grafana to deliver unified dashboards covering regional server performance, database query times, API error rates, and streaming latency per region. We defined SLOs for the five most critical user-facing services and implemented SLO-based burn rate alerting using Prometheus Alertmanager routed to PagerDuty.
"Proactive monitoring alerts eliminated operational interruptions during our global release events. The team now deploys with confidence instead of hoping nothing breaks."— Engineering Lead, Music SaaS Platform (under NDA)
The outcome: Mean Time to Detect dropped from over 20 minutes to under 4 minutes. Infrastructure cost reduced by 22% through identification of overprovisioned regions. See Gart's IT Monitoring Services for details on what this engagement included.
Monitoring Checklist: Where to Start
Distilled highest-impact actions based on patterns observed across Gart’s client audits:
Define SLIs and SLOs for all user-facing services before configuring alerts
Deploy monitoring agents across 100% of production — not just key hosts
Implement Google's Four Golden Signals (Latency, Traffic, Errors, Saturation)
Centralize logs in a structured format (JSON) via Loki or Elasticsearch
Set up distributed tracing with OpenTelemetry before launching new services
Configure SLO-based burn rate alerting to replace pure static thresholds
Create role-specific dashboards (Infra, Dev, Finance) using tag-based filtering
Write a runbook for every alert before enabling it in production
Run a chaos engineering test to verify that alerts fire correctly
Establish a monthly review cycle to prune unused alerts and dashboards
Gart Solutions · Infrastructure Monitoring Services
Is Your Monitoring Stack Actually Working When It Matters?
Most teams discover monitoring gaps during an incident — not before. Gart identifies blind spots and alert fatigue, delivering a concrete remediation roadmap.
🔍
Infrastructure Audit
Observability assessment across AWS, Azure, and GCP.
📐
Architecture Design
Custom monitoring design tailored to your team size and budget.
🛠️
Implementation
Hands-on deployment of Prometheus, Grafana, Loki, and OpenTelemetry.
📊
SLO & DORA Metrics
Error budget alerting and DORA dashboards for performance.
☸️
Kubernetes Monitoring
Full-stack observability for EKS, GKE, and AKS environments.
⚡
Incident Response
Runbook creation and PagerDuty/OpsGenie integration.
Book a Free Assessment
Explore Services →
No commitment required · Free 30-minute discovery call · Rated 4.9/5 on Clutch
Roman Burdiuzha
Co-founder & CTO, Gart Solutions · Cloud Architecture Expert
Roman has 15+ years of experience in DevOps and cloud architecture, with prior leadership roles at SoftServe and lifecell Ukraine. He co-founded Gart Solutions, where he leads cloud transformation and infrastructure modernization engagements across Europe and North America. In one recent client engagement, Gart reduced infrastructure waste by 38% through consolidating idle resources and introducing usage-aware automation. Read more on Startup Weekly.
Wrapping Up
In conclusion, infrastructure monitoring is critical for ensuring the performance and availability of IT infrastructure. By following best practices and partnering with a trusted provider like Gart, organizations can detect issues proactively, optimize performance and be sure the IT infrastructure is 99,9% available, robust, and meets your current and future business needs. Leverage external expertise and unlock the full potential of your IT infrastructure through IT infrastructure outsourcing!
Let’s work together!
See how we can help to overcome your challenges
Contact us
Cybersecurity monitoring — threat detection and response framework
Cybersecurity monitoring is the continuous process of collecting, correlating, and acting on security signals across your entire technology environment. For CTOs and engineering leaders, it is no longer optional: the IBM Cost of a Data Breach 2024 report shows that organisations without mature monitoring take an average of 194 days to identify a breach and a further 64 days to contain it — at an average cost of $4.88 million per incident.
This guide covers everything you need to build or improve a cybersecurity monitoring programme: the foundational concepts, every tool type, a metrics benchmark table, a 30/60/90-day implementation plan, and honest advice from Gart's delivery teams on where organisations most commonly fail.
Executive Summary — 6 key takeaways
01
Cybersecurity monitoring = continuous collection + correlation + analysis of security telemetry, 24/7.
02
The average breach goes undetected for 194 days (IBM 2024). Every day of dwell time adds to remediation cost.
03
Core tooling stack: SIEM + EDR/XDR + IDS/IPS + CSPM + identity monitoring. No single tool covers everything.
04
In our projects, the biggest issue is rarely tool choice — it is signal quality: mapping events to assets and owners.
05
In-house SOC and managed MDR each suit different levels. A hybrid model often delivers the best cost-to-coverage ratio.
06
Organisations with mature monitoring save an average of $1.76 million per breach compared to those without (IBM 2024).
What is Cybersecurity Monitoring?
Cybersecurity monitoring is the continuous collection, correlation, and analysis of security telemetry across endpoints, identities, cloud workloads, networks, and applications to detect threats early and trigger a structured, timely response.
Unlike a one-time security audit, cybersecurity monitoring is an always-on operational capability. It transforms raw data — logs, network flows, authentication events, cloud configuration states — into actionable intelligence that security teams can act on before damage spreads.
NIST defines Information Security Continuous Monitoring (ISCM) as "maintaining ongoing awareness of information security, vulnerabilities, and threats to support organisational risk management decisions." The practical meaning: monitoring is not a product you buy — it is a programme you build and continuously improve.
Three things make cybersecurity monitoring distinct from general IT monitoring:
Security intent: it focuses on adversarial behaviour, not just performance or availability.
Cross-domain correlation: it connects signals from endpoints, identity, network, and cloud — because modern attacks traverse all of them.
Response integration: detection without a structured response workflow creates noise, not security.
Why Cybersecurity Monitoring Matters for Modern Businesses
194
Average days to identify a breach
IBM Cost of a Data Breach, 2024
64
Additional days to contain it
IBM, 2024
$4.88M
Average total breach cost
IBM, 2024
Modern infrastructure is not a perimeter — it is a patchwork of cloud services, SaaS applications, remote endpoints, third-party APIs, and CI/CD pipelines. Attackers exploit this complexity: they move laterally over weeks, escalate privileges quietly, and exfiltrate data long before triggering any obvious alarm.
Organisations that discover incidents through customer complaints, ransomware notes, or regulatory notifications have already lost the containment window. Cybersecurity monitoring shifts the model from reactive discovery to proactive detection.
Three business realities make it non-negotiable in 2026:
Regulatory mandates: GDPR, HIPAA, PCI-DSS, NIS2, SOC 2 Type II, and ISO 27001 all require demonstrable evidence of continuous security oversight. Monitoring provides the audit trail.
Attack surface growth: Every new SaaS integration, cloud account, and remote worker adds potential entry points that a periodic scan cannot keep pace with.
Cyber-insurance requirements: Insurers increasingly require proof of active monitoring capabilities as a condition of coverage or favourable premiums.
The "Boom" Event & Proactive Threat Hunting
In security operations, the "boom" is the moment a breach executes — ransomware activates, data exfiltrates, or systems are compromised. This framing divides the security timeline into two distinct operational phases:
← Left of Boom
The attacker's preparation phase. Your detection window.
Phishing & credential harvesting
Initial access via unpatched CVEs
Lateral movement across the network
Privilege escalation attempts
Persistence mechanisms installed
Right of Boom →
Breach has happened. Goal: detect, contain, recover.
Active data exfiltration underway
Ransomware encryption begins
Command-and-control comms established
Evidence destruction attempts
Regulatory notification windows open
The goal of cybersecurity monitoring is to compress the window between an attacker's first action and your detection — ideally catching the breach left of boom, before the destructive payload executes.
Threat Hunting: Proactively Identifying Risks
Threat hunting is the proactive, human-led search for adversarial activity that automated tools have not yet flagged. Hunters use two primary signal types:
Indicators of Compromise (IOCs): Forensic artefacts left by attackers — unusual login times, unauthorised file access, known malicious IP addresses.
Indicators of Attack (IOAs): Behavioural signals that an attack is in progress — unusual data transfers, lateral movement between hosts, memory injection patterns.
Core tooling for threat hunting includes XDR (cross-domain telemetry correlation), SIEM (event aggregation and rule-based alerting), and UBA (User Behaviour Analytics, which surfaces compromised accounts and malicious insiders based on behavioural baselines).
Core Components of a Cybersecurity Monitoring Programme
No single tool provides complete coverage. A mature programme integrates several complementary layers that together form a full detection-to-response pipeline:
📥
Log Collection
🔗
SIEM Correlation
🚨
Alert Triage
🔍
Investigation
🛡️
Containment
✅
Recovery
Log Collection & Aggregation
Security telemetry must be collected from every relevant source: servers, endpoints, firewalls, cloud services, identity providers, applications, and network devices. Without broad log coverage, downstream correlation is guesswork. Key standards: NIST 800-92 and CISA log-management guidance.
SIEM (Security Information and Event Management)
The correlation engine. SIEM normalises events from all sources and applies detection rules, behavioural analytics, and correlation logic to surface potential incidents. Modern SIEMs (Splunk, Microsoft Sentinel, IBM QRadar, Elastic) include ML-driven anomaly detection. The failure mode: poorly tuned SIEMs generate thousands of low-quality alerts per day, causing alert fatigue that leads analysts to miss real threats.
EDR / XDR
EDR agents on endpoints collect granular telemetry about process activity, file changes, network connections, and registry modifications. XDR extends this across cloud workloads, email, identity, and network sources — providing correlated, cross-domain visibility that SIEM alone cannot replicate.
Network Monitoring (IDS/IPS, NDR)
Network-based detection identifies threats that bypass endpoint controls: lateral movement, command-and-control traffic, DNS tunnelling, and protocol abuse. NDR tools use ML baselines to flag anomalous traffic patterns in encrypted and east-west traffic.
Identity & Access Monitoring
The majority of breaches involve compromised credentials (Verizon DBIR 2024). Monitoring identity events — failed logins, impossible-travel alerts, privilege escalation, MFA bypass attempts, and service-account anomalies — is a primary detection surface, not an optional add-on.
Cloud Security Posture Management (CSPM)
CSPM tools continuously assess cloud environments for misconfigurations, compliance violations, and risky resource exposures. In multi-cloud environments, manual configuration review cannot keep pace with infrastructure change velocity — CSPM is a requirement, not a luxury.
Incident Response Workflow
Detection without response is noise. A defined workflow — runbooks, escalation paths, ownership assignments, and communication templates — ensures that when an alert fires, the right people take the right actions within the required timeframe. Every alert category needs a written playbook before you need it at 3 a.m.
Types of Cybersecurity Monitoring
TypeWhat It CoversKey ToolsPriority LevelSIEMCross-source log correlation, anomaly detection, compliance reportingSplunk, Microsoft Sentinel, IBM QRadar, Elastic SIEMFoundational — Day 1EDR / XDREndpoint behaviour, process activity, cross-domain detectionCrowdStrike Falcon, SentinelOne, Microsoft Defender XDRFoundational — Day 1IDS / IPSSignature-based network intrusion detection/preventionSnort, Suricata, Palo Alto NGFWHigh — perimeter and east-westNDRNetwork behavioural analytics, encrypted traffic, lateral movementDarktrace, ExtraHop, Vectra AIHigh — when lateral movement is a key riskCSPMCloud misconfigurations, IAM policy risks, compliance postureWiz, Prisma Cloud, AWS Security HubMandatory for any cloud workloadIdentity MonitoringIAM events, PAM activity, MFA anomalies, credential abuseMicrosoft Entra ID Protection, Okta ThreatInsight, BeyondTrustCritical — most breaches use stolen credentialsEmail Security MonitoringPhishing, BEC, malicious attachments, domain spoofingProofpoint, Mimecast, Microsoft Defender for Office 365Day 1 — email is the primary initial-access vectorDLP MonitoringSensitive data movement, exfiltration attempts, policy violationsForcepoint, Microsoft Purview, NightfallRequired for regulated data environmentsTypes of Cybersecurity Monitoring
Cybersecurity Monitoring Best Practices
1. Build Coverage First, Then Tune for Quality
The most common deployment mistake: organisations spin up a SIEM with five log sources and immediately start writing detection rules. Without broad coverage, blind spots are guaranteed. Before tuning, ensure every endpoint, cloud account, identity system, and network chokepoint is feeding telemetry into your monitoring stack.
2. Establish Baselines Before Writing Rules
Effective alerting requires knowing what normal looks like. Baseline login times, network traffic volumes, API call rates, and process execution patterns before deploying behavioural detection rules. Rules without baselines produce overwhelming false-positive rates that erode analyst trust in the system.
3. Map Every Alert to an Asset and an Owner
In Gart's delivery experience, teams consistently tell us the same story: "We generate thousands of alerts, but we can't tell which system they came from or who is responsible for it." Without an asset inventory that maps to alert sources, MTTD is artificially inflated not by detection failure but by coordination failure.
4. Write Runbooks Before You Need Them
A runbook is a step-by-step response procedure for a specific alert type. When an alert fires at 2 a.m., the analyst must be executing a defined playbook, not deciding what to do. For each high-priority alert category, define: who is notified, what immediate containment steps are taken, what evidence is preserved, and what escalation thresholds apply.
5. Tune Ruthlessly to Eliminate Alert Fatigue
Alert fatigue — analysts ignoring alerts because volume overwhelms judgment — is one of the leading causes of missed incidents. Commit to a weekly tuning cycle: review false-positive rates, suppress known-good patterns, and retire rules with no confirmed detections in the past 90 days. Fewer, higher-fidelity alerts are always better than more low-quality ones.
6. Validate Detection Coverage Through Testing
Never assume your monitoring detects what it claims to detect. Purple-team exercises, tabletop simulations, and adversary emulation (using MITRE ATT&CK as a framework) validate actual coverage. Teams that never test their detection capability routinely discover gaps during real incidents — exactly the wrong time to learn.
Gart Perspective
"In our projects, the biggest issue is rarely tool choice. It is signal quality: teams collect thousands of events but cannot map them to assets, owners, or response playbooks. The most effective monitoring programmes we have built are distinguished by their operational discipline, not their technology spend." — Fedir Kompaniiets, Co-founder, Gart Solutions
7. Integrate Threat Intelligence Feeds
Threat intelligence provides up-to-date information on known-malicious IPs, domains, file hashes, and emerging TTPs (tactics, techniques, and procedures). Integrating commercial or open-source intel feeds into your SIEM and EDR ensures that known-bad indicators trigger alerts even before anomalous behaviour appears.
Need help building 24/7 cybersecurity monitoring?
Gart designs and implements monitoring programmes for cloud-native and regulated environments — from architecture to runbooks to alert tuning.
Book a Monitoring Assessment
Key Cybersecurity Monitoring KPIs & Metrics
Tracking the right metrics transforms cybersecurity monitoring from a cost centre into a measurable security programme. The table below includes benchmarks based on industry data and Gart delivery experience — treat them as directional targets, not universal standards.
MetricWhat it measuresWhy it mattersTarget benchmarkHow to improveMTTD — Mean Time to DetectTime from initial breach to detectionEach additional day of dwell time increases breach cost< 24 h for high-severity eventsBroader log coverage, behavioural baselines, threat intel integrationMTTR — Mean Time to RespondTime from detection to active response actionSlow response allows attacker to expand access and exfiltrate data< 1 h for critical alertsAutomated playbooks, defined on-call rotations, pre-written runbooksMTTC — Mean Time to ContainTime to fully isolate the affected environmentContainment limits blast radius and regulatory notification timelines< 4 h for critical incidentsPre-approved isolation procedures, network segmentation, SOAR automationFalse Positive Rate% of alerts that are not genuine threatsHigh rates cause alert fatigue, leading analysts to miss real incidents< 10% for high-fidelity rulesRegular rule tuning, ML-assisted triage, suppression of known-good patternsAlert-to-Incident RatioTotal alerts generated per confirmed incidentHigh ratio = noise drowning real signals< 100:1 for mature programmesCorrelation rules, consolidation of related alerts, SIEM tuningPatching Compliance Rate% of critical CVEs patched within SLA windowUnpatched vulnerabilities are the most commonly exploited entry points> 95% within defined SLAAutomated patch management, CVE prioritisation by exposure and exploit availabilityLog-Source Coverage% of known assets actively feeding telemetryUnmonitored assets are guaranteed blind spots> 98% of known asset inventoryAsset inventory automation, agent deployment tooling, CSPM integrationDLP Incident CountVolume of sensitive-data policy violations per periodEarly indicator of insider threat or compromised account activityTrending down quarter-over-quarterData classification, DLP policy refinement, UBA for anomalous data accessKey Cybersecurity Monitoring KPIs & Metrics
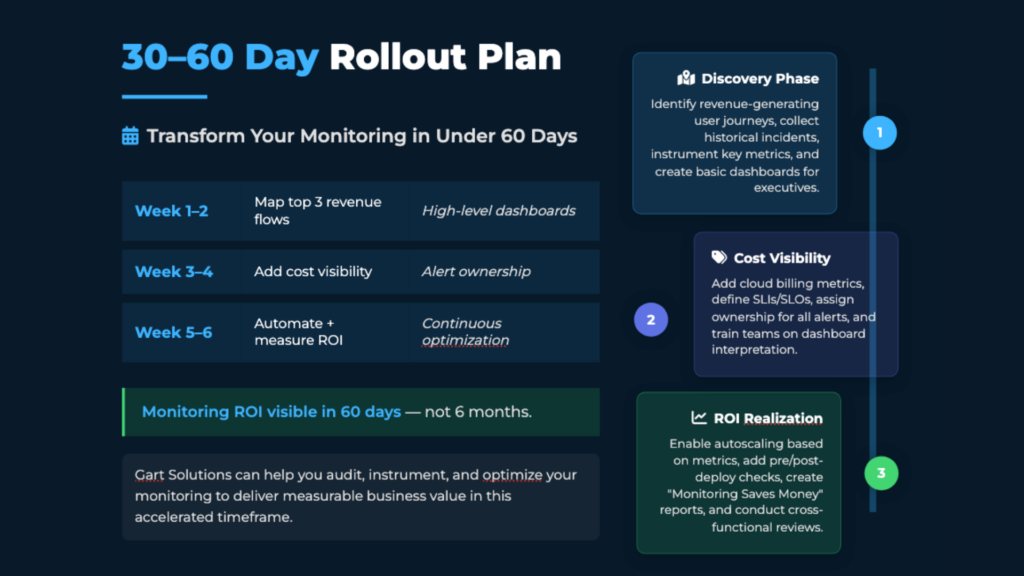
How to Implement Cybersecurity Monitoring: A 30/60/90-Day Plan
Most implementations fail because they try to do everything simultaneously. A phased approach builds foundational capability first, then layers sophistication on proven ground.
Days 1–30: Foundation
Asset inventory: Document every endpoint, server, cloud account, SaaS application, and network device in scope. You cannot protect — or correlate events from — assets you do not know exist.
Log source prioritisation: Identify your 10–15 highest-value sources: Active Directory / Entra ID, firewalls, DNS, VPN, cloud IAM logs, and critical server OS logs. Get these feeding into SIEM first.
Deploy EDR on all managed endpoints with high-confidence detection enabled and exclusion lists documented.
Define alert severity levels (P1–P4 or Critical/High/Medium/Low) and assign explicit on-call ownership for each level.
Establish baseline metrics: Record current MTTD and MTTR (even if poor) so you have a starting point to improve from.
Days 31–60: Coverage & Tuning
Expand log collection to all remaining sources: cloud workloads, SaaS applications, network devices, email security gateway.
Establish behavioural baselines for users, hosts, and services using 2–3 weeks of clean telemetry.
Write initial runbooks for the top 10 alert types by volume.
Begin weekly alert quality reviews: track and suppress the top 5 false-positive rule sources each week.
Integrate identity monitoring: connect IAM / PAM logs, enable impossible-travel and anomalous-login alerting.
Conduct first tabletop exercise to validate detection and response procedures against a realistic scenario.
Days 61–90: Optimisation & Validation
Integrate threat intelligence feeds into SIEM and EDR.
Deploy CSPM across all cloud environments and address critical posture findings.
Complete runbooks for all Tier 1 and Tier 2 alert categories.
Re-measure MTTD, MTTR, and false-positive rate to quantify improvement.
Conduct purple-team or adversary-emulation exercise mapped to MITRE ATT&CK TTPs relevant to your industry.
Establish a quarterly review cadence: coverage audit, detection-rule review, KPI reporting to leadership.
Cybersecurity Monitoring Readiness Checklist — for CISOs & CTOs
Complete, up-to-date asset inventory with data owners assigned
EDR deployed on ≥ 98% of managed endpoints
SIEM receiving normalised logs from all priority sources
Identity monitoring active (IAM, PAM, MFA events)
Cloud security posture monitoring (CSPM) enabled across all cloud accounts
Network monitoring covering east-west (lateral) traffic, not only perimeter
Alert severity levels and on-call escalation paths documented
Runbooks written and tested for top 10 alert categories
False-positive rate below 10% for high-fidelity detection rules
MTTD and MTTR baselines established and reported monthly
Detection coverage validated via exercise in the past 6 months
Quarterly monitoring review process in place with leadership reporting
In-House SOC vs. Managed Detection & Response (MDR): Which Model Fits Your Business?
FactorIn-House SOCManaged MDRHybrid ModelTime to 24/7 coverage12–18 months (hiring + tooling)4–8 weeksMDR covers gaps while SOC maturesUpfront costHigh — headcount, tools, trainingLow-medium — subscription-basedMediumEnvironment contextHigh — team knows your systemsLower initially, improves over 6–12 monthsHigh — internal team retains contextAnalyst expertise depthDepends on hiring successAccess to deep specialist talent poolSpecialist MDR for complex threats + internal for day-to-dayScalabilitySlow — constrained by hiring timelinesFast — elastic coverageFastBest fitsLarge enterprise, regulated industries, classified data environmentsMid-market, rapid-growth companies, lean security teamsEnterprise augmenting internal SOC with external threat huntingIn-House SOC vs. Managed Detection & Response (MDR)
Decision Guidance
If you have fewer than 3 dedicated security analysts today, a fully in-house 24/7 SOC is not achievable in the near term. An MDR or co-managed model delivers immediate coverage while you build internal capability. The key question to ask an MDR provider: "What does your escalation process look like at 3 a.m. on a Sunday?" — the specificity of their answer tells you whether they truly operate 24/7.
Industry-Specific Cybersecurity Monitoring Requirements
Healthcare (HIPAA)
Healthcare organisations face a dual mandate: protect patient data under HIPAA and maintain clinical system availability. Key monitoring requirements include audit logs for all access to ePHI (electronic protected health information), detection of unauthorised export or modification of patient records, and dedicated monitoring of medical-device networks — a rapidly expanding attack surface. HIPAA breach-notification requirements demand evidence of precisely what data was accessed and when, which only comprehensive monitoring can provide. See Gart's work in healthcare IT consulting.
Financial Services (PCI-DSS, GDPR, SOX)
Financial organisations must monitor cardholder data environments under PCI-DSS, maintain detailed privileged-access logs for SOX compliance, and implement data-subject access controls under GDPR. Specific requirements include anomalous-transaction pattern detection, monitoring of all privileged access to financial systems, and demonstrable data-retention and erasure controls. Gart's PCI-DSS audit service establishes the compliance baseline that a monitoring programme then maintains continuously.
SaaS & Cloud-Native Companies
For SaaS businesses, monitoring priorities shift to cloud infrastructure: API security monitoring, cloud IAM anomaly detection, multi-tenant data isolation verification, and software supply-chain security. Cloud misconfiguration remains the leading cause of SaaS data breaches — CSPM is the minimum viable control, not a nice-to-have. The CNCF publishes guidance on cloud-native security monitoring practices relevant to this segment.
Government & Defence
Government entities operate under frameworks such as CMMC, FedRAMP, and FISMA that mandate continuous monitoring, defined log-retention periods, and specific incident-reporting timelines. Insider-threat monitoring — tracking privileged user activity, data access patterns, and behavioural deviations — receives particular regulatory emphasis in this sector.
Common Cybersecurity Monitoring Mistakes
Critical Insight
Most common mistake
Compliance logging ≠ active monitoring. Storing logs to satisfy an auditor and actively analysing logs in near-real-time to detect threats are fundamentally different activities. Many organisations do the former and believe they are doing the latter. A log that is stored but never analysed provides zero detection value.
Other failure patterns Gart sees repeatedly across engagements:
Too many tools, no ownership. Buying six security platforms without clear owners and a unified workflow creates gaps and confusion. Assign explicit ownership for every tool and integrate them into a single response workflow.
No baselines, no useful alerts. Deploying detection rules before establishing behavioural baselines guarantees high false-positive rates. Baseline first, rule second.
Missing cloud and SaaS coverage. Traditional monitoring programmes were designed for on-premises environments. Cloud workloads, SaaS applications, and identity providers are now primary attack surfaces — but many programmes still lack visibility there.
Identity monitoring treated as optional. The majority of modern attacks involve compromised credentials or privilege abuse. A monitoring programme without IAM event analysis and behavioural analytics for identity has a critical blind spot.
No runbooks → MTTR measured in days, not hours. Programmes with documented, tested runbooks consistently show 2–5× faster MTTR than those without them.
Detection coverage never validated. Assuming your tools detect what they claim to detect, without any testing, is overconfidence that attackers actively exploit.
How Gart Approaches Cybersecurity Monitoring in Practice
Gart's cybersecurity monitoring engagements follow a structured delivery framework developed through implementations across healthcare, fintech, SaaS, and enterprise environments:
Discovery and asset mapping: We start by building a complete picture of what exists — every endpoint, cloud account, SaaS tool, and identity system — and what is currently being monitored. Coverage gaps are the first deliverable.
Log-source prioritisation: Not all logs are equal. We identify the 15–20 sources that cover the highest-risk attack paths in your environment and ensure those are feeding into SIEM with proper normalisation before expanding coverage further.
Alert tuning and noise reduction: We treat false-positive rate as a primary quality metric. A SIEM generating 10,000 alerts per day with 2% true-positive rate is worse than one generating 200 alerts with 40% true-positive rate. We optimise toward the latter.
Incident workflow design: Every alert category receives a written runbook that defines: detection criteria, immediate triage steps, escalation path, evidence-preservation requirements, and resolution criteria.
Ongoing optimisation: Monitoring is not a project — it is a programme. We establish a quarterly review process that measures KPI trends, identifies new coverage gaps from infrastructure changes, and updates detection logic for emerging threat patterns.
Why Trust Gart on This Topic
Gart has designed and implemented monitoring programmes for international SaaS platforms, healthcare systems, regulated financial environments, and cloud-native enterprises across Europe and North America. Our team brings direct hands-on experience with SIEM deployment, EDR/XDR integration, CSPM implementation, and compliance-aligned logging — not only theoretical knowledge.
Gart Solutions · Cybersecurity Monitoring Services
Build 24/7 Cybersecurity Monitoring Without a Full SOC Team
Gart designs and implements production-ready monitoring programmes for cloud-native companies and regulated enterprises — from architecture through continuous detection.
🗺️
Discovery & Asset Mapping
Full inventory of assets, log sources, and coverage gaps — so you know exactly what you are monitoring and what you are missing.
🔧
SIEM / XDR Architecture
Tool selection, integration design, and log-source normalisation built for your specific environment, not a generic template.
📉
Alert Tuning & Noise Reduction
We reduce false-positive rates to under 10% through behavioural baselining, rule optimisation, and continuous tuning cycles.
📋
Runbooks & Escalation Paths
Documented, tested incident-response playbooks for every alert category — so your team acts immediately, not improvises.
☁️
Cloud Security & CSPM
Continuous cloud posture monitoring, IAM anomaly detection, and multi-cloud visibility across AWS, Azure, and GCP.
✅
Compliance Readiness
Monitoring programmes designed around HIPAA, PCI-DSS, GDPR, SOC 2, and ISO 27001 requirements — audit-ready from day one.
Real-World Impact
Centralized Monitoring for a B2C SaaS Music Platform
Implemented real-time security and infrastructure monitoring using AWS CloudWatch and Grafana, delivering scalable cross-region visibility and reduced incident detection time.
Read the case study →
Monitoring Solutions for Scaling a Digital Landfill Platform
Designed a cloud-neutral monitoring solution spanning Iceland, France, Sweden, and Turkey — including compliance logging and full observability without vendor lock-in.
Read the case study →
Book a Monitoring Assessment
View Monitoring Services
Fedir Kompaniiets
Co-founder & CEO, Gart Solutions · Cloud Architect & DevOps Consultant
Fedir is a technology enthusiast with over a decade of diverse industry experience. He co-founded Gart Solutions to address complex tech challenges related to Digital Transformation, helping businesses focus on what matters most — scaling. Fedir is committed to driving sustainable IT transformation, helping SMBs innovate, plan future growth, and navigate the "tech madness" through expert DevOps and Cloud managed services. Connect on LinkedIn.
Don’t wait for a breach — contact Gart today and fortify your cybersecurity defenses!