Compliance Monitoring is the ongoing process of verifying that an organization's systems, processes, and people continuously adhere to regulatory requirements, internal policies, and industry standards — not just at audit time, but every day. For cloud-native and regulated businesses in 2026, it is the difference between a clean audit and a costly breach.
What is Compliance Monitoring?
Compliance monitoring is the systematic, continuous practice of evaluating whether an organization's operations, systems, and people conform to the laws, regulations, and internal standards that govern them. Unlike a one-time audit, compliance monitoring runs as an always-on feedback loop — collecting evidence, flagging exceptions, and enabling rapid remediation before regulators ever knock on the door.
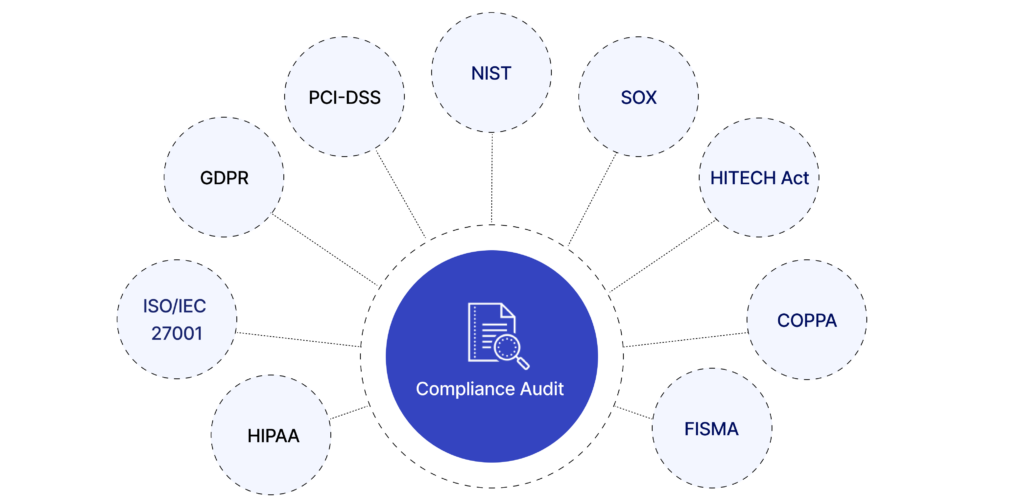
The practice is critical across heavily regulated industries:
Healthcare — HIPAA, HITECH, 21 CFR Part 11
Finance & Banking — PCI DSS, SOX, Basel III, MiFID II
Cloud & SaaS — SOC 2, ISO 27001, CSA CCM
EU-regulated entities — GDPR, NIS2, DORA
Energy & Utilities — NERC CIP, ISO 50001
Pharmaceuticals — GxP, FDA 21 CFR
💡 In short: Compliance monitoring is your organization's immune system. Audits are the annual check-up. Monitoring is what keeps you healthy between check-ups.
Why Compliance Monitoring Matters in 2026
Regulatory landscapes have never moved faster. GDPR fines reached record highs in 2024–2025, NIS2 entered enforcement mode across the EU, and DORA (Digital Operational Resilience Act) took effect for financial entities. Meanwhile, cloud adoption has created entirely new attack surfaces that traditional point-in-time audits simply cannot cover.
Risk Without MonitoringTypical Business ImpactProbability (unmonitored)Undetected misconfigured S3 bucket / cloud storageData breach, regulatory fine, brand damageHighStale privileged access not reviewedInsider threat, audit failure, SOX violationVery HighMissing audit log retentionInability to prove compliance, automatic audit failureHighBackup not testedUnrecoverable data loss, SLA breach, recovery failureMediumUnpatched critical CVE beyond SLAExploitable vulnerability, CVSS breach, PCI non-complianceHighWhy Compliance Monitoring Matters in 2026
Strong compliance monitoring builds trust with enterprise clients and partners, significantly reduces audit preparation time, and enables a proactive risk posture instead of a reactive, fire-fighting one.
Compliance Monitoring vs Compliance Audit vs Compliance Management
These three terms are often used interchangeably but they describe distinct activities that work together. Understanding the difference helps organizations allocate resources correctly.
DimensionCompliance MonitoringCompliance AuditCompliance ManagementFrequencyContinuous / near-real-timePeriodic (annual, quarterly)Ongoing governancePurposeDetect & alert on deviationsFormal independent assessmentPolicies, training, cultureOutputAlerts, dashboards, exception logsAudit report, findings, attestationPolicies, procedures, risk registerWho leadsEngineering / Security / DevOpsInternal audit / Third-party auditorCompliance Officer / GRC teamAnalogyBlood pressure cuff worn dailyAnnual physical with doctorHealthy lifestyle programCompliance Monitoring vs Compliance Audit vs Compliance Management
✅ Monitoring answers
Is MFA enforced right now?
Are all logs being retained?
Did anything change in IAM this week?
Are backups completing successfully?
Is encryption enabled on all storage?
📋 Auditing answers
Were controls effective over the period?
Did evidence satisfy the framework?
What is the organization's control maturity?
What formal findings require remediation?
Is the organization SOC 2 / ISO 27001 ready?
Explore our Compliance Audit services
The 7-Step Compliance Monitoring Process
Effective compliance monitoring is not a single tool or dashboard — it's a disciplined cycle. Here is the process Gart uses when setting up or maturing a client's compliance monitoring program:
1. Define Scope & Applicable Frameworks
Identify which regulations, standards, and internal policies apply. Map your systems, data flows, and third-party integrations to determine the monitoring perimeter. Ambiguous scope is the most common reason monitoring programs fail.
2. Inventory Systems & Controls
Catalogue all assets (cloud, on-prem, SaaS, CI/CD pipelines) and map each one to a control objective. Assign control owners. Without ownership, no one acts when an exception fires.
3. Define Evidence Collection Rules
For each control, specify what constitutes "evidence of compliance" — a log entry, a configuration state, a test result, a screenshot, or a signed document. Define collection frequency (real-time, daily, monthly) and acceptable format for auditors.
4. Instrument & Automate Collection
Deploy monitoring agents, SIEM rules, cloud policy engines (AWS Config, Azure Policy, GCP Security Command Center), and IaC scanning tools. Automate evidence collection wherever possible — manual evidence gathering at audit time is a costly, error-prone anti-pattern.
5. Monitor Exceptions & Triage Alerts
Create alert thresholds for control deviations. Not every alert is a breach — build a triage process that separates noise from genuine risk. Route high-priority exceptions to security/engineering immediately; lower-priority items to a weekly review queue.
6. Prioritize Risks & Remediate
Score exceptions by likelihood and impact. Maintain a risk register that tracks open findings, owners, and target remediation dates. Escalate unresolved critical findings to leadership with a clear business-impact framing.
7. Re-test, Report & Continuously Improve
After remediation, re-test the control to confirm it is effective. Produce compliance health reports for leadership and auditors. Run a quarterly retrospective to tune alert thresholds and update monitoring scope as regulations and infrastructure evolve.
Key Controls & Evidence to Monitor
Across hundreds of compliance engagements, the controls below consistently appear on auditor checklists. These are the areas where automated compliance monitoring delivers the highest return:
Control AreaWhat to MonitorEvidence Auditors WantRelevant FrameworksIdentity & Access (IAM)Privileged role assignments, inactive accounts, MFA status, service account permissionsAccess review logs, MFA adoption rate, least-privilege config exportsSOC 2, ISO 27001, HIPAAAudit LoggingLog completeness, retention period, tamper-evidence, SIEM ingestion healthLog retention policy, SIEM dashboard, CloudTrail / Audit Log exportsPCI DSS, SOX, NIS2, GDPREncryptionData-at-rest encryption on storage, TLS version on endpoints, key rotation schedulesEncryption config exports, key management audit logs, TLS scan reportsPCI DSS, HIPAA, GDPR, ISO 27001Patch ManagementCVE scan results, SLA adherence per severity, open critical/high vulnerabilitiesScan reports, patch cadence logs, SLA compliance metricsSOC 2, PCI DSS, ISO 27001Backup & RecoveryBackup job success rate, RPO/RTO test results, offsite replication statusBackup logs, recovery test records, DR test reportsSOC 2, ISO 22301, DORA, NIS2Vendor / Third-Party AccessActive vendor sessions, access scope, contract/NDA currency, SOC 2 report datesVendor access logs, contract register, third-party risk assessmentsISO 27001, SOC 2, GDPR, NIS2Network & PerimeterFirewall rule changes, open ports, egress filtering, WAF alert volumesFirewall config snapshots, IDS/IPS logs, pen test reportsPCI DSS, SOC 2, NIS2Incident ResponseMean time to detect (MTTD), mean time to respond (MTTR), breach notification timelinesIncident logs, CSIRT reports, post-mortemsGDPR (72h), NIS2, HIPAA, DORAKey Controls & Evidence to Monitor
Continuous Compliance Monitoring for Cloud Environments
Cloud infrastructure changes constantly — teams spin up resources, update IAM policies, and deploy code multiple times per day. This makes continuous compliance monitoring not a nice-to-have but a fundamental requirement. Manual checks against cloud state are obsolete before the ink dries.
AWS Compliance Monitoring — Key Automated Checks
AWS Config Rules — detect non-compliant resources in real time (e.g., unencrypted EBS volumes, public S3 buckets, missing CloudTrail)
AWS Security Hub — aggregates findings from GuardDuty, Inspector, Macie into a single compliance posture score
CloudTrail + Athena — query audit logs for unauthorized IAM changes, API calls outside approved regions
IAM Access Analyzer — surfaces external access to resources and unused roles/permissions
Azure Compliance Monitoring — Key Automated Checks
Azure Policy & Defender for Cloud — enforce and score compliance against CIS, NIST SP 800-53, ISO 27001 benchmarks
Microsoft Purview — data classification, governance, and audit trail across Azure and M365
Azure Monitor + Sentinel — SIEM-class alerting on suspicious activity with compliance-relevant playbooks
Privileged Identity Management (PIM) — just-in-time access with mandatory justification and approval workflows
GCP Compliance Monitoring — Key Automated Checks
Security Command Center — organization-wide misconfiguration detection and compliance benchmarking
VPC Service Controls — perimeter security policies that prevent data exfiltration
Cloud Audit Logs — immutable, per-service activity and data access logs
Policy Intelligence — recommends IAM role right-sizing based on actual usage data
🔗
For authoritative cloud security benchmarks, the CIS Benchmarks provide configuration baselines for AWS, Azure, GCP, Kubernetes, and 100+ other platforms — an industry-standard starting point for any cloud compliance monitoring program.
See Gart's Cloud Computing & Security services
Industry-Specific Compliance Monitoring Frameworks
Compliance monitoring requirements differ significantly by industry and geography. Below are the frameworks Gart's clients most commonly monitor against, along with the controls that require continuous (not just periodic) monitoring.
FrameworkIndustry / RegionKey Continuous Monitoring RequirementsResourcesISO 27001Global / All industriesAccess control review, log management, vulnerability scanning, supplier reviewISO.orgSOC 2 Type IISaaS / TechnologyContinuous availability, logical access, change management, incident responseAICPAHIPAAHealthcare (US)ePHI access logs, encryption at rest/transit, workforce activity auditsHHS.govPCI DSS v4.0Payment / E-commerceReal-time network monitoring, file integrity monitoring, quarterly vulnerability scansPCI SSCNIS2EU / Critical sectorsIncident detection within 24h, risk assessments, supply chain security checksENISAGDPREU / Global processing EU dataData subject request tracking, breach detection (<72h notification), processor auditsGDPR.euIndustry-Specific Compliance Monitoring Frameworks
How to prepare for a HIPAA Audit - Gart's PCI DSS Audit guide
First-Hand Experience
What We Usually Find During Compliance Monitoring Reviews
After reviewing postures across dozens of regulated environments, these are the patterns we encounter repeatedly — regardless of organization size.
👥
Incomplete or stale access reviews
Former employees and service accounts with active permissions weeks after departure. IAM hygiene is rarely automated, and reviews are often rubber-stamped.
📋
Missing backup test evidence
Backups appear healthy, but nobody has tested a restore in 6–18 months. Auditors want dated restore test logs with RPO/RTO outcomes, not just success metrics.
📊
Fragmented or incomplete audit logs
Gaps in the log chain (like disabled S3 data-event logging) make it impossible to reconstruct an incident or prove that one didn't happen.
🔔
Alert fatigue masking real issues
Thousands of low-fidelity alerts lead teams to mute notifications or build exceptions, inadvertently disabling detection for real threats.
📄
Policy-to-implementation gaps
Written policies say "encryption required," but reality reveals unencrypted legacy buckets. Continuous monitoring is the only way to detect this drift.
🔧
Automation is first patched, last monitored
CI/CD pipelines move faster than human reviewers. IaC repositories often lack policy-as-code scanning, leaving non-compliant resources active for months.
Featured Success Story
Case study: ISO 27001 compliance for Spiral Technology
→
Compliance Monitoring Tools & Automation
The right tooling depends on your stack, frameworks, and team maturity. Most organizations use a layered approach rather than a single platform:
CategoryRepresentative ToolsBest ForCloud Security Posture Management (CSPM)AWS Security Hub, Wiz, Prisma Cloud, Orca Security, Defender for CloudCloud misconfiguration detection, continuous benchmarkingSIEM / Log ManagementSplunk, Elastic SIEM, Microsoft Sentinel, Datadog SecurityLog correlation, anomaly detection, audit evidenceGRC PlatformsVanta, Drata, Secureframe, ServiceNow GRC, OneTrustEvidence collection automation, audit-ready reportingPolicy-as-Code / IaC ScanningOpen Policy Agent (OPA), Checkov, Terrascan, tfsec, ConftestPrevent non-compliant infrastructure from being deployedVulnerability ManagementTenable Nessus, Qualys, AWS Inspector, Trivy (containers)CVE detection, patch SLA monitoring, container scanningIdentity GovernanceSailPoint, CyberArk, Azure PIM, AWS IAM Access AnalyzerAccess reviews, least-privilege enforcement, PAM
⚠️ Tool sprawl is a compliance risk: More tools mean more integrations to maintain, more alert queues to manage, and more places where evidence can fall through the cracks. Start with native cloud tools and expand deliberately. The Linux Foundation and CNCF maintain open-source compliance tooling for cloud-native environments worth evaluating before adding commercial licenses.
Compliance Monitoring Best Practices
1. Shift compliance left into the development pipeline
The cheapest time to catch a compliance violation is before the resource is deployed. Integrate policy-as-code scanning (OPA, Checkov) into your CI/CD pipeline so that non-compliant Terraform or Helm charts never reach production. Treat compliance failures as build-breaking errors, not post-deploy recommendations.
2. Automate evidence collection — not just detection
Detection without evidence collection is useless at audit time. Configure your monitoring tools to export and archive compliance evidence (configuration snapshots, access review logs, scan reports) automatically to an immutable store. Auditors need evidence from a defined period — not a screenshot taken the morning of the audit.
3. Assign control owners, not just tool owners
Every control needs a named human owner who is accountable for exceptions. When an alert fires that MFA is disabled on a privileged account, "the security team" is not a sufficient owner — a specific person must be on call to investigate and remediate within the SLA.
4. Tune alerts ruthlessly to eliminate fatigue
Compliance monitoring programs that generate thousands of daily alerts quickly become ignored. Start with a small set of high-fidelity, high-impact alerts. Expand incrementally after each is tuned to near-zero false positive rates. A team that responds to 20 real alerts per day is more secure than one drowning in 2,000 noisy ones.
5. Monitor your monitoring
Monitoring pipelines break silently. Log shippers stop, API rate limits are hit, SIEM ingestion queues fill up. Build meta-monitoring to detect when evidence collection or alerting pipelines have gaps — and treat those gaps as compliance findings in their own right.
6. Conduct a quarterly compliance posture review
Beyond continuous automated monitoring, schedule a quarterly human review of the compliance posture. Review open exceptions, re-assess risk scores, retire obsolete controls, and update monitoring scope to cover new systems and regulatory changes.
Compliance Monitoring Checklist for Cloud Teams
A starting point for cloud-first compliance. Each item requires a named owner, a monitoring cadence, and a defined evidence artifact.
✓
MFA enforced on all privileged and administrative accounts
✓
Access reviews completed for all privileged roles (minimum quarterly)
✓
Service accounts audited for least-privilege and no unused permissions
✓
Audit logging enabled and retained (90 days min; 1 year for PCI/HIPAA)
✓
SIEM ingestion health monitored — no silent log gaps
✓
Data-at-rest encryption confirmed on all storage (S3, RDS, EBS, blobs)
✓
TLS 1.2+ enforced; TLS 1.0/1.1 disabled on all endpoints
✓
Encryption key rotation scheduled and verified
✓
Vulnerability scans run weekly; critical/high CVEs remediated within SLA
✓
Patch management SLA compliance tracked and reported
✓
Backups verified complete daily; restore tests documented quarterly
✓
DR test completed at least annually; RPO/RTO outcomes logged
✓
No public cloud storage buckets without explicit business justification
✓
Firewall change log reviewed; unauthorized rule changes alerting
✓
Vendor/third-party access scoped, time-limited, and reviewed quarterly
✓
Incident response plan tested; MTTD and MTTR tracked
✓
Policy-as-code scans integrated into CI/CD pipelines
✓
Compliance evidence archived in immutable storage for audit period
✓
Monitoring pipeline health checked — no silent collection failures
✓
Quarterly posture review conducted with named control owners
Gart Solutions · Compliance Monitoring Services
How Gart Helps You Build a Continuous Compliance Monitoring Program
We work with CTOs, CISOs, and engineering leaders to design, implement, and run compliance monitoring programs that hold up under real auditor scrutiny — not just on paper.
🗺️
Scope & Framework Mapping
We identify applicable frameworks (ISO 27001, SOC 2, HIPAA, PCI DSS, NIS2, GDPR) and map your cloud infrastructure to each control objective.
🔧
Monitoring Setup & Automation
We deploy CSPM tools, SIEM rules, and policy-as-code pipelines — so evidence is collected automatically, not manually on audit day.
📊
Gap Analysis & Risk Register
We deliver a clear view of your current compliance posture, prioritized by risk, with a remediation roadmap and accountable owners.
🔄
Ongoing Reviews & Readiness
Monthly exception reviews and pre-audit evidence packages — so you're never scrambling the week before an official audit.
☁️
Cloud-Native Expertise
AWS, Azure, GCP, Kubernetes, and CI/CD. We speak infrastructure as code and translate compliance into DevOps workflows.
📋
Audit-Ready Deliverables
Exception logs, risk matrices, and control evidence archives. Everything formatted for the specific framework you're being audited against.
Get a Compliance Audit
Talk to an Expert
Fedir Kompaniiets
Co-founder & CEO, Gart Solutions · Cloud Architect & DevOps Consultant
Fedir is a technology enthusiast with over a decade of diverse industry experience. He co-founded Gart Solutions to address complex tech challenges related to Digital Transformation, helping businesses focus on what matters most — scaling. Fedir is committed to driving sustainable IT transformation, helping SMBs innovate, plan future growth, and navigate the "tech madness" through expert DevOps and Cloud managed services. Connect on LinkedIn.
Site Reliability Engineering (SRE) monitoring and application monitoring are two sides of the same coin: both exist to keep complex distributed systems reliable, performant, and transparent. For engineering teams managing microservices, Kubernetes, and cloud-native architectures, knowing what to measure—and how to act on it—is the difference between a 15-minute incident and an all-night outage.
This guide explains how the four Golden Signals serve as the foundation of production-grade application monitoring, how to connect them to SLIs, SLOs, and error budgets, and how to build dashboards and alerting workflows that actually reduce your MTTR.
KEY TAKEAWAYS
Golden Signals (latency, errors, traffic, saturation) are the universal language of SRE application monitoring across any tech stack.
Connecting signals to SLIs and SLOs turns raw metrics into reliability commitments your team can own.
Alert thresholds must be derived from baseline data and SLOs—the examples in this article are illustrative starting points, not universal rules.
After implementing Golden Signals, Gart clients have reduced MTTR by up to 60% within two months. Read the full case study context below.
What is SRE Monitoring?
SRE monitoring is the practice of continuously observing the health, performance, and availability of software systems using the methods and principles defined by Google's Site Reliability Engineering discipline. Unlike traditional system monitoring—which often tracks dozens of low-level infrastructure metrics—SRE monitoring is intentionally opinionated: it focuses on the signals that directly reflect user experience and system reliability.
At its core, SRE monitoring answers three questions at all times:
Is the system currently serving users correctly?
How close are we to breaching our reliability commitments (SLOs)?
Which service or component is responsible when something breaks?
This user-centric orientation is what separates SRE monitoring from generic infrastructure monitoring. An SRE team does not alert on "CPU at 80%"—they alert when that CPU spike is burning through their monthly error budget faster than expected.
Application Monitoring in the SRE Context
Application monitoring is the discipline of tracking how software applications behave in production: response times, error rates, throughput, resource consumption, and end-user experience. In an SRE context, application monitoring is the primary layer where Golden Signals are measured and where the gap between infrastructure health and user experience becomes visible.
A database node may be running at 40% CPU—perfectly healthy by infrastructure standards—while every query takes 4 seconds because of a missing index. Infrastructure monitoring shows green; application monitoring shows a latency crisis. This is why SRE teams invest heavily in application-level telemetry: it captures what infrastructure metrics miss.
Modern application monitoring spans three pillars:
Metrics — numerical time-series data (latency percentiles, error counts, RPS).
Logs — structured event records that capture request context and error detail.
Traces — distributed request journeys that map latency across service boundaries.
The Golden Signals framework unifies these pillars into four actionable categories that any team can monitor, regardless of their technology stack.
The Four Golden Signals in SRE
SRE principles streamline application monitoring by focusing on four metrics—latency, errors, traffic, and saturation—collectively known as Golden Signals. Instead of tracking hundreds of metrics across different technologies, this focused framework helps teams quickly identify and resolve issues.
Latency:Latency is the time it takes for a request to travel from the client to the server and back. High latency can cause a poor user experience, making it critical to keep this metric in check. For example, in web applications, latency might typically range from 200 to 400 milliseconds. Latency under 300 ms ensures good user experience; errors >1% necessitate investigation. Latency monitoring helps detect slowdowns early, allowing for quick corrective action.
Errors:Errors refer to the rate of failed requests. Monitoring errors is essential because not all errors have the same impact. For instance, a 500 error (server error) is more severe than a 400 error (client error) because the former often requires immediate intervention. Identifying error spikes can alert teams to underlying issues before they escalate into major problems.
Traffic:Traffic measures the volume of requests coming into the system. Understanding traffic patterns helps teams prepare for expected loads and identify anomalies that might indicate issues such as DDoS attacks or unplanned spikes in user activity. For example, if your system is built to handle 1,000 requests per second and suddenly receives 10,000, this surge might overwhelm your infrastructure if not properly managed.
Saturation:Saturation is about resource utilization; it shows how close your system is to reaching its full capacity. Monitoring saturation helps avoid performance bottlenecks caused by overuse of resources like CPU, memory, or network bandwidth. Think of it like a car's tachometer: once it redlines, you're pushing the engine too hard, risking a breakdown.
Why Golden Signals Matter
Golden Signals provide a comprehensive overview of a system's health, enabling SREs and DevOps teams to be proactive rather than reactive. By continuously monitoring these metrics, teams can spot trends and anomalies, address potential issues before they affect end-users, and maintain a high level of service reliability.
SRE Golden Signals help in proactive system monitoring
SRE Golden Signals are crucial for proactive system monitoring because they simplify the identification of root causes in complex applications. Instead of getting overwhelmed by numerous metrics from various technologies, SRE Golden Signals focus on four key indicators: latency, errors, traffic, and saturation.
By continuously monitoring these signals, teams can detect anomalies early and address potential issues before they affect the end-user. For instance, if there is an increase in latency or a spike in error rates, it signals that something is wrong, prompting immediate investigation.
What are the key benefits of using "golden signals" in a microservices environment?
The "golden signals" approach is especially beneficial in a microservices environment because it provides a simplified yet powerful framework to monitor essential metrics across complex service architectures.
Here’s why this approach is effective:
▪️Focuses on Key Performance Indicators (KPIs)
By concentrating on latency, errors, traffic, and saturation, the golden signals let teams avoid the overwhelming and often unmanageable task of tracking every metric across diverse microservices. This strategic focus means that only the most crucial metrics impacting user experience are monitored.
▪️Enhances Cross-Technology Clarity
In a microservices ecosystem where services might be built on different technologies (e.g., Node.js, DB2, Swift), using universal metrics minimizes the need for specific expertise. Teams can identify issues without having to fully understand the intricacies of every service’s technology stack.
▪️Speeds Up Troubleshooting
Golden signals quickly highlight root causes by filtering out non-essential metrics, allowing the team to narrow down potential problem areas in a large web of interdependent services. This is crucial for maintaining service uptime and a seamless user experience.
SRE Monitoring vs. Observability vs. Application Performance Monitoring (APM)
These three terms are often used interchangeably, but they refer to distinct practices with different scopes. Understanding where they overlap—and where they diverge—helps teams invest in the right tooling and processes.
DimensionSRE MonitoringObservabilityApplication Monitoring (APM)Primary questionAre we meeting our reliability targets?Why is the system behaving this way?How is this application performing right now?Core signalsGolden Signals + SLIs/SLOsLogs, metrics, traces (full telemetry)Response time, throughput, error rate, ApdexAudienceSRE / on-call engineersPlatform engineering, DevOps, SREDev teams, operations, managementTypical toolsPrometheus, Grafana, PagerDutyOpenTelemetry, Jaeger, ELK StackDatadog, New Relic, Dynatrace, AppDynamicsScopeService reliability & error budgetsFull system internal stateApplication transaction performanceSRE Monitoring vs. Observability vs. Application Performance Monitoring (APM)
In practice, mature engineering organizations treat these as complementary layers. Golden Signals surface what is wrong quickly; observability tooling explains why; APM dashboards give development teams actionable detail at the code level.
SLIs, SLOs, and Error Budgets in SRE Monitoring
Golden Signals generate raw measurements. SLIs and SLOs transform those measurements into reliability commitments that the business can understand and engineering teams can own.
Service Level Indicators (SLIs)
An SLI is a quantitative measure of a service behavior directly derived from a Golden Signal. For example:
Availability SLI: percentage of requests that return a non-5xx response.
Latency SLI: percentage of requests served in under 300ms (P95).
Throughput SLI: percentage of expected message batches processed within the SLA window.
Service Level Objectives (SLOs)
An SLO is the target value for an SLI over a rolling window. A well-formed SLO looks like: "99.5% of requests must return a non-5xx response over a rolling 28-day window." SLOs are the bridge between Golden Signals and business impact. When your SLO says 99.5% availability and you are at 99.2%, you are burning error budget—and that is the signal your team needs to prioritize reliability work over new features.
Error Budgets
An error budget is the allowable amount of unreliability defined by your SLO. For a 99.5% availability SLO over 28 days, the error budget is 0.5% of all requests—roughly 3.6 hours of complete downtime equivalent. When the error budget is healthy, teams can ship changes confidently. When it is depleted or burning fast, the SRE team has a data-driven mandate to freeze releases and focus on reliability.
Practical tip: Track error budget burn rate alongside your Golden Signals dashboard. A burn rate of 1x means you are consuming the budget at exactly the rate your SLO allows. A burn rate of 3x means you will exhaust your budget in one-third of the SLO window — an immediate escalation trigger.
How to Monitor Microservices Using Golden Signals
Monitoring microservices requires a disciplined approach in environments where dozens of services interact across different technology stacks. Golden Signals provide a clear framework for tracking system health across these distributed systems.
Step 1: Define Your Observability Pipeline per Service
Each microservice should expose telemetry for all four Golden Signals. Integrate them directly with your SLI definitions from day one:
Latency — measure P50, P95, and P99 request duration per service.
Errors — capture 4xx/5xx HTTP codes and application-level exceptions separately.
Traffic — monitor RPS, message throughput, and connection concurrency.
Saturation — track CPU, memory, thread pool usage, and queue depth.
Step 2: Choose a Unified Monitoring Stack
Popular platforms for production-grade application monitoring in microservices include:
Prometheus + Grafana — open-source, highly customizable, excellent for Kubernetes environments.
Datadog / New Relic — full-stack observability with built-in Golden Signals support and auto-instrumentation.
OpenTelemetry — CNCF-backed standard for vendor-neutral telemetry instrumentation.
Step 3: Isolate Service Boundaries
Group Golden Signals by service so you can detect where a problem originates rather than just knowing that something is wrong:
MicroserviceLatency (P95)Error RateTrafficSaturationAuth220ms1.2%5k RPS78% CPUPayments310ms3.1%3k RPS89% MemoryNotifications140ms0.4%12k RPS55% CPU
Step 4: Correlate Signals with Distributed Tracing
Use distributed tracing to map requests across services. Tools like Jaeger or Zipkin let you trace latency across hops, find the exact service causing error spikes, and visualize traffic flows and bottlenecks. A latency spike in the Payments service that traces back to a slow DB query is far more actionable than "P95 latency is high."
Learn how these principles apply in practice from our Centralized Monitoring case study for a B2C SaaS Music Platform.
Step 5. Automate Alerting with Context
Set thresholds and anomaly detection for each signal:
Latency > 500ms? Alert DevOps
Saturation > 90%? Trigger autoscaling
Error Rate > 2% over 5 mins? Notify engineering and create an incident ticket
Alerting Principles for SRE Teams
Effective application monitoring is only as useful as the alerting layer that translates signals into human action. Alert fatigue is one of the most common—and costly—failure modes in SRE programs. These principles help teams alert on what matters without overwhelming the on-call engineer.
Alert on Symptoms, Not Causes
Alert when the user experience is degraded (latency SLO is burning), not when a machine metric crosses a threshold. "CPU at 80%" is a cause; "P95 latency exceeding 500ms for 5 minutes" is a symptom your SLO cares about.
Use Error Budget Burn Rate as Your Primary Alert
A fast burn rate (e.g., 3x or 6x) on your error budget is a better paging condition than raw signal thresholds. It tells you not just that something is wrong, but how urgently you need to act based on your reliability commitments.
Sample Alert Thresholds (Illustrative Only)
SignalSample ThresholdSuggested ActionUrgencyLatency (P95)>500ms for 5 minPage on-call SREHighError Rate>2% over 5 minCreate incident ticket + notify engineeringHighSaturation (CPU)>90% for 10 minTrigger autoscaling policyMediumError Budget Burn3× rate for 1 hourIncident call, feature freeze considerationCritical
Methodology note: These thresholds are starting-point illustrations. Your production values should be calibrated against your own service baselines, user SLAs, and SLO definitions. A payment service tolerates far less latency than an async batch job.
Practical Application: Using APM Dashboards for SRE Monitoring
Application Performance Management (APM) dashboards integrate Golden Signals into a single view, allowing teams to monitor all critical metrics simultaneously. The operations team can use APM dashboards to get real-time insights into latency, errors, traffic, and saturation—reducing the cognitive load during incident response.
The most valuable APM features for SRE teams include:
One-hop dependency views — shows only the immediate upstream and downstream services of a failing component, dramatically narrowing the root-cause investigation scope and reducing MTTR.
Centralized Golden Signals panels — all four signals per service in one view, eliminating tool-switching during incidents.
SLO burn rate overlays — trend lines showing how quickly the error budget is being consumed, integrated alongside raw Golden Signals.
Proactive anomaly detection — ML-powered tools like Datadog and Dynatrace flag statistically unusual patterns before thresholds breach.
What is the Significance of Distinguishing 500 vs. 400 Errors in SRE Monitoring?
The distinction between 500 and 400 errors in application monitoring is fundamental to correct incident prioritization. Conflating them inflates your error rate SLI and may generate alerts that do not reflect actual service degradation.
Error TypeCauseSeveritySRE Response500 — Server errorSystem or application failureHighImmediate investigation, possible incident declaration400 — Client errorBad input, expired auth token, invalid requestLowerMonitor trends; investigate only on sustained spikes
A good SLI definition for errors counts only server-side failures (5xx) against your reliability budget. A sudden 400-error spike may signal a client SDK bug, a bot campaign, or a broken authentication flow—all worth investigating, but none of them are a service outage.
SRE Monitoring Dashboard Best Practices
A well-structured SRE dashboard makes or breaks incident response. It is not about displaying all available data—it is about surfacing the right insights at the right time. See the official Google SRE Book on monitoring for the principles that underpin these practices.
1. Prioritize Golden Signals and SLO Burn Rate at the Top
Place latency (P50/P95), error rate (%), traffic (RPS), and saturation front and center. Add SLO burn rate immediately below so engineers can assess reliability impact at a glance without scrolling.
2. Use Visual Cues Consistently
Color-code thresholds (green / yellow / red), use sparklines for trend visualization, and heatmaps to identify saturation patterns across clusters or availability zones.
3. Segment by Environment and Service
Separate production, staging, and dev views. Within production, segment by service or team ownership and by availability zone. This isolation dramatically reduces the time to pinpoint which service is responsible during an incident.
4. Link Metrics to Logs and Traces
Make your dashboards navigable: a latency spike should be one click away from the related trace in Jaeger, and a spike in errors should link directly to filtered log output in Kibana or Grafana Loki.
5. Provide Role-Appropriate Views
Use templating (Grafana variables, Datadog template variables) to serve multiple audiences from a single dashboard: SRE/on-call engineers need real-time signal detail; engineering teams need per-service deep dives; leadership needs SLO health summaries.
6. Treat Dashboards as Living Documents
Prune panels that nobody uses, reassess thresholds quarterly against updated baselines, and add deployment or incident annotations so that future engineers understand historical anomalies in context.
How Gart Implements SRE Monitoring in 30–60 Days
Generic best practices are helpful, but implementation details are where most teams struggle. Here is how Gart's SRE team approaches application monitoring engagements from day one, based on hands-on delivery experience across SaaS, cloud-native, and distributed environments—reviewed by Fedir Kompaniiets, Co-founder at Gart Solutions, who has designed monitoring and observability systems across multiple industries.
Days 1–14: Baseline and Instrumentation
Audit existing telemetry: what is already collected, what is missing, what is noisy.
Instrument all services with OpenTelemetry or native exporters for all four Golden Signals.
Deploy Prometheus + Grafana or connect to the client's existing observability platform.
Establish baseline latency, error rate, and saturation profiles per service under normal load.
Days 15–30: SLIs, SLOs, and Initial Alerting
Define SLIs for each critical service in collaboration with product and engineering stakeholders.
Draft SLOs and calculate initial error budgets based on business risk tolerance.
Configure symptom-based alerts (burn rate, not raw thresholds) with PagerDuty or Opsgenie routing.
Stand up the first three dashboards: overall service health, per-service Golden Signals, SLO burn rate.
Days 31–60: Noise Reduction and Handover
Tune alert thresholds against the observed baseline to eliminate alert fatigue.
Remove noisy, low-signal alerts that were generating false pages.
Integrate distributed tracing for the highest-traffic services.
Run a simulated incident to validate the monitoring stack end-to-end before handover.
Deliver runbooks and on-call documentation tied to each alert condition.
Real outcome: After implementing Golden Signals and SLO-based alerting for a B2C SaaS platform, the client reduced MTTR by 60% within two months. The primary driver was eliminating alert fatigue (previously 80+ daily alerts, reduced to 8 actionable ones) and linking every alert to a runbook with a clear first-responder action. Read the full context: Centralized Monitoring for a B2C SaaS Music Platform.
Watch How we Built "Advanced Monitoring for Sustainable Landfill Management"
Conclusion
Ready to take your system's reliability and performance to the next level? Gart Solutions offers top-tier SRE Monitoring services to ensure your systems are always running smoothly and efficiently. Our experts can help you identify and address potential issues before they impact your business, ensuring minimal downtime and optimal performance.
Gart Solutions · Expert SRE Services
Is Your Application Monitoring Ready for Production?
Engineering teams that invest in proper SRE monitoring and application monitoring reduce MTTR, protect error budgets, and ship with confidence. Gart's SRE team has designed and deployed monitoring stacks for SaaS platforms, Kubernetes-native environments, fintech, and healthcare systems.
60%
MTTR reduction for SaaS clients
30
Days to working SLO dashboards
99.9%
Availability target for managed clients
Our services cover the full monitoring lifecycle — from telemetry instrumentation and Golden Signal dashboards to SLO definition, alert tuning, and on-call runbooks.
Golden Signals Setup
SLI / SLO Definition
Prometheus + Grafana
Alert Tuning
Distributed Tracing
Kubernetes Monitoring
Incident Runbooks
Talk to an SRE Expert
Explore Monitoring Services
B2C SaaS Music Platform
Centralized monitoring across global infrastructure — 60% MTTR reduction in 2 months.
Digital Landfill Platform
Cloud-agnostic monitoring for IoT emissions data with multi-country compliance.
Fedir Kompaniiets
Co-founder & CEO, Gart Solutions · Cloud Architect & DevOps Consultant
Fedir is a technology enthusiast with over a decade of diverse industry experience. He co-founded Gart Solutions to address complex tech challenges related to Digital Transformation, helping businesses focus on what matters most — scaling. Fedir is committed to driving sustainable IT transformation, helping SMBs innovate, plan future growth, and navigate the "tech madness" through expert DevOps and Cloud managed services. Connect on LinkedIn.
What is application monitoring and why is it critical?
Application monitoring is the continuous practice of tracking your software's performance, availability, and error rates in real time. In 2026, with the average cost of a production outage exceeding $5,600 per minute (Gartner), teams that monitor proactively resolve incidents up to 60% faster than those relying on reactive alerts. This guide covers key metrics, tools like Datadog and Prometheus, step-by-step implementation, and insider practices to avoid alert fatigue.
What Is Application Monitoring?
Application monitoring is the process of continuously observing, tracking, and analyzing the performance, availability, and overall health of software applications running in production. It gives engineering teams real-time and historical visibility into how an application behaves under load, where errors originate, and how user experience is affected by infrastructure changes.
The discipline spans from low-level infrastructure metrics (CPU, memory) to high-level business signals (conversion rates, revenue per transaction). Application monitoring is today a foundational pillar of both DevOps practices and Site Reliability Engineering (SRE).
The key objectives of application monitoring are:
Ensure optimal application performance and response times
Maintain high availability, reliability, and uptime SLAs
Detect and resolve incidents before they impact end users
Provide data for capacity planning and architecture decisions
Support compliance and security audit requirements
Why Application Monitoring Matters in 2026
Modern applications are no longer monolithic. They are distributed ecosystems of microservices, serverless functions, third-party APIs, and multi-cloud infrastructure. A single degraded dependency can cascade into a full-blown outage within seconds — yet be invisible without proper monitoring in place.
$5,600
Average cost per minute of downtime
Gartner, 2024
60%
Faster MTTR with proactive monitoring
Gart Solutions client data
81%
Of outages are detected by end users first
Google SRE Book
Without application monitoring, engineering teams are essentially flying blind. They discover problems from customer complaints, social media escalations, or late-night PagerDuty calls — after significant business damage has already occurred. With the right monitoring stack, teams shift from reactive firefighting to proactive reliability engineering.
"Monitoring isn't just an operational concern — it's a business continuity strategy. Every minute of undetected degradation erodes user trust in ways that take months to rebuild." — Fedir Kompaniiets, Co-founder, Gart Solutions
Key Challenges in Application Monitoring
One of the major challenges in modern application monitoring is managing the complexity that comes with microservices. Applications today are built using a multitude of microservices that interact with one another, often spanning across different cloud environments. Finding and monitoring all these services can be a daunting task.
A useful analogy can be drawn from early aviation. Pilots in the past had to rely on their intuition and limited manual tools to interpret multiple signals coming from various instruments simultaneously, making it difficult to ensure safe operations. Similarly, application operators are often flooded with a vast amount of performance signals and data, which can be overwhelming to process. This data overload is compounded by the fact that microservices are highly distributed and can have many dependencies that require monitoring.
Without the right tools, managing all this information can be a bottleneck, just like early pilots struggled with too many signals.
SRE (Site Reliability Engineering) principles streamline the monitoring of complex systems by focusing on the most critical aspects of application performance. Rather than tracking every possible metric, SRE emphasizes the Golden Signals (latency, errors, traffic, and saturation). This approach reduces the complexity of analyzing multiple services, allowing engineers to identify root causes faster, even in microservice topologies where each service could be based on different technologies. The key advantage is faster detection and resolution of issues, minimizing downtime and enhancing the user experience.
Types of Application Monitoring
Application monitoring encompasses a range of techniques and tools to provide comprehensive visibility into the performance, availability, and overall health of software systems. Some of the key types of application monitoring include:
Infrastructure Monitoring
This involves monitoring the underlying hardware, virtual machines, and cloud resources that support the application, such as CPU, memory, storage, and network utilization. Infrastructure monitoring helps ensure the reliable operation of the application's foundation.
Application Performance Monitoring (APM)
APM focuses on tracking the performance and behavior of the application itself, including response times, error rates, transaction tracing, and resource consumption. This allows teams to identify performance bottlenecks and optimize the application's codebase.
User Experience Monitoring
This approach tracks how end-users interact with the application, measuring metrics like page load times, user clicks, and session duration. User experience monitoring helps ensure the application meets or exceeds customer expectations.
Log and Event Monitoring
Monitoring the application's logs and event data can provide valuable insights into system behavior, errors, and security incidents. This information can be used to troubleshoot problems and ensure regulatory compliance.
Synthetic Monitoring
Synthetic monitoring uses automated scripts to simulate user interactions and measure the application's responsiveness, availability, and functionality from various geographic locations. This proactive approach helps detect issues before they impact real users.
Real-User Monitoring (RUM)
RUM tracks the actual experience of end-users by collecting performance data directly from the user's browser or mobile device. This provides a more accurate representation of the user experience compared to synthetic monitoring.
Application Monitoring vs. Observability: What's the Difference?
These terms are often used interchangeably, but they describe different philosophies. Understanding the distinction is critical for building a mature monitoring program.
Traditional
Application Monitoring
Focus: Tracks predefined metrics and thresholds
Goal: Answers: "Is the system healthy?"
Nature: Reactive — triggers alerts when known conditions occur
Use Case: Best for known failure modes (e.g. CPU > 90%)
Tools: Nagios, Zabbix, CloudWatch
VS
Advanced
Observability
Focus: Enables ad-hoc exploration of system behavior
Goal: Answers: "Why is the system behaving this way?"
Nature: Proactive — surfaces "unknown unknowns"
Use Case: Complex failure modes (e.g. distributed tracing)
Tools: OpenTelemetry, Honeycomb, Datadog APM
The practical takeaway: Monitoring tells you that something is wrong. Observability helps you understand why. In 2026, mature engineering teams need both — starting with solid application monitoring and layering in full observability as complexity grows.
Key Metrics for Application Monitoring
Not all metrics are created equal. Tracking hundreds of signals creates noise without improving reliability. The most effective teams focus on a structured hierarchy of metrics — from foundational signals up to business impact.
Tier 1: The Four Golden Signals (SRE Standard)
Defined by Google's SRE team, these four metrics form the minimum viable monitoring baseline for any production service:
SignalDefinitionHealthy Threshold (typical)Alert ConditionLatencyTime to process a request (P50/P95/P99)P95 < 300msP95 > 500ms for 5 minError Rate% of requests resulting in 5xx errors< 0.1%> 1% over 5 minTrafficRequests per second (RPS/QPS)Baseline ± 30%Drop > 50% or spike > 3x baselineSaturationResource utilization (CPU, memory, queue depth)< 70%> 85% sustained > 10 minThe Four Golden Signals (SRE Standard)
Tier 2: Application Performance Metrics (APM KPIs)
MetricWhy It MattersToolingApdex ScoreSingle satisfaction score for response timeNew Relic, DatadogTransaction TracesEnd-to-end request path through servicesJaeger, Datadog APM, ZipkinDB Query LatencySlow queries cascade to API slowdownspgBadger, Datadog, New RelicGarbage CollectionGC pauses cause latency spikes in JVM/Go appsPrometheus, AppDynamicsThread Pool UtilizationThread exhaustion causes request queuingJMX, Datadog, New RelicApplication Performance Metrics (APM KPIs)
Tier 3: Business & User Experience Metrics
These bridge the gap between technical performance and business outcomes — critical for communicating the value of reliability work to stakeholders:
MetricBusiness ConnectionPage Load Time (Core Web Vitals)1s delay → 7% drop in conversions (Google data)Checkout Funnel Completion RateDirect revenue signal for e-commerceAPI Response Time by Customer TierSLA compliance for enterprise contractsSession Abandonment RateCorrelated with performance degradationsReal User Monitoring (RUM) DataActual user experience vs synthetic baselinesBusiness & User Experience Metrics
Types of Application Monitoring
A comprehensive application monitoring strategy spans multiple layers of the tech stack. Each type serves a distinct purpose and requires different tooling:
1. Infrastructure Monitoring
Tracks the underlying hardware, VMs, and cloud resources — CPU utilization, memory, disk I/O, and network throughput. This is the foundation. Without infrastructure health, application-level metrics are meaningless. Tools: Prometheus Node Exporter, AWS CloudWatch, Nagios.
2. Application Performance Monitoring (APM)
The core layer — tracks response times, error rates, transaction traces, and code-level bottlenecks. APM agents instrument your application and surface the exact line of code causing a slowdown. Tools: Datadog APM, New Relic, AppDynamics, Dynatrace.
3. Synthetic Monitoring
Automated scripts simulate user journeys from multiple geographic locations, proactively testing availability and response times before real users are affected. Critical for SLA verification and pre-release checks. Tools: Datadog Synthetics, New Relic Synthetics, Pingdom.
4. Real User Monitoring (RUM)
Captures actual performance data from real browsers and mobile devices. Unlike synthetic monitoring, RUM shows how geography, device type, and network conditions affect your actual users. Tools: Datadog RUM, New Relic Browser, Elastic RUM.
5. Log & Event Monitoring
Aggregates, indexes, and searches application logs for errors, security incidents, and behavioral anomalies. Structured logging dramatically improves searchability and alerting accuracy. Tools: ELK Stack, Splunk, Grafana Loki, Datadog Logs.
6. Distributed Tracing
In microservices architectures, a single user request may touch dozens of services. Distributed tracing follows the entire request path, making it possible to pinpoint exactly where latency or errors are introduced. Tools: Jaeger, Zipkin, OpenTelemetry, AWS X-Ray.
TypeBest ForWhen to PrioritizeInfrastructure MonitoringHardware/cloud healthFrom day oneAPMApp performance & errorsFrom day oneSynthetic MonitoringProactive availabilityBefore launchReal User MonitoringActual user experiencePost-launch scaleLog MonitoringRoot cause investigationFrom day oneDistributed TracingMicroservices debuggingWhen adopting microservices
Top Application Monitoring Tools (Compared)
Choosing the right tooling depends on your team size, budget, infrastructure complexity, and in-house expertise. Here is an honest comparison of the most widely adopted platforms:
Full-Stack APM · Commercial
Datadog
The gold standard for cloud-native observability. Exceptional out-of-the-box integrations (800+), AI-powered anomaly detection, and a unified platform for metrics, logs, and traces.
Best for: Mid-size to enterprise teams wanting a "single pane of glass."
APM · Commercial
New Relic
Usage-based pricing makes it accessible for startups. Strong distributed tracing, excellent browser/mobile monitoring, and a genuinely useful free tier.
Best for: Developer-led teams wanting fast time-to-value.
Metrics · Open Source
Prometheus
The de facto standard for Kubernetes metrics collection. Powerful PromQL language and a massive ecosystem. Requires investment but offers total control.
Best for: Cloud-native teams prioritizing zero licensing costs.
Visualization · Open Source
Grafana
The most flexible dashboard platform available. Connects to Prometheus, Loki, Tempo, CloudWatch, and Datadog. Used by teams at every scale.
Best for: Teams needing highly customizable visual observability.
AI-Powered APM · Commercial
Dynatrace
Sets itself apart with automatic dependency mapping and Davis AI for root cause analysis. Minimizes configuration overhead significantly.
Best for: Large enterprises with complex legacy architectures.
Logs · Commercial/OSS
ELK Stack
Elasticsearch, Logstash, and Kibana — the standard for log management. Highly scalable and flexible, but requires operational overhead to manage.
Best for: Deep log analysis and large-scale data indexing.
ToolBest ForPricing ModelOpen Source?DatadogFull-stack, enterprisePer host/GB ingestedNoNew RelicAPM, developer-led teamsPer user + data ingestNoPrometheusKubernetes, metricsFree, self-hostedYes (CNCF)GrafanaVisualization, dashboardsFree / Grafana CloudYesDynatraceEnterprise, AI-drivenPer DEM unitNoELK StackLog managementFree / Elastic CloudYesAppDynamicsEnterprise APMPer CPU coreNoTop Application Monitoring Tools (Compared)
The Monitoring Maturity Model
Not all organizations need to — or should try to — build the most sophisticated monitoring stack on day one. This original framework from Gart Solutions' SRE practice maps your current state and provides a clear progression path:
1
Level 1
Reactive
Users report incidents
No monitoring tooling in place. The team discovers outages through customer complaints or social media. MTTD measured in hours or days.
2
Level 2
Basic Alerts
Infrastructure health checks & uptime
Server uptime checks, basic CPU/memory alerts, and simple HTTP pings. Issues are detected faster, but root cause analysis is still manual.
3
Level 3
APM in Place
Application performance monitoring deployed
APM agents instrument services, error rates and latency are tracked. Dashboards exist, but alert thresholds are manually configured.
MTTD < 15 min
4
Level 4
Observability
Metrics, logs, and traces unified
The three pillars are correlated in a single platform. SLIs and SLOs are defined, error budgets tracked. Runbooks linked to alerts.
MTTD < 5 min
5
Level 5
Predictive
AI/ML-driven proactive operations
Anomaly detection and automated remediation (circuit breakers) prevent incidents. Business and reliability metrics are fully integrated.
True Proactive Ops
Where are you today?
Most organizations we audit at Gart Solutions are between Level 2 and Level 3.
The jump from Level 3 to Level 4 — correlating metrics, logs, and traces — delivers the largest ROI in reduced MTTR and faster deployment confidence.
How to Implement Application Monitoring: Step-by-Step
A monitoring rollout that tries to instrument everything at once typically fails. This step-by-step approach from our SRE practice gets you to production-grade monitoring in 4–6 weeks without overwhelming your team:
Define your monitoring goals and SLOsBefore choosing any tools, define what "healthy" means for your application. Set Service Level Objectives (SLOs): e.g., "99.9% of requests complete in under 300ms." These will drive every alert threshold you configure.
Instrument your application (APM agent or OpenTelemetry)Install an APM agent (Datadog, New Relic) or instrument with OpenTelemetry SDK for vendor-neutral telemetry. Start with your most critical service or user-facing API. This takes 1–2 hours and immediately surfaces error rates and latency percentiles.
Deploy infrastructure monitoringUse Prometheus Node Exporter (Linux) or the cloud provider's native monitoring (CloudWatch, Azure Monitor) to collect host-level metrics. Configure a Grafana dashboard with the Four Golden Signals for each service.
Set up centralized log aggregationShip all application and infrastructure logs to a central store (ELK, Grafana Loki, Datadog Logs). Enforce structured JSON logging across services. Set up log-based alerts for critical error patterns and security events.
Configure alerts — start with just Resist the temptation to alert on everything. Start with five actionable, SLO-derived alerts: high error rate, high P95 latency, service down, disk full warning, and memory saturation. Each alert should have a runbook link. See the Alert Fatigue section below.
Integrate monitoring into your CI/CD pipelineAdd automated performance gates to your deployment pipeline. Configure rollback triggers if error rate exceeds baseline within 5 minutes of a deployment. Use synthetic tests to verify critical user journeys post-deploy.
Conduct weekly monitoring reviewsHold a 30-minute weekly review of alert noise, missed incidents, and dashboard usage. Prune alerts that fired but required no action (noise). Add alerts for any incident that wasn't caught by existing monitoring.
Alert Fatigue: The Silent Killer of Monitoring Programs
Alert fatigue is one of the most underappreciated risks in application monitoring. When too many alerts fire — especially for non-actionable conditions — on-call engineers begin ignoring them. The result is worse incident detection than having no alerting at all.
⚠️
Attention Required
The Alert Fatigue Trap
In a production incident post-mortem we conducted with a fintech client, their on-call team had received 1,400 alert notifications in a single week — of which fewer than 80 required any action. When the real outage hit, it was buried in noise. MTTR was 4 hours longer than it should have been.
How to Fight Alert Fatigue
The key principle: every alert must be actionable. If an alert fires and the on-call engineer has no action to take, the alert should not exist.
Anti-PatternSolutionAlerting on symptoms of symptomsAlert on user-facing Golden Signals onlyStatic thresholds on dynamic metricsUse anomaly detection / % change alertsAlerts without runbooksEvery alert must link to a documented responsePaging for non-urgent issuesRoute warnings to Slack, only page for criticalNo alert review cadenceWeekly 30-min alert hygiene reviewSame alert for dev and prodSeparate alert policies per environment
🔧
Gart SRE Insight
The "Would You Wake Up At 3AM?" Test
Before adding any alert to your on-call rotation, ask: "If this fires at 3am, would I be grateful for the wake-up call, or annoyed?" If the honest answer is "annoyed" — it belongs in a dashboard or Slack notification, not a PagerDuty page. This single test eliminates roughly 40% of alert noise in most environments we audit.
Production Monitoring Checklist
Use this checklist before declaring any service production-ready. It reflects the minimum viable monitoring baseline that our SRE team at Gart Solutions requires for all client deployments:
Infrastructure & Platform
CPU, memory, disk, and network metrics collected for all hosts/pods
Kubernetes cluster health monitored (node conditions, pod restarts, PVC usage)
Cloud provider resource quotas and limits tracked
Database connection pool utilization and slow query logs enabled
SSL/TLS certificate expiry monitoring configured (alert at 30 days)
Application Performance
APM agent deployed and reporting latency percentiles (P50, P95, P99)
Error rate tracking enabled with 5xx/4xx split
Distributed tracing configured for all service-to-service calls
External API dependency latency and error rates monitored
Background job / queue depth and processing latency tracked
Alerting & Response
All production alerts have linked runbooks
On-call rotation configured with escalation policies
Alert severity tiers defined (Critical → page, Warning → Slack)
Deployment-correlated alerting enabled (suppress noise during deploys)
SLO dashboards visible to both engineering and leadership
Synthetic & User Experience
Synthetic checks running against critical user journeys every 1 min
Real User Monitoring (RUM) capturing Core Web Vitals
Geographic availability monitoring from 3+ regions
Best Practices in Application Monitoring
Effective application monitoring requires a strategic approach and the adoption of best practices. Some key recommendations include:
Set SLO-Driven Alert Thresholds, Not Arbitrary Ones
Configure every alert threshold to correspond directly to an SLO violation — not a technical gut-feel. An alert that fires at "CPU > 80%" is meaningless without knowing whether that CPU level actually causes user impact.
Leverage AI/ML for Anomaly Detection
Modern platforms like Datadog and Dynatrace offer ML-based anomaly detection that adapts to your application's normal behavior patterns — including daily and weekly seasonality. This dramatically reduces false positives compared to static thresholds.
Monitor Across All Environments, Not Just Production
Extend monitoring to staging and even integration environments with proportionally relaxed thresholds. Catching a performance regression in staging before it reaches production is always cheaper than a production incident.
Instrument the Deployment Event
Always annotate your monitoring dashboards with deployment markers. The most common question during an incident is "was this caused by a recent deployment?" — having deployment events on your metrics timeline answers that question instantly.
Build Dashboards for the Right Audience
Create distinct dashboard views for different stakeholders: an SRE/on-call view (real-time alerts, error rates, latency breakdowns), an engineering view (per-service deep dives), and an executive view (SLO compliance, availability percentages, business impact metrics).
Test Your Monitoring — Before You Need It
Run regular "chaos" exercises where you intentionally trigger failure conditions (traffic spikes, kill a service, exhaust disk space) to verify that your alerts fire as expected and runbooks are accurate. Finding a broken alert during a drill is far better than during a real outage.
Optimize Your Application Performance with Expert Monitoring
Is your application running at its best? At Gart Solutions, we specialize in setting up robust monitoring systems tailored to your needs. Whether you’re looking to enhance performance, minimize downtime, or gain deeper insights into your application’s health, our team can help you configure and implement comprehensive monitoring solutions.
Gart Solutions Case Studies
Theory is useful. Real outcomes are better. Here are two recent engagements from Gart Solutions' monitoring practice:
Case Study 1 · B2C SaaS
Centralized Monitoring for a Global Music Platform
Challenge
A music platform serving millions of concurrent users globally had zero visibility into regional performance. Incidents were discovered by users, not engineers. Infrastructure was split across multiple AWS regions with no unified observability.
Solution
Gart deployed a centralized monitoring architecture using AWS CloudWatch, Datadog APM, and Grafana dashboards providing regional health views. Custom SLO dashboards were created for engineering leadership.
Read the full case study →
60%
Reduction in MTTR
4→