Compliance Monitoring is the ongoing process of verifying that an organization's systems, processes, and people continuously adhere to regulatory requirements, internal policies, and industry standards — not just at audit time, but every day. For cloud-native and regulated businesses in 2026, it is the difference between a clean audit and a costly breach.
What is Compliance Monitoring?
Compliance monitoring is the systematic, continuous practice of evaluating whether an organization's operations, systems, and people conform to the laws, regulations, and internal standards that govern them. Unlike a one-time audit, compliance monitoring runs as an always-on feedback loop — collecting evidence, flagging exceptions, and enabling rapid remediation before regulators ever knock on the door.
The practice is critical across heavily regulated industries:
Healthcare — HIPAA, HITECH, 21 CFR Part 11
Finance & Banking — PCI DSS, SOX, Basel III, MiFID II
Cloud & SaaS — SOC 2, ISO 27001, CSA CCM
EU-regulated entities — GDPR, NIS2, DORA
Energy & Utilities — NERC CIP, ISO 50001
Pharmaceuticals — GxP, FDA 21 CFR
💡 In short: Compliance monitoring is your organization's immune system. Audits are the annual check-up. Monitoring is what keeps you healthy between check-ups.
Why Compliance Monitoring Matters in 2026
Regulatory landscapes have never moved faster. GDPR fines reached record highs in 2024–2025, NIS2 entered enforcement mode across the EU, and DORA (Digital Operational Resilience Act) took effect for financial entities. Meanwhile, cloud adoption has created entirely new attack surfaces that traditional point-in-time audits simply cannot cover.
Risk Without MonitoringTypical Business ImpactProbability (unmonitored)Undetected misconfigured S3 bucket / cloud storageData breach, regulatory fine, brand damageHighStale privileged access not reviewedInsider threat, audit failure, SOX violationVery HighMissing audit log retentionInability to prove compliance, automatic audit failureHighBackup not testedUnrecoverable data loss, SLA breach, recovery failureMediumUnpatched critical CVE beyond SLAExploitable vulnerability, CVSS breach, PCI non-complianceHighWhy Compliance Monitoring Matters in 2026
Strong compliance monitoring builds trust with enterprise clients and partners, significantly reduces audit preparation time, and enables a proactive risk posture instead of a reactive, fire-fighting one.
Compliance Monitoring vs Compliance Audit vs Compliance Management
These three terms are often used interchangeably but they describe distinct activities that work together. Understanding the difference helps organizations allocate resources correctly.
DimensionCompliance MonitoringCompliance AuditCompliance ManagementFrequencyContinuous / near-real-timePeriodic (annual, quarterly)Ongoing governancePurposeDetect & alert on deviationsFormal independent assessmentPolicies, training, cultureOutputAlerts, dashboards, exception logsAudit report, findings, attestationPolicies, procedures, risk registerWho leadsEngineering / Security / DevOpsInternal audit / Third-party auditorCompliance Officer / GRC teamAnalogyBlood pressure cuff worn dailyAnnual physical with doctorHealthy lifestyle programCompliance Monitoring vs Compliance Audit vs Compliance Management
✅ Monitoring answers
Is MFA enforced right now?
Are all logs being retained?
Did anything change in IAM this week?
Are backups completing successfully?
Is encryption enabled on all storage?
📋 Auditing answers
Were controls effective over the period?
Did evidence satisfy the framework?
What is the organization's control maturity?
What formal findings require remediation?
Is the organization SOC 2 / ISO 27001 ready?
Explore our Compliance Audit services
The 7-Step Compliance Monitoring Process
Effective compliance monitoring is not a single tool or dashboard — it's a disciplined cycle. Here is the process Gart uses when setting up or maturing a client's compliance monitoring program:
1. Define Scope & Applicable Frameworks
Identify which regulations, standards, and internal policies apply. Map your systems, data flows, and third-party integrations to determine the monitoring perimeter. Ambiguous scope is the most common reason monitoring programs fail.
2. Inventory Systems & Controls
Catalogue all assets (cloud, on-prem, SaaS, CI/CD pipelines) and map each one to a control objective. Assign control owners. Without ownership, no one acts when an exception fires.
3. Define Evidence Collection Rules
For each control, specify what constitutes "evidence of compliance" — a log entry, a configuration state, a test result, a screenshot, or a signed document. Define collection frequency (real-time, daily, monthly) and acceptable format for auditors.
4. Instrument & Automate Collection
Deploy monitoring agents, SIEM rules, cloud policy engines (AWS Config, Azure Policy, GCP Security Command Center), and IaC scanning tools. Automate evidence collection wherever possible — manual evidence gathering at audit time is a costly, error-prone anti-pattern.
5. Monitor Exceptions & Triage Alerts
Create alert thresholds for control deviations. Not every alert is a breach — build a triage process that separates noise from genuine risk. Route high-priority exceptions to security/engineering immediately; lower-priority items to a weekly review queue.
6. Prioritize Risks & Remediate
Score exceptions by likelihood and impact. Maintain a risk register that tracks open findings, owners, and target remediation dates. Escalate unresolved critical findings to leadership with a clear business-impact framing.
7. Re-test, Report & Continuously Improve
After remediation, re-test the control to confirm it is effective. Produce compliance health reports for leadership and auditors. Run a quarterly retrospective to tune alert thresholds and update monitoring scope as regulations and infrastructure evolve.
Key Controls & Evidence to Monitor
Across hundreds of compliance engagements, the controls below consistently appear on auditor checklists. These are the areas where automated compliance monitoring delivers the highest return:
Control AreaWhat to MonitorEvidence Auditors WantRelevant FrameworksIdentity & Access (IAM)Privileged role assignments, inactive accounts, MFA status, service account permissionsAccess review logs, MFA adoption rate, least-privilege config exportsSOC 2, ISO 27001, HIPAAAudit LoggingLog completeness, retention period, tamper-evidence, SIEM ingestion healthLog retention policy, SIEM dashboard, CloudTrail / Audit Log exportsPCI DSS, SOX, NIS2, GDPREncryptionData-at-rest encryption on storage, TLS version on endpoints, key rotation schedulesEncryption config exports, key management audit logs, TLS scan reportsPCI DSS, HIPAA, GDPR, ISO 27001Patch ManagementCVE scan results, SLA adherence per severity, open critical/high vulnerabilitiesScan reports, patch cadence logs, SLA compliance metricsSOC 2, PCI DSS, ISO 27001Backup & RecoveryBackup job success rate, RPO/RTO test results, offsite replication statusBackup logs, recovery test records, DR test reportsSOC 2, ISO 22301, DORA, NIS2Vendor / Third-Party AccessActive vendor sessions, access scope, contract/NDA currency, SOC 2 report datesVendor access logs, contract register, third-party risk assessmentsISO 27001, SOC 2, GDPR, NIS2Network & PerimeterFirewall rule changes, open ports, egress filtering, WAF alert volumesFirewall config snapshots, IDS/IPS logs, pen test reportsPCI DSS, SOC 2, NIS2Incident ResponseMean time to detect (MTTD), mean time to respond (MTTR), breach notification timelinesIncident logs, CSIRT reports, post-mortemsGDPR (72h), NIS2, HIPAA, DORAKey Controls & Evidence to Monitor
Continuous Compliance Monitoring for Cloud Environments
Cloud infrastructure changes constantly — teams spin up resources, update IAM policies, and deploy code multiple times per day. This makes continuous compliance monitoring not a nice-to-have but a fundamental requirement. Manual checks against cloud state are obsolete before the ink dries.
AWS Compliance Monitoring — Key Automated Checks
AWS Config Rules — detect non-compliant resources in real time (e.g., unencrypted EBS volumes, public S3 buckets, missing CloudTrail)
AWS Security Hub — aggregates findings from GuardDuty, Inspector, Macie into a single compliance posture score
CloudTrail + Athena — query audit logs for unauthorized IAM changes, API calls outside approved regions
IAM Access Analyzer — surfaces external access to resources and unused roles/permissions
Azure Compliance Monitoring — Key Automated Checks
Azure Policy & Defender for Cloud — enforce and score compliance against CIS, NIST SP 800-53, ISO 27001 benchmarks
Microsoft Purview — data classification, governance, and audit trail across Azure and M365
Azure Monitor + Sentinel — SIEM-class alerting on suspicious activity with compliance-relevant playbooks
Privileged Identity Management (PIM) — just-in-time access with mandatory justification and approval workflows
GCP Compliance Monitoring — Key Automated Checks
Security Command Center — organization-wide misconfiguration detection and compliance benchmarking
VPC Service Controls — perimeter security policies that prevent data exfiltration
Cloud Audit Logs — immutable, per-service activity and data access logs
Policy Intelligence — recommends IAM role right-sizing based on actual usage data
🔗
For authoritative cloud security benchmarks, the CIS Benchmarks provide configuration baselines for AWS, Azure, GCP, Kubernetes, and 100+ other platforms — an industry-standard starting point for any cloud compliance monitoring program.
See Gart's Cloud Computing & Security services
Industry-Specific Compliance Monitoring Frameworks
Compliance monitoring requirements differ significantly by industry and geography. Below are the frameworks Gart's clients most commonly monitor against, along with the controls that require continuous (not just periodic) monitoring.
FrameworkIndustry / RegionKey Continuous Monitoring RequirementsResourcesISO 27001Global / All industriesAccess control review, log management, vulnerability scanning, supplier reviewISO.orgSOC 2 Type IISaaS / TechnologyContinuous availability, logical access, change management, incident responseAICPAHIPAAHealthcare (US)ePHI access logs, encryption at rest/transit, workforce activity auditsHHS.govPCI DSS v4.0Payment / E-commerceReal-time network monitoring, file integrity monitoring, quarterly vulnerability scansPCI SSCNIS2EU / Critical sectorsIncident detection within 24h, risk assessments, supply chain security checksENISAGDPREU / Global processing EU dataData subject request tracking, breach detection (<72h notification), processor auditsGDPR.euIndustry-Specific Compliance Monitoring Frameworks
How to prepare for a HIPAA Audit - Gart's PCI DSS Audit guide
First-Hand Experience
What We Usually Find During Compliance Monitoring Reviews
After reviewing postures across dozens of regulated environments, these are the patterns we encounter repeatedly — regardless of organization size.
👥
Incomplete or stale access reviews
Former employees and service accounts with active permissions weeks after departure. IAM hygiene is rarely automated, and reviews are often rubber-stamped.
📋
Missing backup test evidence
Backups appear healthy, but nobody has tested a restore in 6–18 months. Auditors want dated restore test logs with RPO/RTO outcomes, not just success metrics.
📊
Fragmented or incomplete audit logs
Gaps in the log chain (like disabled S3 data-event logging) make it impossible to reconstruct an incident or prove that one didn't happen.
🔔
Alert fatigue masking real issues
Thousands of low-fidelity alerts lead teams to mute notifications or build exceptions, inadvertently disabling detection for real threats.
📄
Policy-to-implementation gaps
Written policies say "encryption required," but reality reveals unencrypted legacy buckets. Continuous monitoring is the only way to detect this drift.
🔧
Automation is first patched, last monitored
CI/CD pipelines move faster than human reviewers. IaC repositories often lack policy-as-code scanning, leaving non-compliant resources active for months.
Featured Success Story
Case study: ISO 27001 compliance for Spiral Technology
→
Compliance Monitoring Tools & Automation
The right tooling depends on your stack, frameworks, and team maturity. Most organizations use a layered approach rather than a single platform:
CategoryRepresentative ToolsBest ForCloud Security Posture Management (CSPM)AWS Security Hub, Wiz, Prisma Cloud, Orca Security, Defender for CloudCloud misconfiguration detection, continuous benchmarkingSIEM / Log ManagementSplunk, Elastic SIEM, Microsoft Sentinel, Datadog SecurityLog correlation, anomaly detection, audit evidenceGRC PlatformsVanta, Drata, Secureframe, ServiceNow GRC, OneTrustEvidence collection automation, audit-ready reportingPolicy-as-Code / IaC ScanningOpen Policy Agent (OPA), Checkov, Terrascan, tfsec, ConftestPrevent non-compliant infrastructure from being deployedVulnerability ManagementTenable Nessus, Qualys, AWS Inspector, Trivy (containers)CVE detection, patch SLA monitoring, container scanningIdentity GovernanceSailPoint, CyberArk, Azure PIM, AWS IAM Access AnalyzerAccess reviews, least-privilege enforcement, PAM
⚠️ Tool sprawl is a compliance risk: More tools mean more integrations to maintain, more alert queues to manage, and more places where evidence can fall through the cracks. Start with native cloud tools and expand deliberately. The Linux Foundation and CNCF maintain open-source compliance tooling for cloud-native environments worth evaluating before adding commercial licenses.
Compliance Monitoring Best Practices
1. Shift compliance left into the development pipeline
The cheapest time to catch a compliance violation is before the resource is deployed. Integrate policy-as-code scanning (OPA, Checkov) into your CI/CD pipeline so that non-compliant Terraform or Helm charts never reach production. Treat compliance failures as build-breaking errors, not post-deploy recommendations.
2. Automate evidence collection — not just detection
Detection without evidence collection is useless at audit time. Configure your monitoring tools to export and archive compliance evidence (configuration snapshots, access review logs, scan reports) automatically to an immutable store. Auditors need evidence from a defined period — not a screenshot taken the morning of the audit.
3. Assign control owners, not just tool owners
Every control needs a named human owner who is accountable for exceptions. When an alert fires that MFA is disabled on a privileged account, "the security team" is not a sufficient owner — a specific person must be on call to investigate and remediate within the SLA.
4. Tune alerts ruthlessly to eliminate fatigue
Compliance monitoring programs that generate thousands of daily alerts quickly become ignored. Start with a small set of high-fidelity, high-impact alerts. Expand incrementally after each is tuned to near-zero false positive rates. A team that responds to 20 real alerts per day is more secure than one drowning in 2,000 noisy ones.
5. Monitor your monitoring
Monitoring pipelines break silently. Log shippers stop, API rate limits are hit, SIEM ingestion queues fill up. Build meta-monitoring to detect when evidence collection or alerting pipelines have gaps — and treat those gaps as compliance findings in their own right.
6. Conduct a quarterly compliance posture review
Beyond continuous automated monitoring, schedule a quarterly human review of the compliance posture. Review open exceptions, re-assess risk scores, retire obsolete controls, and update monitoring scope to cover new systems and regulatory changes.
Compliance Monitoring Checklist for Cloud Teams
A starting point for cloud-first compliance. Each item requires a named owner, a monitoring cadence, and a defined evidence artifact.
✓
MFA enforced on all privileged and administrative accounts
✓
Access reviews completed for all privileged roles (minimum quarterly)
✓
Service accounts audited for least-privilege and no unused permissions
✓
Audit logging enabled and retained (90 days min; 1 year for PCI/HIPAA)
✓
SIEM ingestion health monitored — no silent log gaps
✓
Data-at-rest encryption confirmed on all storage (S3, RDS, EBS, blobs)
✓
TLS 1.2+ enforced; TLS 1.0/1.1 disabled on all endpoints
✓
Encryption key rotation scheduled and verified
✓
Vulnerability scans run weekly; critical/high CVEs remediated within SLA
✓
Patch management SLA compliance tracked and reported
✓
Backups verified complete daily; restore tests documented quarterly
✓
DR test completed at least annually; RPO/RTO outcomes logged
✓
No public cloud storage buckets without explicit business justification
✓
Firewall change log reviewed; unauthorized rule changes alerting
✓
Vendor/third-party access scoped, time-limited, and reviewed quarterly
✓
Incident response plan tested; MTTD and MTTR tracked
✓
Policy-as-code scans integrated into CI/CD pipelines
✓
Compliance evidence archived in immutable storage for audit period
✓
Monitoring pipeline health checked — no silent collection failures
✓
Quarterly posture review conducted with named control owners
Gart Solutions · Compliance Monitoring Services
How Gart Helps You Build a Continuous Compliance Monitoring Program
We work with CTOs, CISOs, and engineering leaders to design, implement, and run compliance monitoring programs that hold up under real auditor scrutiny — not just on paper.
🗺️
Scope & Framework Mapping
We identify applicable frameworks (ISO 27001, SOC 2, HIPAA, PCI DSS, NIS2, GDPR) and map your cloud infrastructure to each control objective.
🔧
Monitoring Setup & Automation
We deploy CSPM tools, SIEM rules, and policy-as-code pipelines — so evidence is collected automatically, not manually on audit day.
📊
Gap Analysis & Risk Register
We deliver a clear view of your current compliance posture, prioritized by risk, with a remediation roadmap and accountable owners.
🔄
Ongoing Reviews & Readiness
Monthly exception reviews and pre-audit evidence packages — so you're never scrambling the week before an official audit.
☁️
Cloud-Native Expertise
AWS, Azure, GCP, Kubernetes, and CI/CD. We speak infrastructure as code and translate compliance into DevOps workflows.
📋
Audit-Ready Deliverables
Exception logs, risk matrices, and control evidence archives. Everything formatted for the specific framework you're being audited against.
Get a Compliance Audit
Talk to an Expert
Fedir Kompaniiets
Co-founder & CEO, Gart Solutions · Cloud Architect & DevOps Consultant
Fedir is a technology enthusiast with over a decade of diverse industry experience. He co-founded Gart Solutions to address complex tech challenges related to Digital Transformation, helping businesses focus on what matters most — scaling. Fedir is committed to driving sustainable IT transformation, helping SMBs innovate, plan future growth, and navigate the "tech madness" through expert DevOps and Cloud managed services. Connect on LinkedIn.
DevOps monitoring is the continuous practice of collecting, analyzing, and acting on telemetry data from every layer of your software delivery system — infrastructure, applications, pipelines, and user experience. It is the operational nervous system that connects what your team ships with how that software actually behaves in production.
Without effective DevOps monitoring, you are flying blind. You ship code and hope it works. You hear about incidents from users, not dashboards. You spend hours — not minutes — isolating root causes. In a CI/CD world, where releases happen daily or even hourly, that is simply not a viable operating model.
At Gart, we have designed and audited monitoring stacks for SaaS platforms, healthcare systems, fintech products, and Kubernetes-native environments across AWS, Azure, and GCP. This guide distills those lessons into a practical reference: what to monitor, which frameworks to apply, which tools to choose, and what patterns to avoid.
If you are assessing your entire infrastructure health, not just monitoring, see our IT Audit Services — the starting point for many of our cloud optimization engagements.
What is DevOps Monitoring?
DevOps monitoring is the ongoing process of tracking the health, performance, and behavior of systems and software across the full DevOps lifecycle — from code commit and CI/CD pipeline to production infrastructure and end-user experience — to enable rapid detection, diagnosis, and resolution of issues.
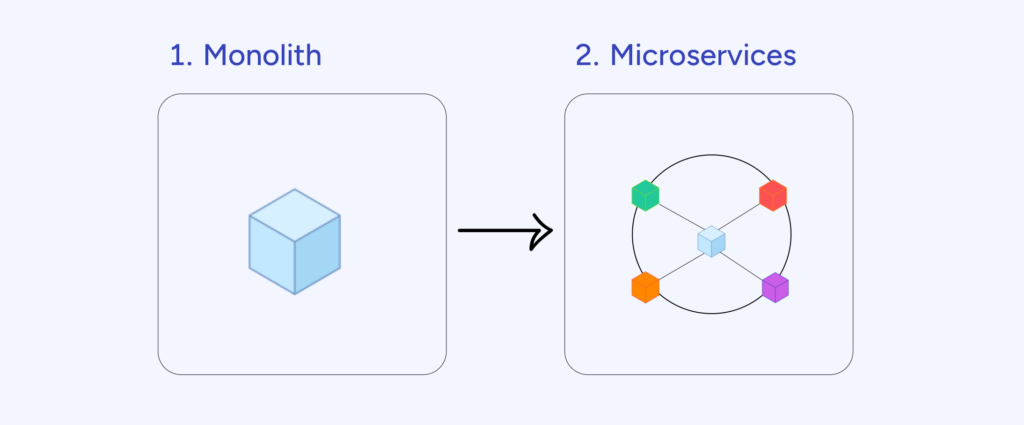
It covers the entire technology stack: cloud resources, servers, containers, microservices, databases, networks, application code, and deployment pipelines. The goal is always the same — turn raw system data into actionable insight before a problem reaches your users.
DevOps monitoring is not a passive activity. It drives decisions: when to scale, when to roll back a deployment, when to page an engineer, and when to invest in architecture changes. In mature teams, monitoring outputs feed directly into planning — influencing sprint priorities and capacity forecasts.
DevOps Monitoring vs Observability vs SRE
These three terms are often used interchangeably, but they describe distinct — and complementary — disciplines.
ConceptCore QuestionPrimary OutputsWho Owns ItDevOps MonitoringIs the system healthy right now?Dashboards, alerts, uptime metricsDevOps / Platform teamsObservabilityWhy is the system behaving this way?Distributed traces, structured logs, high-cardinality metricsEngineering teams broadlySRE (Site Reliability Engineering)What is our acceptable risk level, and are we within it?SLOs, error budgets, runbooks, postmortemsSRE / Reliability teams
Monitoring tells you what is happening. Observability helps you understand why it is happening. SRE defines how much failure is acceptable. A mature DevOps organization needs all three working in concert. The Cloud Native Computing Foundation (CNCF) provides a useful open-source landscape for understanding how these disciplines intersect with tooling choices.
Why Monitoring Matters in a DevOps Lifecycle
The DevOps philosophy — ship fast, iterate continuously, fail safely — only holds up when you can see what is happening in production. Here is the business case, without the fluff.
Reduced MTTD and MTTR. Mean time to detect (MTTD) and mean time to resolve (MTTR) are the two most important incident metrics. Centralized monitoring with clear alerting cuts both, often dramatically. In a recent Gart engagement with a cloud-native SaaS platform, migrating from siloed per-service alerts to a unified observability stack reduced MTTD from 22 minutes to under 4.
Deployment confidence. With solid monitoring in place, teams can deploy more frequently because they know they will catch regressions immediately — before users do.
Proactive capacity planning. Trend analysis on CPU, memory, and request volume lets you scale ahead of demand rather than reacting to overloaded nodes.
Compliance and auditability. Regulatory frameworks — including HIPAA, PCI-DSS, and SOC 2 — require detailed audit logs. Monitoring infrastructure naturally produces these artefacts.
Cost control. Visibility into resource utilization reveals waste: idle EC2 instances, over-provisioned RDS clusters, log storage costs that crept up unnoticed.
Key Takeaway: DevOps monitoring is not a cost centre — it is the mechanism by which engineering teams maintain delivery speed without sacrificing reliability.
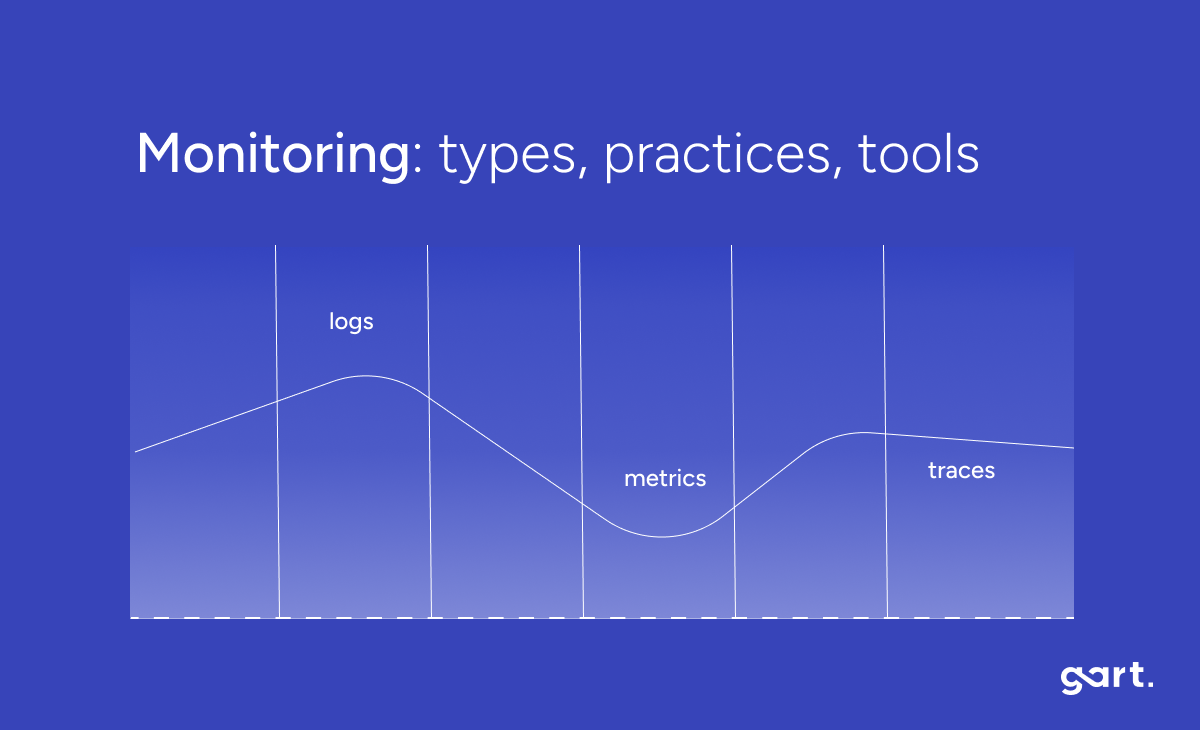
The Three Pillars: Metrics, Logs & Traces
All DevOps monitoring telemetry ultimately maps to three signal types. Understanding them is the foundation for designing any monitoring architecture. The OpenTelemetry project has made significant progress in standardizing how all three are collected and correlated.
📊
Metrics
Numerical data points sampled over time. CPU at 78%, p95 API latency at 320ms, request rate at 1,400 RPS. Ideal for alerting and trend visualization. Cheap to store and fast to query.
📄
Logs
Timestamped records of events. Application errors, user actions, deployment events. Rich in context but expensive at scale. Structured logs (JSON) are far easier to query than unstructured text.
🔗
Traces
End-to-end records of a request as it flows through distributed services. Essential for diagnosing latency in microservices where a single user action touches ten or more services.
The goal is correlation: when an alert fires, you should be able to jump from the metric spike to the relevant logs and the distributed trace for the same time window. Tools like Grafana, Datadog, and Dynatrace increasingly make this three-way correlation a single click.
Best Practices for Each Pillar
Metrics: Define which metrics map to business outcomes before wiring up dashboards. Avoid cardinality explosions — labels with unbounded values (user IDs, request IDs) can cripple Prometheus at scale.
Logs: Use structured logging (JSON) from day one. Centralize with ELK Stack(Elasticsearch, Logstash, Kibana) or Grafana Loki. Never log sensitive PII — build a scrubbing layer into your log pipeline.
Traces: Instrument with OpenTelemetry from the start — it gives you vendor-neutral traces exportable to Jaeger, Zipkin, Tempo, Datadog, or any other backend. Sample intelligently: 100% trace volume is rarely justified and gets expensive fast.
Golden Signals, RED & USE Methods
Rather than monitoring everything, mature DevOps teams use structured frameworks to pick the right metrics. These are the three most widely adopted.
FrameworkMetricsBest Applied ToGolden Signals(Google SRE Book)Latency, Traffic, Errors, SaturationUser-facing services, APIs, external endpointsRED MethodRate, Errors, DurationMicroservices, request-driven workloadsUSE MethodUtilization, Saturation, ErrorsInfrastructure resources (CPU, memory, disk, network)
In practice, most teams combine all three. Use the USE method to watch your nodes and pods, the RED method to watch your microservices, and Golden Signals to define the SLIs you report to the business.
Types of DevOps Monitoring
Effective monitoring spans every layer of the technology stack. Missing any layer creates blind spots that will eventually surface as incidents.
Cloud Level Monitoring
Tracks the health, cost, and compliance of cloud provider resources. Each major cloud offers native tooling as a baseline.
AWS: CloudWatch (metrics, logs, alarms, dashboards), X-Ray (tracing), Config (compliance), Cost Explorer (spend).
Azure: Azure Monitor (metrics + logs), Application Insights (APM), Sentinel (security), Cost Management.
GCP: Cloud Monitoring + Cloud Logging (formerly Stackdriver), Error Reporting, Cloud Trace. Detailed documentation is available in the Google Cloud Operations Suite.
Native cloud monitoring is a solid starting point, but it rarely provides a unified view across multi-cloud environments or integrates well with application-layer telemetry. Most mature teams complement it with an independent observability platform.
Infrastructure Level Monitoring
Covers physical and virtual servers, databases, networking equipment, and storage. Key metrics to track at this layer: CPU utilization, memory usage, disk I/O and capacity, network throughput and packet loss, process health, and database connection pool exhaustion. Tools like Prometheus with node_exporter are the open-source default for this layer.
Container & Orchestration Monitoring (Kubernetes)
Kubernetes environments require monitoring at multiple sub-layers simultaneously: cluster nodes, individual pods, deployments, services, and the control plane itself.
Pod restarts and OOMKill events
Node resource pressure and evictions
Deployment rollout status and error rates
Horizontal Pod Autoscaler (HPA) scaling events
Persistent volume claims and storage usage
Ingress request rates and error rates
The standard open-source stack here is kube-state-metrics + Prometheus + Grafana, often deployed via the kube-prometheus-stack Helm chart. For managed Kubernetes, native integrations (AWS EKS Container Insights, GKE Managed Prometheus) reduce the operational overhead.
Application Performance Monitoring (APM)
APM focuses on how your code behaves at runtime: response times, error rates, database query performance, external API latency, memory leaks, and thread deadlocks. It provides the application-level context that infrastructure metrics alone cannot give you. Popular APM platforms include New Relic, Datadog APM, Dynatrace, and the open-source Elastic APM.
Security Monitoring
Often treated separately, security monitoring should be an integrated layer: anomaly detection on authentication events, network traffic analysis, dependency vulnerability scanning in CI/CD, and runtime threat detection in containers (Falco is the open-source leader here).
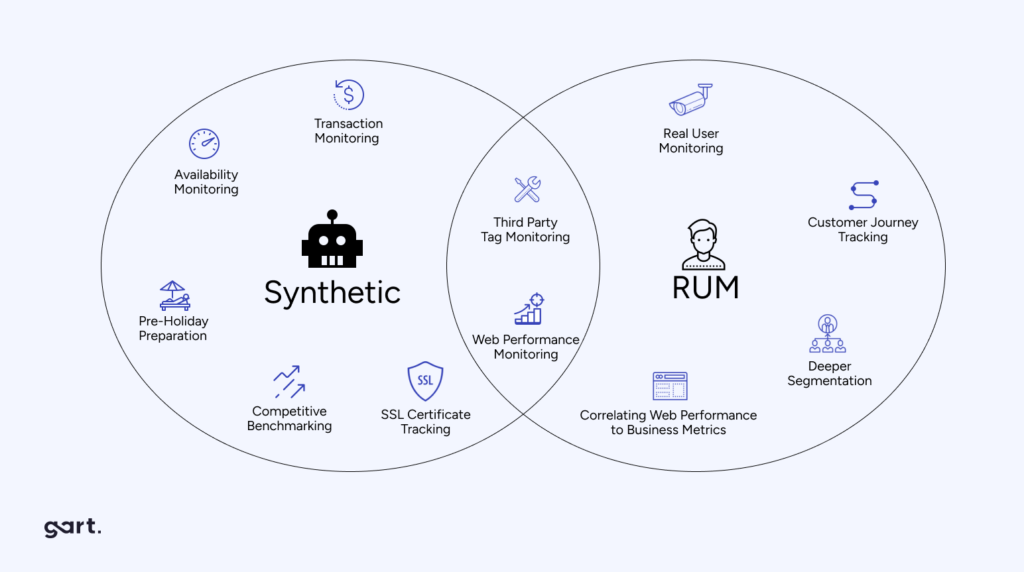
User Experience & Synthetic Monitoring
Backend health does not guarantee good user experience. Synthetic monitoring runs scripted user journeys against your application from multiple geographic locations to measure availability and performance as users actually experience it. Combine this with Real User Monitoring (RUM) to capture field data from actual browser and mobile sessions.
How to Monitor CI/CD Pipelines
This is one of the most underserved areas in typical DevOps monitoring setups. Teams instrument their production systems carefully but leave their delivery pipelines nearly opaque. If you cannot see what is happening in your CI/CD pipelines, you cannot improve deployment velocity or catch quality regressions early.
Key CI/CD Metrics to Track
Deployment frequency: how often you successfully ship to production.
Lead time for changes: time from code commit to production deployment.
Change failure rate: percentage of deployments causing a production incident or rollback.
MTTR (Mean Time to Restore): how long it takes to recover from a production failure.
Build duration trends: slow CI is a developer experience and productivity problem.
Test flakiness rate: unreliable tests erode trust in the pipeline and get ignored.
These four metrics — frequency, lead time, failure rate, MTTR — are the DORA metrics established by the research community via the Linux Foundation and DevOps Research & Assessment group. They are the industry standard for measuring DevOps performance.
How to Implement It
Most CI platforms (GitHub Actions, GitLab CI, Jenkins, CircleCI) can export pipeline events and durations to Prometheus via exporters or webhooks. From there, Grafana dashboards surface the DORA metrics in near-real-time. If you use Datadog or New Relic, both have native CI visibility integrations.
SLIs, SLOs & Error Budgets
Without SLOs, monitoring produces data without direction. SLOs (Service Level Objectives) are the mechanism that connects your monitoring to business outcomes.
SLI (Service Level Indicator): a specific metric used to measure service health. Example: "the proportion of API requests completed in under 500ms."
SLO (Service Level Objective): the target for that metric. Example: "99.5% of API requests must complete in under 500ms, measured over a rolling 28-day window."
Error Budget: the allowable failure rate implied by the SLO. A 99.5% SLO means you have a 0.5% error budget — approximately 3.6 hours of downtime per month. When the budget is exhausted, reliability work takes priority over feature development.
SLO-based alerting is far more actionable than threshold alerting. Instead of alerting when CPU exceeds 80%, you alert when your error budget burn rate is high enough to exhaust the monthly budget within 24 hours — giving your team time to act before users are significantly impacted.
What to Monitor by Team Stage
Monitoring needs differ significantly depending on where your organization is in its DevOps maturity journey. This practical framework — based on patterns we observe in client engagements — helps teams prioritize correctly rather than trying to build enterprise-grade observability on day one.
Stage 1
Startup / Early Stage
Basic uptime checks (Uptime Robot, Freshping)
Error rate from application logs
CPU & memory per server/container
Deployment success / failure
On-call via simple alerting (Slack / PagerDuty)
Stage 2
Scale-Up
Prometheus + Grafana for metrics
Centralized log aggregation (Loki or ELK)
APM on all user-facing services
Basic SLOs defined for critical paths
CI/CD pipeline metrics & failure rates
Database slow-query monitoring
Stage 3
Enterprise / Mature
Full distributed tracing (OpenTelemetry)
SLO-based alerting with error budgets
Synthetic monitoring + RUM
Security monitoring (Falco, SIEM integration)
FinOps dashboards (cost per service)
Chaos engineering with observability validation
DevOps Monitoring Tools Compared
This guide is based on Gart's experience designing monitoring stacks for cloud and Kubernetes environments, combined with vendor documentation and public best practices. Tool selection should reflect your team's maturity, budget, and cloud footprint — there is no universally correct choice.
ToolBest ForPricing ModelStrengthsLimitationsPrometheusMetrics collection, KubernetesFREE / OSSPull-based, powerful query language (PromQL), huge ecosystemNo long-term storage natively; high cardinality causes performance issuesGrafanaVisualization & dashboardsFREE OSS + SAASMulti-source dashboards, plugins, alerting, Grafana CloudDashboard sprawl without governance; alerting UX not always intuitiveGrafana LokiLog aggregationFREE OSS + SAASCost-efficient (indexes labels, not content), Grafana-nativeFull-text search slower than Elasticsearch; less mature than ELKELK StackLog search & analyticsFREE OSS + SAASPowerful full-text search, Kibana analytics, mature ecosystemResource-heavy, operationally complex, storage costs grow fastDatadogFull-stack observabilityPER HOST / GBBest-in-class UX, unified metrics/logs/traces/APM, AI featuresExpensive at scale; vendor lock-in risk; bill shock without governanceNew RelicAPM & user monitoringPER USER / USAGEDeep transaction tracing, browser/mobile RUM, syntheticsPricing model changed significantly; can be costly for large teamsDynatraceEnterprise AI-driven monitoringPER HOST / DEM UNITAI-powered root cause analysis (Davis), auto-discovery, full-stackPremium pricing, complex licensing, steep learning curveJaeger / TempoDistributed tracingFREE / OSSOpenTelemetry-native, vendor-neutral, Grafana Tempo integrates seamlesslyJaeger: operational complexity; Tempo: queries slower without search indexOpenTelemetryInstrumentation standardFREE / OSSVendor-neutral, covers metrics/logs/traces, growing communityInstrumentation effort upfront; some language SDKs still maturingDevOps Monitoring Tools Compared
For most cloud-native teams starting out, a Prometheus + Grafana + Loki + Tempo stack provides comprehensive coverage at near-zero licensing cost. As you scale or need enterprise support, Datadog or Dynatrace become serious options — but budget accordingly.
Sample Monitoring Architecture for Kubernetes
For a production Kubernetes-based SaaS stack, this is the monitoring baseline we recommend and implement at Gart.
In practice: For a Kubernetes-based SaaS stack, the 12 signals we track in every production environment are pod restarts, OOMKill events, p95 API latency, queue depth, DB slow queries, deployment failure rate, HPA scaling events, node disk pressure, ingress error rate (5xx), trace error rate per service, log error volume, and customer-facing uptime. These map directly to the Four Golden Signals and cover the most common failure modes.
Architecture Overview
Collection layer: kube-state-metrics, node_exporter, cAdvisor → Prometheus; application logs → Promtail → Loki; traces via OpenTelemetry Collector → Grafana Tempo.
Storage layer: Prometheus with Thanos or VictoriaMetrics for long-term metrics retention; Loki for logs; S3-backed object storage for traces.
Visualization layer: Grafana with pre-built Kubernetes dashboards (Node Exporter Full, Kubernetes Cluster, per-service RED dashboards).
Alerting layer: Prometheus Alertmanager → PagerDuty / OpsGenie for on-call routing; Slack for informational alerts. Alert rules follow SLO burn rate logic, not simple thresholds.
Security layer: Falco for runtime threat detection; OPA/Kyverno for policy enforcement; audit logs shipped to the central log platform.
Common Monitoring Mistakes We See in Audits
These are the patterns that appear repeatedly in our infrastructure audits — across teams of all sizes and at all cloud maturity levels.
Monitoring only what is easy to collect, not what matters. CPU and memory metrics are collected everywhere, but deployment failure rates and user-facing latency are often absent. Start from the user and work inward.
Alert fatigue from threshold-only alerting. Setting a static alert at "CPU > 80%" generates noise during normal traffic spikes. SLO-based and anomaly-based alerting dramatically reduces false-positive rates.
No ownership of alerts. Alerts fire into a shared Slack channel with no assigned responder. Every alert needs an owner and a runbook — otherwise the team learns to ignore them.
Log volume without log value. Teams log everything at DEBUG level in production, generating gigabytes per hour of data that is never queried. Define what you actually need to debug incidents and log that, structured.
Treating monitoring as a set-and-forget task. Systems change. Deployments change the cardinality of your metrics. New services appear. Monitoring configurations need a regular review cycle — quarterly at minimum.
Cardinality explosions in Prometheus. Adding high-cardinality labels (user IDs, request IDs, session tokens) to Prometheus metrics is one of the fastest ways to crash a Prometheus instance. Label design matters as much as metric selection.
Ignoring monitoring costs. Log ingestion and storage in SaaS platforms (Datadog, Splunk) can become a significant budget item. Implement log sampling, retention policies, and cost dashboards alongside your observability stack.
Best Practices for DevOps Monitoring
Define monitoring requirements during sprint planning — not after deployment. Observability is a feature, not an afterthought.
Use the RED method for every new microservice from day one: instrument Rate, Errors, and Duration before the service goes to production.
Write runbooks for every alert that fires. If your team cannot describe what to do when an alert fires, the alert is not ready to go live.
Test your monitoring. Chaos engineering experiments (Chaos Monkey, Chaos Mesh) validate that your dashboards and alerts actually fire when something breaks.
Use OpenTelemetry for instrumentation from the start. It prevents vendor lock-in and gives you flexibility to swap backends as your needs evolve.
Implement log sampling in high-volume services. 100% log capture at 100,000 RPS is rarely necessary and is always expensive.
Review and prune dashboards regularly. A dashboard no one opens is a maintenance cost with no return.
Correlate monitoring data with deployment events. A spike in errors 3 minutes after a deployment is almost certainly caused by that deployment — your tools should surface this automatically.
Real-World Monitoring Use Cases
Music SaaS Platform: Centralized Monitoring at Scale
A B2C SaaS music platform serving millions of concurrent global users needed real-time visibility across a geographically distributed infrastructure. Gart integrated AWS CloudWatch and Grafana to deliver dashboards covering regional server performance, database query times, API error rates, and streaming latency per region. The result: proactive alerts eliminated operational interruptions during global release events, and the team gained the visibility needed to scale confidently. Read the full case study here.
Digital Landfill Platform: IoT-Scale Environmental Monitoring
The elandfill.io platform required monitoring of methane emission sensors across multiple countries, with strict regulatory compliance requirements. Gart designed a cloud-agnostic architecture using Prometheus for metrics, Grafana for per-country dashboards, and custom exporters to ingest IoT sensor data. Beyond improving emission forecasting accuracy, the monitoring infrastructure simplified regulatory compliance reporting — turning what was previously a manual audit process into an automated, continuous data stream. Read the full case study here.
Future of DevOps Monitoring
The trajectory of DevOps monitoring is moving in two parallel directions: greater automation and greater standardization.
AI-assisted anomaly detection is already commercially available in platforms like Dynatrace (Davis AI), Datadog (Watchdog), and New Relic (applied intelligence). These systems learn baseline behavior for every service and surface deviations before they breach human-defined thresholds — reducing both MTTD and alert fatigue simultaneously.
OpenTelemetry as a universal standard is accelerating. Within the next few years, proprietary instrumentation agents will likely become optional for most teams — replaced by a single OpenTelemetry SDK that exports to any backend. This fundamentally changes the vendor dynamics of the observability market.
FinOps integration is the emerging frontier: teams increasingly want to see cost data as a monitoring signal — cost per request, cost per deployment, cost per team — sitting alongside performance and reliability data in the same observability platform.
Platform Engineering is changing who owns monitoring. As internal developer platforms mature, observability is becoming a platform capability delivered to product teams — rather than something each team configures independently.
Watch the webinar about Monitoring DevOps
Gart Solutions · DevOps & Cloud Engineering
Is Your Monitoring Stack Actually Working When It Matters?
Most teams discover monitoring gaps during an incident — not before. Gart's monitoring assessment identifies blind spots, alert fatigue, and missing SLOs across your cloud environment, then delivers a concrete roadmap.
🔍
Infrastructure & observability audit across AWS, Azure, and GCP
📐
Custom monitoring architecture design for your specific stack
🛠️
Implementation: Prometheus, Grafana, Loki, OpenTelemetry
📊
SLO definition, error budget alerting, and DORA metrics
☸️
Kubernetes-native monitoring for EKS, GKE, and AKS
⚡
Incident response runbooks and on-call process design
Book a Monitoring Assessment
Explore DevOps Services →
No commitment required — we start with a free 30-minute discovery call to understand your environment.
Roman Burdiuzha
Co-founder & CTO, Gart Solutions · Cloud Architecture Expert
Roman has 15+ years of experience in DevOps and cloud architecture, with prior leadership roles at SoftServe and lifecell Ukraine. He co-founded Gart Solutions, where he leads cloud transformation and infrastructure modernization engagements across Europe and North America. In one recent client engagement, Gart reduced infrastructure waste by 38% through consolidating idle resources and introducing usage-aware automation. Read more on Startup Weekly.
Site Reliability Engineering (SRE) monitoring and application monitoring are two sides of the same coin: both exist to keep complex distributed systems reliable, performant, and transparent. For engineering teams managing microservices, Kubernetes, and cloud-native architectures, knowing what to measure—and how to act on it—is the difference between a 15-minute incident and an all-night outage.
This guide explains how the four Golden Signals serve as the foundation of production-grade application monitoring, how to connect them to SLIs, SLOs, and error budgets, and how to build dashboards and alerting workflows that actually reduce your MTTR.
KEY TAKEAWAYS
Golden Signals (latency, errors, traffic, saturation) are the universal language of SRE application monitoring across any tech stack.
Connecting signals to SLIs and SLOs turns raw metrics into reliability commitments your team can own.
Alert thresholds must be derived from baseline data and SLOs—the examples in this article are illustrative starting points, not universal rules.
After implementing Golden Signals, Gart clients have reduced MTTR by up to 60% within two months. Read the full case study context below.
What is SRE Monitoring?
SRE monitoring is the practice of continuously observing the health, performance, and availability of software systems using the methods and principles defined by Google's Site Reliability Engineering discipline. Unlike traditional system monitoring—which often tracks dozens of low-level infrastructure metrics—SRE monitoring is intentionally opinionated: it focuses on the signals that directly reflect user experience and system reliability.
At its core, SRE monitoring answers three questions at all times:
Is the system currently serving users correctly?
How close are we to breaching our reliability commitments (SLOs)?
Which service or component is responsible when something breaks?
This user-centric orientation is what separates SRE monitoring from generic infrastructure monitoring. An SRE team does not alert on "CPU at 80%"—they alert when that CPU spike is burning through their monthly error budget faster than expected.
Application Monitoring in the SRE Context
Application monitoring is the discipline of tracking how software applications behave in production: response times, error rates, throughput, resource consumption, and end-user experience. In an SRE context, application monitoring is the primary layer where Golden Signals are measured and where the gap between infrastructure health and user experience becomes visible.
A database node may be running at 40% CPU—perfectly healthy by infrastructure standards—while every query takes 4 seconds because of a missing index. Infrastructure monitoring shows green; application monitoring shows a latency crisis. This is why SRE teams invest heavily in application-level telemetry: it captures what infrastructure metrics miss.
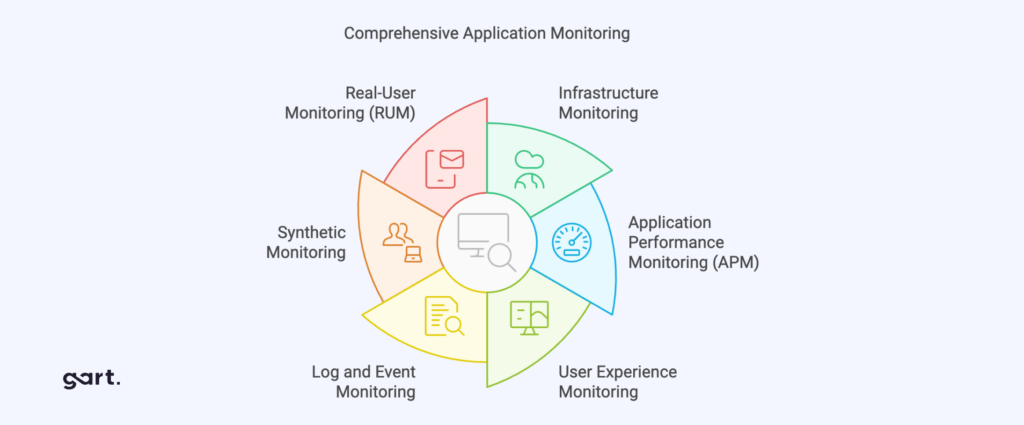
Modern application monitoring spans three pillars:
Metrics — numerical time-series data (latency percentiles, error counts, RPS).
Logs — structured event records that capture request context and error detail.
Traces — distributed request journeys that map latency across service boundaries.
The Golden Signals framework unifies these pillars into four actionable categories that any team can monitor, regardless of their technology stack.
The Four Golden Signals in SRE
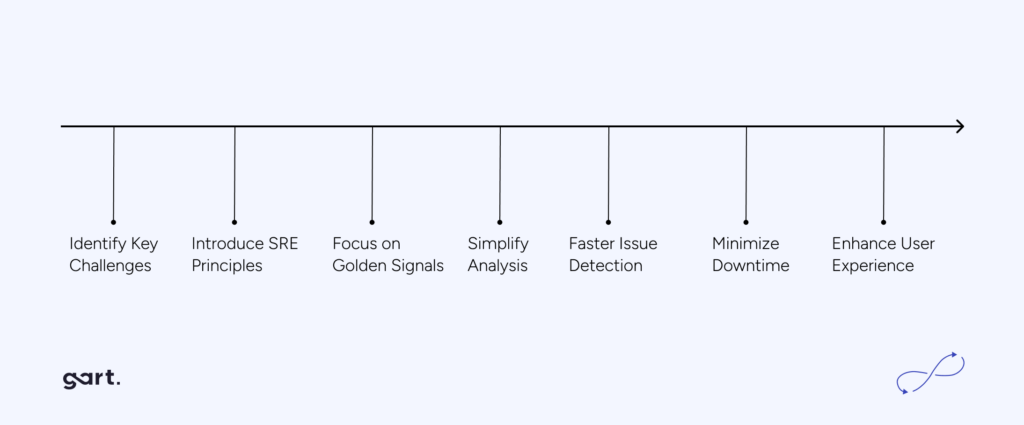
SRE principles streamline application monitoring by focusing on four metrics—latency, errors, traffic, and saturation—collectively known as Golden Signals. Instead of tracking hundreds of metrics across different technologies, this focused framework helps teams quickly identify and resolve issues.
Latency:Latency is the time it takes for a request to travel from the client to the server and back. High latency can cause a poor user experience, making it critical to keep this metric in check. For example, in web applications, latency might typically range from 200 to 400 milliseconds. Latency under 300 ms ensures good user experience; errors >1% necessitate investigation. Latency monitoring helps detect slowdowns early, allowing for quick corrective action.
Errors:Errors refer to the rate of failed requests. Monitoring errors is essential because not all errors have the same impact. For instance, a 500 error (server error) is more severe than a 400 error (client error) because the former often requires immediate intervention. Identifying error spikes can alert teams to underlying issues before they escalate into major problems.
Traffic:Traffic measures the volume of requests coming into the system. Understanding traffic patterns helps teams prepare for expected loads and identify anomalies that might indicate issues such as DDoS attacks or unplanned spikes in user activity. For example, if your system is built to handle 1,000 requests per second and suddenly receives 10,000, this surge might overwhelm your infrastructure if not properly managed.
Saturation:Saturation is about resource utilization; it shows how close your system is to reaching its full capacity. Monitoring saturation helps avoid performance bottlenecks caused by overuse of resources like CPU, memory, or network bandwidth. Think of it like a car's tachometer: once it redlines, you're pushing the engine too hard, risking a breakdown.
Why Golden Signals Matter
Golden Signals provide a comprehensive overview of a system's health, enabling SREs and DevOps teams to be proactive rather than reactive. By continuously monitoring these metrics, teams can spot trends and anomalies, address potential issues before they affect end-users, and maintain a high level of service reliability.
SRE Golden Signals help in proactive system monitoring
SRE Golden Signals are crucial for proactive system monitoring because they simplify the identification of root causes in complex applications. Instead of getting overwhelmed by numerous metrics from various technologies, SRE Golden Signals focus on four key indicators: latency, errors, traffic, and saturation.
By continuously monitoring these signals, teams can detect anomalies early and address potential issues before they affect the end-user. For instance, if there is an increase in latency or a spike in error rates, it signals that something is wrong, prompting immediate investigation.
What are the key benefits of using "golden signals" in a microservices environment?
The "golden signals" approach is especially beneficial in a microservices environment because it provides a simplified yet powerful framework to monitor essential metrics across complex service architectures.
Here’s why this approach is effective:
▪️Focuses on Key Performance Indicators (KPIs)
By concentrating on latency, errors, traffic, and saturation, the golden signals let teams avoid the overwhelming and often unmanageable task of tracking every metric across diverse microservices. This strategic focus means that only the most crucial metrics impacting user experience are monitored.
▪️Enhances Cross-Technology Clarity
In a microservices ecosystem where services might be built on different technologies (e.g., Node.js, DB2, Swift), using universal metrics minimizes the need for specific expertise. Teams can identify issues without having to fully understand the intricacies of every service’s technology stack.
▪️Speeds Up Troubleshooting
Golden signals quickly highlight root causes by filtering out non-essential metrics, allowing the team to narrow down potential problem areas in a large web of interdependent services. This is crucial for maintaining service uptime and a seamless user experience.
SRE Monitoring vs. Observability vs. Application Performance Monitoring (APM)
These three terms are often used interchangeably, but they refer to distinct practices with different scopes. Understanding where they overlap—and where they diverge—helps teams invest in the right tooling and processes.
DimensionSRE MonitoringObservabilityApplication Monitoring (APM)Primary questionAre we meeting our reliability targets?Why is the system behaving this way?How is this application performing right now?Core signalsGolden Signals + SLIs/SLOsLogs, metrics, traces (full telemetry)Response time, throughput, error rate, ApdexAudienceSRE / on-call engineersPlatform engineering, DevOps, SREDev teams, operations, managementTypical toolsPrometheus, Grafana, PagerDutyOpenTelemetry, Jaeger, ELK StackDatadog, New Relic, Dynatrace, AppDynamicsScopeService reliability & error budgetsFull system internal stateApplication transaction performanceSRE Monitoring vs. Observability vs. Application Performance Monitoring (APM)
In practice, mature engineering organizations treat these as complementary layers. Golden Signals surface what is wrong quickly; observability tooling explains why; APM dashboards give development teams actionable detail at the code level.
SLIs, SLOs, and Error Budgets in SRE Monitoring
Golden Signals generate raw measurements. SLIs and SLOs transform those measurements into reliability commitments that the business can understand and engineering teams can own.
Service Level Indicators (SLIs)
An SLI is a quantitative measure of a service behavior directly derived from a Golden Signal. For example:
Availability SLI: percentage of requests that return a non-5xx response.
Latency SLI: percentage of requests served in under 300ms (P95).
Throughput SLI: percentage of expected message batches processed within the SLA window.
Service Level Objectives (SLOs)
An SLO is the target value for an SLI over a rolling window. A well-formed SLO looks like: "99.5% of requests must return a non-5xx response over a rolling 28-day window." SLOs are the bridge between Golden Signals and business impact. When your SLO says 99.5% availability and you are at 99.2%, you are burning error budget—and that is the signal your team needs to prioritize reliability work over new features.
Error Budgets
An error budget is the allowable amount of unreliability defined by your SLO. For a 99.5% availability SLO over 28 days, the error budget is 0.5% of all requests—roughly 3.6 hours of complete downtime equivalent. When the error budget is healthy, teams can ship changes confidently. When it is depleted or burning fast, the SRE team has a data-driven mandate to freeze releases and focus on reliability.
Practical tip: Track error budget burn rate alongside your Golden Signals dashboard. A burn rate of 1x means you are consuming the budget at exactly the rate your SLO allows. A burn rate of 3x means you will exhaust your budget in one-third of the SLO window — an immediate escalation trigger.
How to Monitor Microservices Using Golden Signals
Monitoring microservices requires a disciplined approach in environments where dozens of services interact across different technology stacks. Golden Signals provide a clear framework for tracking system health across these distributed systems.
Step 1: Define Your Observability Pipeline per Service
Each microservice should expose telemetry for all four Golden Signals. Integrate them directly with your SLI definitions from day one:
Latency — measure P50, P95, and P99 request duration per service.
Errors — capture 4xx/5xx HTTP codes and application-level exceptions separately.
Traffic — monitor RPS, message throughput, and connection concurrency.
Saturation — track CPU, memory, thread pool usage, and queue depth.
Step 2: Choose a Unified Monitoring Stack
Popular platforms for production-grade application monitoring in microservices include:
Prometheus + Grafana — open-source, highly customizable, excellent for Kubernetes environments.
Datadog / New Relic — full-stack observability with built-in Golden Signals support and auto-instrumentation.
OpenTelemetry — CNCF-backed standard for vendor-neutral telemetry instrumentation.
Step 3: Isolate Service Boundaries
Group Golden Signals by service so you can detect where a problem originates rather than just knowing that something is wrong:
MicroserviceLatency (P95)Error RateTrafficSaturationAuth220ms1.2%5k RPS78% CPUPayments310ms3.1%3k RPS89% MemoryNotifications140ms0.4%12k RPS55% CPU
Step 4: Correlate Signals with Distributed Tracing
Use distributed tracing to map requests across services. Tools like Jaeger or Zipkin let you trace latency across hops, find the exact service causing error spikes, and visualize traffic flows and bottlenecks. A latency spike in the Payments service that traces back to a slow DB query is far more actionable than "P95 latency is high."
Learn how these principles apply in practice from our Centralized Monitoring case study for a B2C SaaS Music Platform.
Step 5. Automate Alerting with Context
Set thresholds and anomaly detection for each signal:
Latency > 500ms? Alert DevOps
Saturation > 90%? Trigger autoscaling
Error Rate > 2% over 5 mins? Notify engineering and create an incident ticket
Alerting Principles for SRE Teams
Effective application monitoring is only as useful as the alerting layer that translates signals into human action. Alert fatigue is one of the most common—and costly—failure modes in SRE programs. These principles help teams alert on what matters without overwhelming the on-call engineer.
Alert on Symptoms, Not Causes
Alert when the user experience is degraded (latency SLO is burning), not when a machine metric crosses a threshold. "CPU at 80%" is a cause; "P95 latency exceeding 500ms for 5 minutes" is a symptom your SLO cares about.
Use Error Budget Burn Rate as Your Primary Alert
A fast burn rate (e.g., 3x or 6x) on your error budget is a better paging condition than raw signal thresholds. It tells you not just that something is wrong, but how urgently you need to act based on your reliability commitments.
Sample Alert Thresholds (Illustrative Only)
SignalSample ThresholdSuggested ActionUrgencyLatency (P95)>500ms for 5 minPage on-call SREHighError Rate>2% over 5 minCreate incident ticket + notify engineeringHighSaturation (CPU)>90% for 10 minTrigger autoscaling policyMediumError Budget Burn3× rate for 1 hourIncident call, feature freeze considerationCritical
Methodology note: These thresholds are starting-point illustrations. Your production values should be calibrated against your own service baselines, user SLAs, and SLO definitions. A payment service tolerates far less latency than an async batch job.
Practical Application: Using APM Dashboards for SRE Monitoring
Application Performance Management (APM) dashboards integrate Golden Signals into a single view, allowing teams to monitor all critical metrics simultaneously. The operations team can use APM dashboards to get real-time insights into latency, errors, traffic, and saturation—reducing the cognitive load during incident response.
The most valuable APM features for SRE teams include:
One-hop dependency views — shows only the immediate upstream and downstream services of a failing component, dramatically narrowing the root-cause investigation scope and reducing MTTR.
Centralized Golden Signals panels — all four signals per service in one view, eliminating tool-switching during incidents.
SLO burn rate overlays — trend lines showing how quickly the error budget is being consumed, integrated alongside raw Golden Signals.
Proactive anomaly detection — ML-powered tools like Datadog and Dynatrace flag statistically unusual patterns before thresholds breach.
What is the Significance of Distinguishing 500 vs. 400 Errors in SRE Monitoring?
The distinction between 500 and 400 errors in application monitoring is fundamental to correct incident prioritization. Conflating them inflates your error rate SLI and may generate alerts that do not reflect actual service degradation.
Error TypeCauseSeveritySRE Response500 — Server errorSystem or application failureHighImmediate investigation, possible incident declaration400 — Client errorBad input, expired auth token, invalid requestLowerMonitor trends; investigate only on sustained spikes
A good SLI definition for errors counts only server-side failures (5xx) against your reliability budget. A sudden 400-error spike may signal a client SDK bug, a bot campaign, or a broken authentication flow—all worth investigating, but none of them are a service outage.
SRE Monitoring Dashboard Best Practices
A well-structured SRE dashboard makes or breaks incident response. It is not about displaying all available data—it is about surfacing the right insights at the right time. See the official Google SRE Book on monitoring for the principles that underpin these practices.
1. Prioritize Golden Signals and SLO Burn Rate at the Top
Place latency (P50/P95), error rate (%), traffic (RPS), and saturation front and center. Add SLO burn rate immediately below so engineers can assess reliability impact at a glance without scrolling.
2. Use Visual Cues Consistently
Color-code thresholds (green / yellow / red), use sparklines for trend visualization, and heatmaps to identify saturation patterns across clusters or availability zones.
3. Segment by Environment and Service
Separate production, staging, and dev views. Within production, segment by service or team ownership and by availability zone. This isolation dramatically reduces the time to pinpoint which service is responsible during an incident.
4. Link Metrics to Logs and Traces
Make your dashboards navigable: a latency spike should be one click away from the related trace in Jaeger, and a spike in errors should link directly to filtered log output in Kibana or Grafana Loki.
5. Provide Role-Appropriate Views
Use templating (Grafana variables, Datadog template variables) to serve multiple audiences from a single dashboard: SRE/on-call engineers need real-time signal detail; engineering teams need per-service deep dives; leadership needs SLO health summaries.
6. Treat Dashboards as Living Documents
Prune panels that nobody uses, reassess thresholds quarterly against updated baselines, and add deployment or incident annotations so that future engineers understand historical anomalies in context.
How Gart Implements SRE Monitoring in 30–60 Days
Generic best practices are helpful, but implementation details are where most teams struggle. Here is how Gart's SRE team approaches application monitoring engagements from day one, based on hands-on delivery experience across SaaS, cloud-native, and distributed environments—reviewed by Fedir Kompaniiets, Co-founder at Gart Solutions, who has designed monitoring and observability systems across multiple industries.
Days 1–14: Baseline and Instrumentation
Audit existing telemetry: what is already collected, what is missing, what is noisy.
Instrument all services with OpenTelemetry or native exporters for all four Golden Signals.
Deploy Prometheus + Grafana or connect to the client's existing observability platform.
Establish baseline latency, error rate, and saturation profiles per service under normal load.
Days 15–30: SLIs, SLOs, and Initial Alerting
Define SLIs for each critical service in collaboration with product and engineering stakeholders.
Draft SLOs and calculate initial error budgets based on business risk tolerance.
Configure symptom-based alerts (burn rate, not raw thresholds) with PagerDuty or Opsgenie routing.
Stand up the first three dashboards: overall service health, per-service Golden Signals, SLO burn rate.
Days 31–60: Noise Reduction and Handover
Tune alert thresholds against the observed baseline to eliminate alert fatigue.
Remove noisy, low-signal alerts that were generating false pages.
Integrate distributed tracing for the highest-traffic services.
Run a simulated incident to validate the monitoring stack end-to-end before handover.
Deliver runbooks and on-call documentation tied to each alert condition.
Real outcome: After implementing Golden Signals and SLO-based alerting for a B2C SaaS platform, the client reduced MTTR by 60% within two months. The primary driver was eliminating alert fatigue (previously 80+ daily alerts, reduced to 8 actionable ones) and linking every alert to a runbook with a clear first-responder action. Read the full context: Centralized Monitoring for a B2C SaaS Music Platform.
Watch How we Built "Advanced Monitoring for Sustainable Landfill Management"
Conclusion
Ready to take your system's reliability and performance to the next level? Gart Solutions offers top-tier SRE Monitoring services to ensure your systems are always running smoothly and efficiently. Our experts can help you identify and address potential issues before they impact your business, ensuring minimal downtime and optimal performance.
Gart Solutions · Expert SRE Services
Is Your Application Monitoring Ready for Production?
Engineering teams that invest in proper SRE monitoring and application monitoring reduce MTTR, protect error budgets, and ship with confidence. Gart's SRE team has designed and deployed monitoring stacks for SaaS platforms, Kubernetes-native environments, fintech, and healthcare systems.
60%
MTTR reduction for SaaS clients
30
Days to working SLO dashboards
99.9%
Availability target for managed clients
Our services cover the full monitoring lifecycle — from telemetry instrumentation and Golden Signal dashboards to SLO definition, alert tuning, and on-call runbooks.
Golden Signals Setup
SLI / SLO Definition
Prometheus + Grafana
Alert Tuning
Distributed Tracing
Kubernetes Monitoring
Incident Runbooks
Talk to an SRE Expert
Explore Monitoring Services
B2C SaaS Music Platform
Centralized monitoring across global infrastructure — 60% MTTR reduction in 2 months.
Digital Landfill Platform
Cloud-agnostic monitoring for IoT emissions data with multi-country compliance.
Fedir Kompaniiets
Co-founder & CEO, Gart Solutions · Cloud Architect & DevOps Consultant
Fedir is a technology enthusiast with over a decade of diverse industry experience. He co-founded Gart Solutions to address complex tech challenges related to Digital Transformation, helping businesses focus on what matters most — scaling. Fedir is committed to driving sustainable IT transformation, helping SMBs innovate, plan future growth, and navigate the "tech madness" through expert DevOps and Cloud managed services. Connect on LinkedIn.