Today enterprise technology operates inside a level of complexity that would have been unmanageable just a decade ago. Static monoliths have given way to ephemeral microservices, Kubernetes clusters span multiple clouds, and critical business workflows are executed across hundreds of loosely coupled components—many of which exist only for seconds at a time.
In this environment, traditional monitoring has reached its limits.
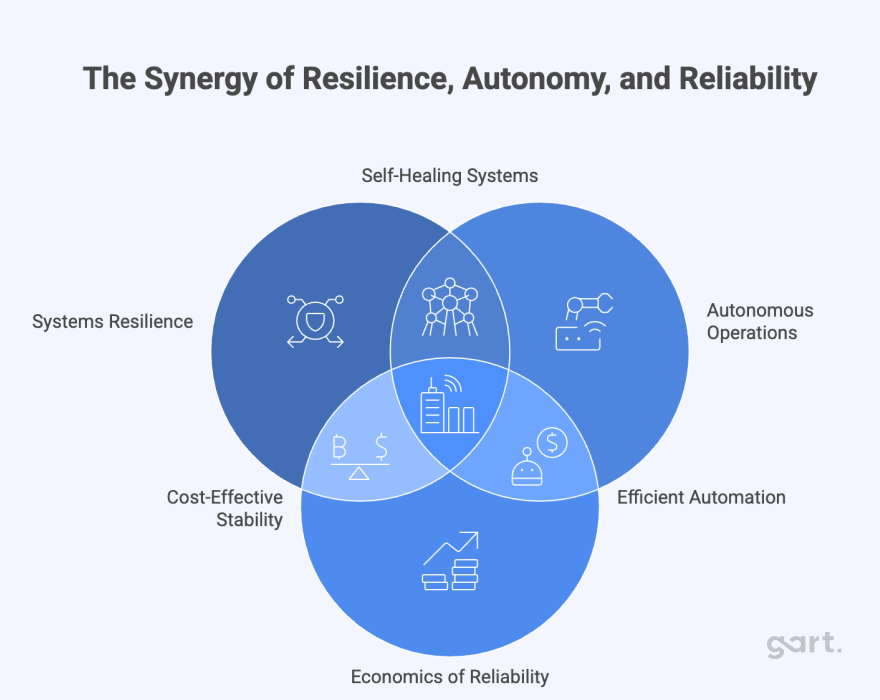
Observability has emerged not as a tooling upgrade, but as a strategic operating model—one that directly impacts revenue protection, customer trust, engineering productivity, and the long-term viability of digital platforms. For modern enterprises, observability is no longer a technical nice-to-have; it is a mission-critical business capability.
From Monitoring to Observability
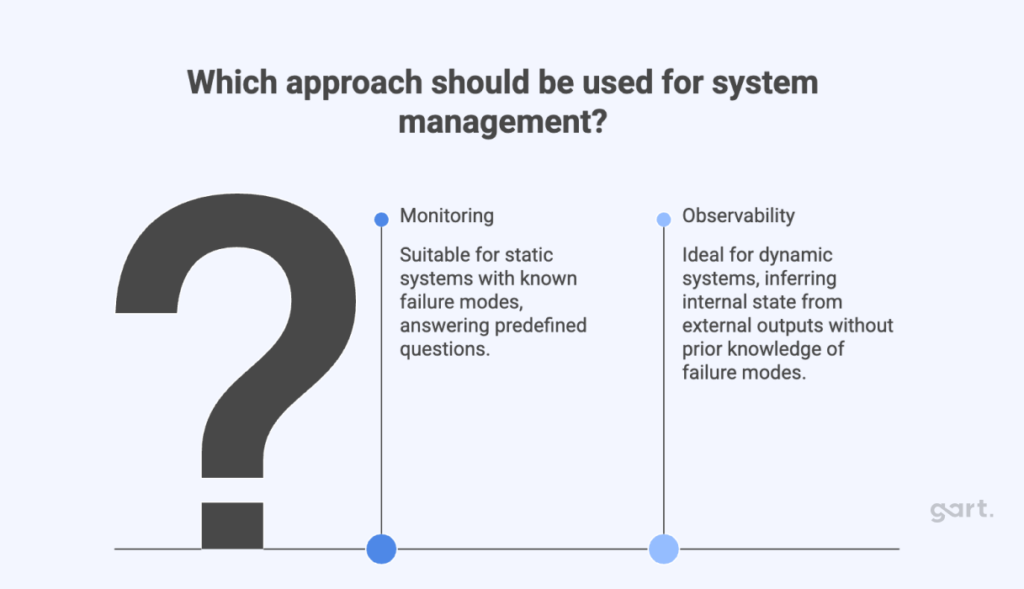
Monitoring was designed for a world of predictable systems. It answers predefined questions by watching known metrics and triggering alerts when thresholds are crossed. This approach works well when architectures are static and failure modes are understood in advance.
Modern systems are neither.
Observability represents a fundamental evolution:
the ability to infer the internal state of a system by analyzing its external outputs—without knowing the failure mode in advance.
Instead of asking “Did CPU spike?”, observability allows teams to ask “Why did latency increase for users in one region during a specific deployment?”—and answer it immediately.
Why Observability Is Now a Board-Level Concern
Downtime is no longer just a technical inconvenience. The average cost exceeds $5,600 per minute, and for high-scale digital businesses, the real impact is far higher when churn, SLA penalties, and reputational damage are factored in.
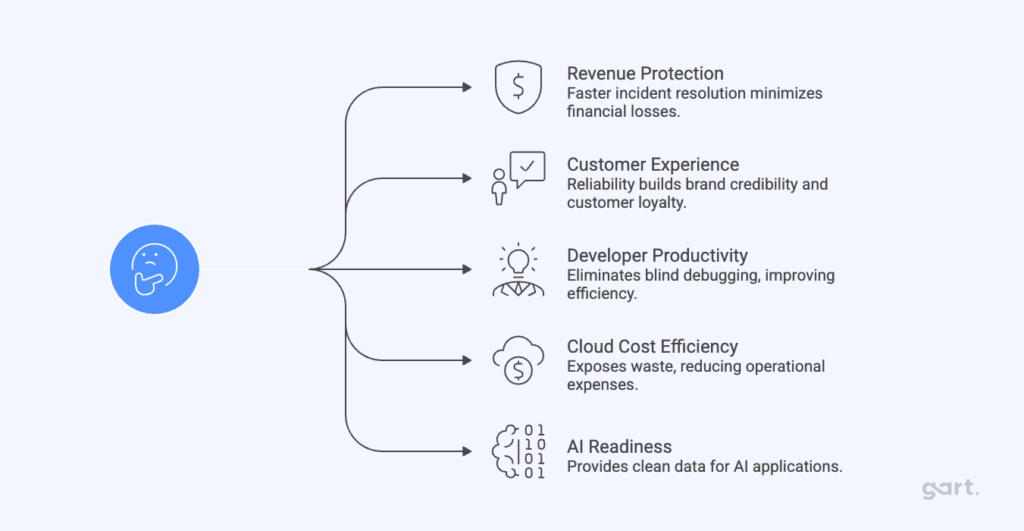
Observability directly influences:
- Revenue protection through faster incident resolution
- Customer experience, where reliability equals brand credibility
- Developer productivity, by eliminating blind debugging
- Cloud cost efficiency, by exposing waste and inefficiency
- AI readiness, by providing clean, correlated system data
For leadership teams, observability has become part of operational risk management, not just IT tooling.
The Technical Foundations: Beyond the Three Pillars
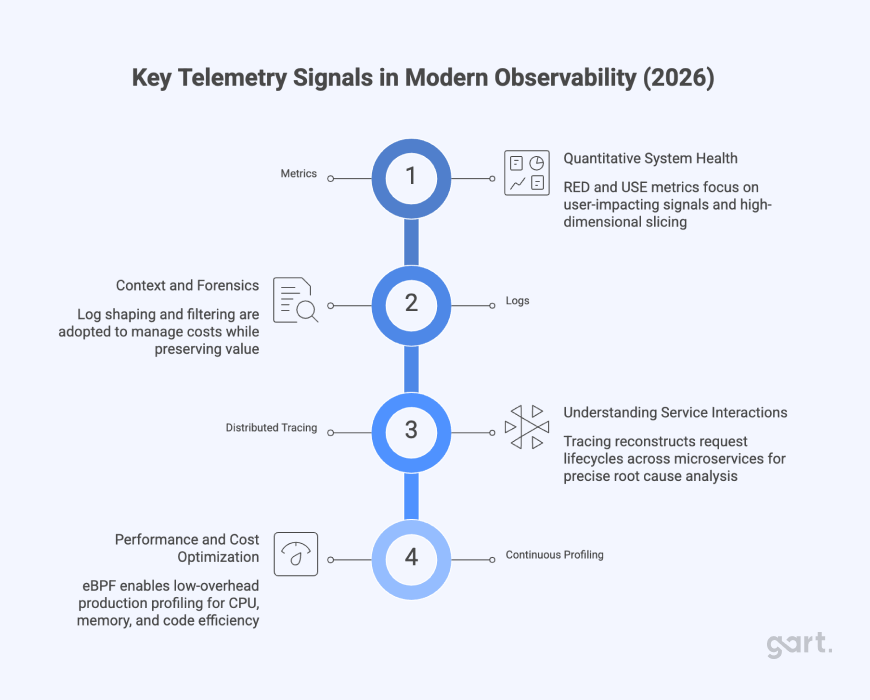
Modern observability is built on four core telemetry signals:
1. Metrics – Quantitative System Health
Metrics remain essential for alerting and long-term trend analysis. In 2026, the focus has shifted toward user-impacting signals:
- RED metrics: Request rate, Errors, Duration
- USE metrics: Utilization, Saturation, Errors
High-dimensional metrics—enriched with labels such as region, service version, or pod ID—allow precise slicing of system behavior without pre-aggregation.
2. Logs – Context and Forensics
Logs provide the narrative behind failures: error messages, stack traces, and execution context.
However, log volume has become a financial problem. Many enterprises now spend over half of their observability budget on logs alone, driving the adoption of log shaping, filtering, and edge processing to control costs while preserving value.
3. Distributed Tracing – Understanding Service Interactions
Tracing reconstructs the full lifecycle of a request across dozens of services, making it indispensable for microservice architectures.
Without tracing, teams know something is slow.
With tracing, they know exactly where and why.
4. Continuous Profiling – The Fourth Signal
The most impactful evolution of recent years is continuous profiling.
Using low-overhead techniques such as eBPF, profiling now runs safely in production, exposing:
- CPU hot paths
- Memory leaks
- Performance regressions
- Inefficient code execution
This enables teams to optimize both performance and cloud costs before users are affected.
eBPF: The Engine Behind Frictionless Observability
Extended Berkeley Packet Filter (eBPF) has become the foundational technology behind modern observability platforms.
By running verified programs directly in the Linux kernel, eBPF enables:
- Zero-code instrumentation
- Kernel-level visibility into networking, I/O, and system calls
- Near-native performance with minimal overhead
Why eBPF Changed Everything
Traditional observability relied heavily on sidecars and language-specific agents, creating operational overhead and inconsistent data. eBPF introduces node-level observability, where a single agent can observe all containers without modifying applications.
| Capability | Sidecar Model | eBPF Model |
|---|---|---|
| Instrumentation | Manual | Automatic |
| Resource overhead | High | Low |
| Language dependency | Yes | No |
| Deployment complexity | High | Minimal |
This shift has significantly reduced the “observability tax” in cloud-native environments.
OpenTelemetry: The End of Vendor Lock-In
By 2026, OpenTelemetry (OTel) has become the universal standard for telemetry collection.
Its impact is strategic, not just technical:
- Instrument once, send data anywhere
- Decouple data collection from analytics
- Force vendors to compete on insight, not lock-in
At the center of this ecosystem is the OpenTelemetry Collector, which now functions as a full telemetry policy engine—handling redaction, sampling, routing, and buffering at scale.
For enterprises, OpenTelemetry enables long-term architectural freedom, future-proofing observability investments.
Solving the Cardinality Problem with Unified Data Lakehouses
High-cardinality data—user IDs, request IDs, container IPs—is incredibly valuable and incredibly expensive in legacy systems.
In response, 2026 has seen a move toward unified, columnar data platforms such as ClickHouse, capable of handling billions of records with sub-second query performance.
The Lakehouse Advantage
- Logs, metrics, and traces stored together
- Cross-signal correlation using SQL
- Elimination of “tool hopping” during incidents
- Orders-of-magnitude cost reduction
This architecture enables engineers to debug complex incidents in minutes instead of hours.
AIOps 2.0: From Alerts to Autonomous Operations
The biggest shift in observability is not more data—it’s what we do with it.
AIOps has moved beyond anomaly detection into causal intelligence and agentic automation.
Modern AI-driven SRE agents can:
- Correlate telemetry across the entire stack
- Explain incidents in natural language
- Execute remediation actions under supervision
- Predict capacity and failure risks before impact
Observability data is the fuel that makes autonomous IT operations possible.
Observability Economics: Visibility with Financial Discipline
By 2026, observability has become one of the fastest-growing cost centers in enterprise IT. What began as a necessary investment to stabilize cloud-native systems has, for many organizations, evolved into an uncontrolled financial drain. Metrics, logs, traces, profiles, security signals, and user telemetry now generate petabytes of data annually, often without clear governance or economic accountability.
As a result, observability is no longer evaluated purely on technical merit. It is now subject to the same scrutiny as cloud infrastructure, security tooling, and data platforms. The central question facing technology leaders is no longer “Can we observe everything?” but rather:
“How much observability do we need—and what is the business value of each signal we collect?”
Why observability became expensive
Modern systems generate data continuously, automatically, and at high cardinality. In a microservices environment, every request can produce:
- Multiple metrics with dimensional labels
- Structured and unstructured logs
- Distributed traces spanning dozens of services
- Profiling samples
- Infrastructure and network telemetry
Individually, these signals are valuable. Collectively, they create exponential cost growth.
By 2026, many enterprises report that:
- Observability costs are growing 40–48% year-over-year
- Logs alone consume 50–60% of observability budgets
- Engineers often lack visibility into why costs increase, only that they do
This phenomenon—sometimes called the “Observability Money Pit”—is not caused by poor tooling, but by uncontrolled data ingestion and legacy pricing models optimized for volume rather than insight.
From “collect everything” to value-based telemetry
Early observability maturity encouraged teams to “collect everything just in case.” In 2026, this approach is no longer viable.
High-performing organizations have shifted to value-based telemetry, where every signal must justify its cost by answering one of three questions:
- Does it protect revenue?
- Does it reduce incident duration or frequency?
- Does it improve developer productivity or system efficiency?
Signals that do not contribute to these outcomes are aggressively sampled, shaped, or discarded.
This mindset reframes observability from passive data collection into active economic decision-making.
FinOps for observability
Just as cloud spending required FinOps practices, observability now demands its own discipline: FinOps for Observability.
This approach introduces shared accountability between:
- Engineering teams (who generate telemetry)
- Platform teams (who manage pipelines)
- Finance and leadership (who fund the capability)
Key principles include:
1. Telemetry budgeting by signal type
Instead of a single observability budget, mature organizations allocate spend across:
- Metrics
- Logs
- Traces
- Profiles
Each category has different cost and value characteristics, allowing teams to optimize independently rather than cutting visibility blindly.
2. Cost-aware sampling and retention
Not all data needs the same fidelity or lifespan:
- 100% retention for errors and slow traces
- Aggressive sampling for healthy traffic
- Short retention for verbose debug logs
Tail-based sampling via OpenTelemetry Collectors has become a primary lever for cost control without sacrificing insight.
3. Ownership and accountability
Teams are increasingly responsible for the telemetry they generate. Dashboards now expose:
- Cost per service
- Cost per environment
- Cost per deployment
This transparency changes behavior—developers stop emitting noisy logs when they understand the financial impact.
Tool sprawl: the hidden multiplier of observability costs
Despite market maturity, most enterprises in 2026 still operate multiple overlapping observability platforms.
Industry data shows:
- ~66% of organizations use two or three observability tools
- Only ~10% have successfully consolidated
- Each additional tool multiplies ingestion, storage, and operational overhead
Tool sprawl creates three compounding problems:
- Duplicated data ingestion (the same telemetry sent to multiple vendors)
- Siloed visibility, slowing incident response
- Increased operational drag, with more agents, APIs, and training
As a result, tool consolidation has become a primary cost-reduction strategy, not just a technical preference.
Why this matters for Gart Solutions clients
Observability economics is not a tooling problem—it is an architecture, governance, and operating model problem.
This is where managed observability services create outsized value:
- Designing cost-aware telemetry pipelines
- Implementing OpenTelemetry governance
- Consolidating fragmented stacks
- Aligning observability KPIs with business outcomes
In 2026, the winning strategy is not maximum visibility—it is optimal visibility with financial discipline.
Observability as a managed strategic service
Observability has crossed a threshold. It is no longer a collection of dashboards—it is digital nervous system for the enterprise.
For organizations navigating this complexity, the challenge is not choosing tools, but designing an operating model that aligns technology, cost, and business outcomes.
At Gart Solutions, observability is approached as a managed strategic capability—combining architecture design, OpenTelemetry standardization, eBPF-based instrumentation, data platform optimization, and FinOps governance.
Final thought: reliability is the new competitive advantage
In 2026, customers do not differentiate between software features and software reliability. They expect both.
Organizations that invest in modern observability do more than prevent outages—they gain clarity, speed, and confidence in how their digital systems operate.
In an era where reliability equals trust, observability is not just infrastructure—it is strategy.
See how we can help to overcome your challenges