- Why “All Systems Green” Still Means Revenue Is Slipping
- The Business-Driven Monitoring Mindset
- Case Study #1: Global B2C Music Platform — $19.9K/Month Saved with Centralized IT Monitoring
- Case Study #2: IoT Device IT Monitoring — Preventing Churn with Edge Visibility
- Case Study #3: SaaS E-commerce Platform — Visibility Fuels Cloud Modernization
- The ROI Formula Your CFO Will Love
- What Should You Monitor First? (The Business-First Starter Pack)
- Product-Aware Dashboards: Speak in Business KPIs
- Edge + Cloud Observability for IoT: Total Visibility Across Devices
- 30–60 Day Implementation Plan for Business-Driven IT Monitoring
- How Gart Solutions Supports Your Success
- Gart Solutions provides:
- Conclusion: From Downtime to Dollars Starts with Visibility
If your dashboards are showing all systems go, but your revenue is going down, you’ve got a serious problem. It’s not your product, your people, or your marketing. It’s your visibility.
Here’s the truth: technical uptime isn’t the same as business uptime. Users don’t care if your CPU is green — they care if their payment went through, if the page loaded, or if they could log in without frustration. That’s where traditional IT monitoring fails and business-driven monitoring shines.
In this guide, we’ll show you how real companies moved from downtime to dollars by aligning IT monitoring with outcomes that matter: revenue, retention, and ROI.
You’ll also get a practical rollout roadmap, ROI calculator, and key metrics to track.
This is not just for engineers. If you’re a founder, CTO, head of product, or VP of finance, this will help you understand exactly how observability impacts profit — and how to make it work for your business.
Why “All Systems Green” Still Means Revenue Is Slipping
Let’s start with the classic trap: assuming that if your systems are healthy, your business must be too.
Your servers could be running at 99.99% uptime while your checkout flow is failing silently, your API is timing out, or your search functionality is returning zero results. These issues don’t trip alarms, but they absolutely crush conversion.
That’s the danger of relying solely on technical signals. They don’t show customer impact. They don’t show how many carts were abandoned due to a slow script, or how many subscribers churned after a failed onboarding experience.
Business-driven IT monitoring solves this by connecting:
- Infrastructure metrics
- Application performance
- Real-time user behavior
- Revenue-impacting KPIs
Instead of seeing a healthy database, you see “Product Page Load Time: +1.8s → Revenue Impact: -3%”. That’s actionable. That’s aligned.
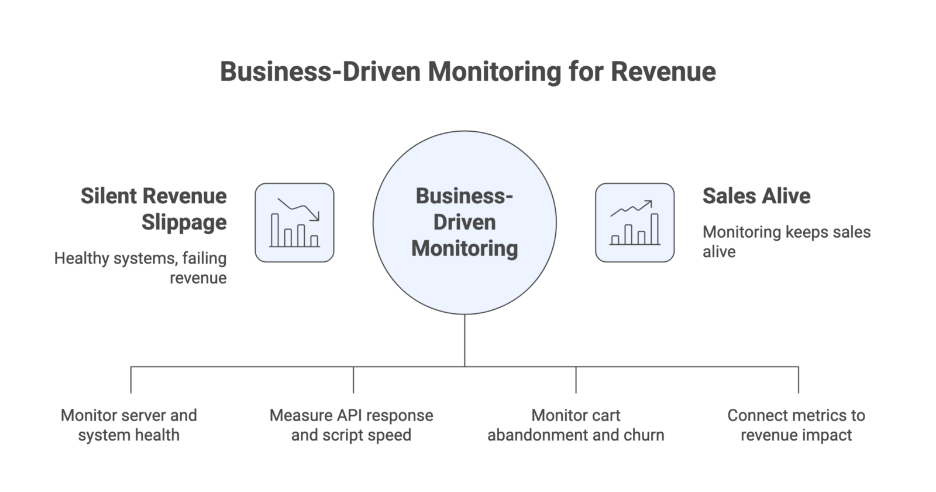
If you want to stop silent failures from stealing your revenue, you need monitoring that doesn’t just keep servers online — it keeps sales alive.
The Business-Driven Monitoring Mindset
Traditional IT monitoring focuses on uptime, errors, and system health. It’s great for keeping services running, but it misses the big picture: the user journey.
Business-driven monitoring asks:
- Are users converting?
- Are payments processed fast?
- Are cloud costs aligned with feature usage?
- Are outages affecting retention or revenue?
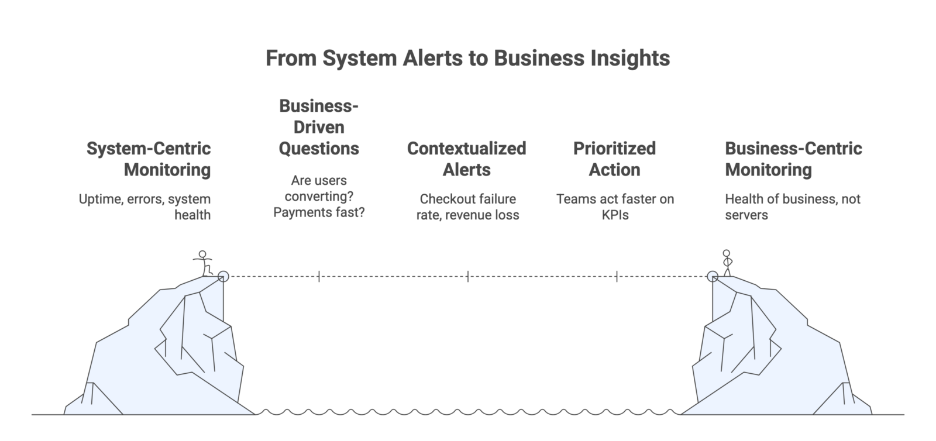
The key is shifting from alerts without context to insights with business impact.
Instead of “503 error on /api/payments,” your team gets:
“Checkout Failure Rate: 2.5x ↑ — Estimated Revenue Loss: $2,300/hour.”
When alerts are tied to KPIs, teams can prioritize intelligently — and act faster.
This mindset doesn’t just benefit engineering. It brings visibility to product, customer success, marketing, and finance. Everyone sees what matters most: the health of your business, not just your servers.
Case Study #1: Global B2C Music Platform — $19.9K/Month Saved with Centralized IT Monitoring
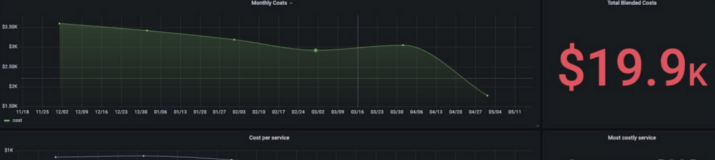
A global music streaming platform was struggling with cloud overspend and slow incident detection. Uptime was good, but real-time performance was erratic — users noticed. So did their cloud bill.
Gart Solutions integrated AWS CloudWatch for data collection with Grafana for visualization. But the real win? They built dashboards that showed cost and performance side-by-side.
What They Implemented:
- Unified infra + app metrics
- Proactive anomaly detection
- Automated alerting for product-impacting issues
- Feature-level cost insights
Results:
- $19,900/month saved in cloud optimization
- Incident detection time reduced dramatically
- Streaming stability improved in key regions
This wasn’t just about fixing bugs — it was about giving the team visibility into how engineering choices affected cost, quality, and experience.
Takeaways:
- Engineers fix what they can see. Show them cost next to code, and you’ll save money.
- Use IT Monitoring tools your team loves — Grafana adoption is key to dashboard usage.
- Make IT monitoring a product decision, not just an ops task.
Case Study #2: IoT Device IT Monitoring — Preventing Churn with Edge Visibility
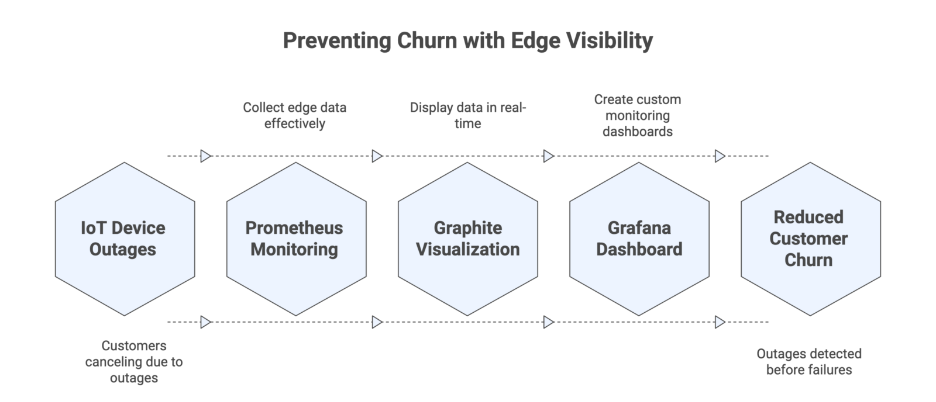
An IoT platform with smart microchip devices was losing customers due to device outages. The cloud stack looked fine, but field devices weren’t connecting, weren’t syncing, and customers were getting frustrated — and canceling.
Gart implemented cloud-agnostic Kubernetes monitoring using Prometheus, Graphite, and Grafana — with a focus on edge data.
What They Monitored:
- Device heartbeat signals
- MQTT/CoAP messaging queues
- OTA update failures
- Regional latency and uptime
Results:
- Outages detected before mass failures
- Real-time response to device degradation
- Reduced churn and saved high-value contracts
Takeaways:
- Edge failures = revenue loss. Monitor device health like cash flow.
- Build multi-tenant dashboards so product, support, and ops see the same data.
- Protocol-aware monitoring is essential — MQTT ≠ HTTP.
Case Study #3: SaaS E-commerce Platform — Visibility Fuels Cloud Modernization
This legacy SaaS company was moving to the cloud — but had no way to track performance, cost, or deployment health. Every release felt like a gamble.
Gart combined CI/CD automation with IT monitoring and cost dashboards to bring clarity across teams.
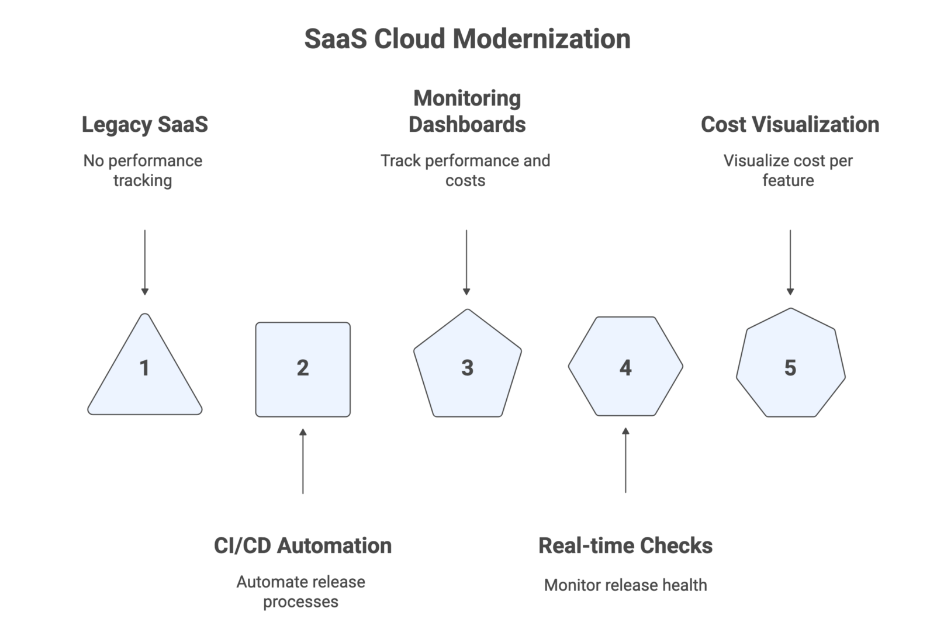
What They Built:
- Real-time release health checks
- Cost-per-feature visualizations
- Error tracking tied to deploys
- Cloud autoscaling insights
Results:
- Faster release cycles with fewer rollbacks
- Improved UX and performance consistency
- Cloud costs stabilized and justified to finance
Takeaways:
- Pair CI/CD with observability for smarter deployments
- Track cost per feature/API — not just total bill
- Give product and finance shared dashboards
The ROI Formula Your CFO Will Love
Want to justify your IT monitoring investment in a board meeting or budget review? Use this simple formula:
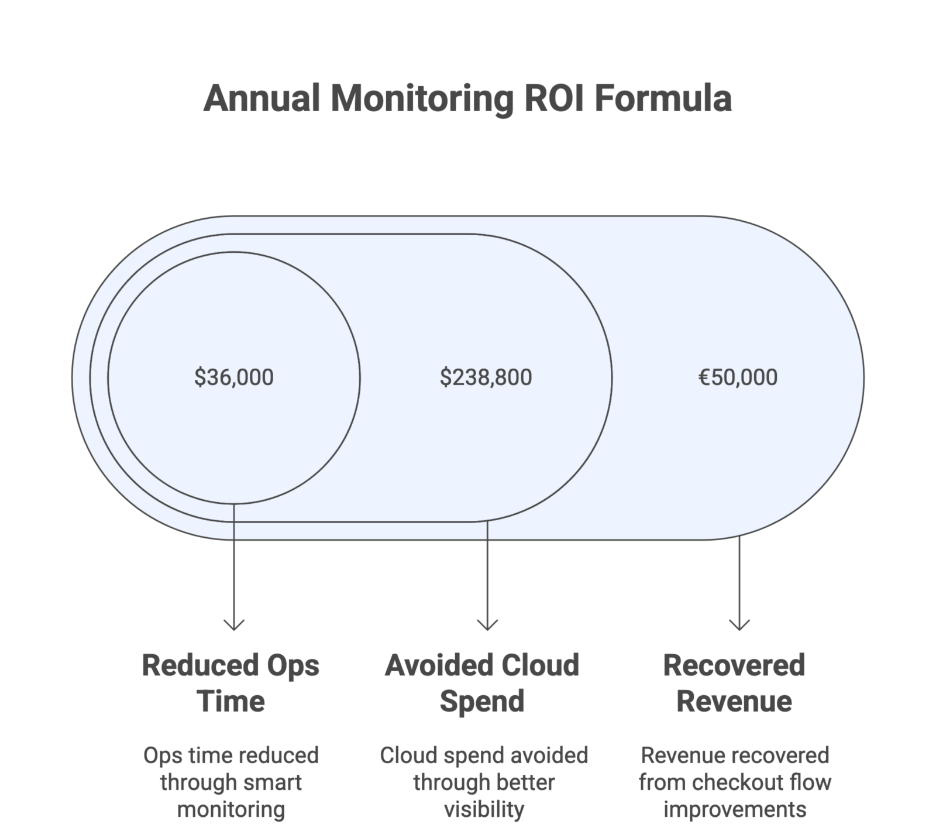
Annual Monitoring ROI = (Recovered Revenue + Avoided Cloud Spend + Reduced Ops Time) – (Tooling + Implementation + Run Costs)
Let’s break it down with real-world examples:
A) Recovered Revenue
If your checkout flow improves by even 0.5% due to early detection of an issue, and your site processes €10M annually — that’s €50,000 in recovered revenue.
How? IT Monitoring catches:
- Silent checkout failures
- Performance slowdowns during campaigns
- Broken third-party integrations
B) Avoided Cloud Spend
Better visibility usually trims 10–30% off your cloud bills by:
- Identifying underutilized instances
- Enabling right-sizing and autoscaling
- Reducing duplicate workloads
Example: One company cut $19.9K/month from AWS spend just by adding cost-awareness to monitoring.
C) Reduced Ops Time
Engineers waste hours chasing red herrings from noisy alerts. Smart IT monitoring routes alerts with business context — so teams respond faster, fix quicker, and free up time.
If each engineer saves 4 hours/month, and you have 10 engineers, that’s 480 hours/year reclaimed. At $75/hr, that’s $36,000/year saved.
Sample ROI Calculation:
| Component | Value |
| Recovered Revenue | €50,000 |
| Avoided Cloud Spend | €24,000 |
| Reduced Ops Time | €18,000 |
| Total Gains | €92,000 |
| Monitoring Costs (tools + time) | €25,000 |
| Net ROI | €67,000/year |
That’s how you get from downtime to dollars.
What Should You Monitor First? (The Business-First Starter Pack)
Don’t boil the ocean. Start where it counts — the flows that drive money.
Here’s your monitoring starter pack with business value baked in:
🛒 1. Checkout & Payment Flows
- Errors by payment provider
- Time to complete transaction
- Drop-off rate at each step
- Revenue lost per minute of failure
Why? Checkout friction = lost sales. Fast alerts = fast fixes = saved revenue.
🔁 2. Core User Journeys
- Search → Product Page → Cart
- Sign-up → Email Verification → First Action
- Mobile app launch time and crash rate
Why? If users can’t complete core actions, they leave — and don’t come back.
💸 3. Cost Drivers
- Cost per tenant/customer
- Top 10 services by cloud spend
- Cost per API call or feature
- Team-level usage visibility
Why? Showing cost creates ownership and stops “shadow spend.”
🚀 4. Release Health
- Pre/post-deploy performance delta
- Error budgets consumed
- Rollbacks triggered
- Latency spike alerts
Why? Bad releases hurt UX and cost retention. Monitor early, act fast.
📈 5. Capacity Planning
- CPU/memory saturation
- Queue lengths ahead of campaigns
- Seasonal traffic forecasting
- Autoscaling trigger coverage
Why? Prevent outages during peaks (Black Friday, product launches, etc.).
Product-Aware Dashboards: Speak in Business KPIs
Dashboards are often built for ops — but they should tell stories anyone in the business can understand.
Here’s how to design dashboards that align with growth, not just uptime:
What to Include:
- Revenue per minute
- Latency tied to conversion drop-offs
- Cost per API call / feature / region
- SLA status per customer segment
- Product-specific performance metrics (e.g., “search-to-add-to-cart success rate”)
Dashboard Best Practices:
- Use Grafana or Looker for flexible, team-friendly views
- Tie every chart to a real business question
- Include ownership info for every alert
- Build for exec visibility + dev actionability
A good dashboard answers this:
“If this graph spikes, who loses money — and who fixes it?”
Cost Telemetry: The Missing Piece in Most IT Monitoring Setups
Here’s a dirty little secret: most teams don’t know what their features cost to run.
They ship a new product update, it hits production, and… the cloud bill quietly explodes. Sound familiar? That’s what happens when cost isn’t monitored in real time.
Cost telemetry changes everything. It makes cost visible, actionable, and owned — just like performance or reliability.
What is Cost Telemetry?
Cost telemetry means surfacing cloud cost metrics alongside app performance and user behavior.
That includes:
- Cost per API call
- Cost per customer/tenant
- Cost per region or feature
- Forecast vs actual spend per week/month
When engineers see “this endpoint costs $300/day,” they optimize fast. When finance sees cost per feature, they can justify — or kill — it.
Why It’s a Game Changer
- Prevents surprise bills
- Drives accountability across teams
- Enables showback models (let teams own their usage)
- Highlights ROI per feature — not just total spend
Example Wins:
- One SaaS platform slashed 30% of compute spend just by seeing which microservices were overprovisioned.
- Another company shifted traffic to cheaper cloud regions during non-peak hours, saving thousands monthly.
How to Implement It:
- Tag your resources properly
Group by team, feature, environment, customer.
- Pull cost data into your dashboards
Use AWS Cost Explorer APIs, BigQuery for GCP, or Azure Cost Management.
- Set cost alerts
Alert when cost per unit jumps by X% — before the bill arrives.
- Include cost in pre-release checklists
Will this release spike our infra costs? Now you’ll know.
Cost telemetry puts budget visibility into the hands of the builders — and that changes everything.
Edge + Cloud Observability for IoT: Total Visibility Across Devices
IoT systems are fragile by nature — low bandwidth, distributed devices, sketchy networks, and complex protocols. When things go wrong, it’s hard to tell where or why — unless your monitoring is rock solid.
Gart Solutions helped an IoT platform serving thousands of devices across the globe implement true end-to-end observability.
What They Tracked:
- Device heartbeat pings (to detect outages fast)
- OTA (over-the-air) firmware failures
- Queue backlogs and latency at the edge
- Regional service degradation
- API sync issues between devices and cloud
The setup used Prometheus and Grafana, with custom exporters to track MQTT and CoAP traffic patterns.
Results:
- 90% drop in field escalations
- Faster root cause analysis (from hours to minutes)
- Improved SLA compliance
- Better customer satisfaction and contract renewals
Best Practices for IoT Monitoring:
- Combine edge + cloud views into a single dashboard
- Track protocol-specific metrics (not just HTTP)
- Instrument for real-time alerting, not batch logs
- Surface fleet health at a glance (heatmaps, uptime %, failure trends)
If devices drive your business, their visibility is non-negotiable. A single dashboard should answer:
“Which devices are offline? Where? And what’s it costing us right now?”
30–60 Day Implementation Plan for Business-Driven IT Monitoring
Don’t try to build everything at once. Start small, move fast, and show value early. Here’s a proven rollout plan that works:
Week 1–2: Define Business-Critical Flows
- Map top 3 revenue-generating user journeys
- Collect historical failure points
- Instrument latency, errors, and timeouts
- Stand up executive dashboards (conversion, cost, key flows)
Week 3–4: Add Cost & Ownership
- Integrate cost data (per service, region, customer)
- Create SLIs/SLOs for top flows
- Assign alert owners — no orphaned alerts
- Train teams on usage and interpretation
Week 5–6: Automate & Show ROI
- Enable autoscaling and right-sizing with data
- Add pre/post-deploy checks
- Create monthly “IT Monitoring Saves Us $” report
- Align metrics with finance/product reviews
This approach not only makes you more resilient — it proves value fast, builds momentum, and aligns teams around shared truths.
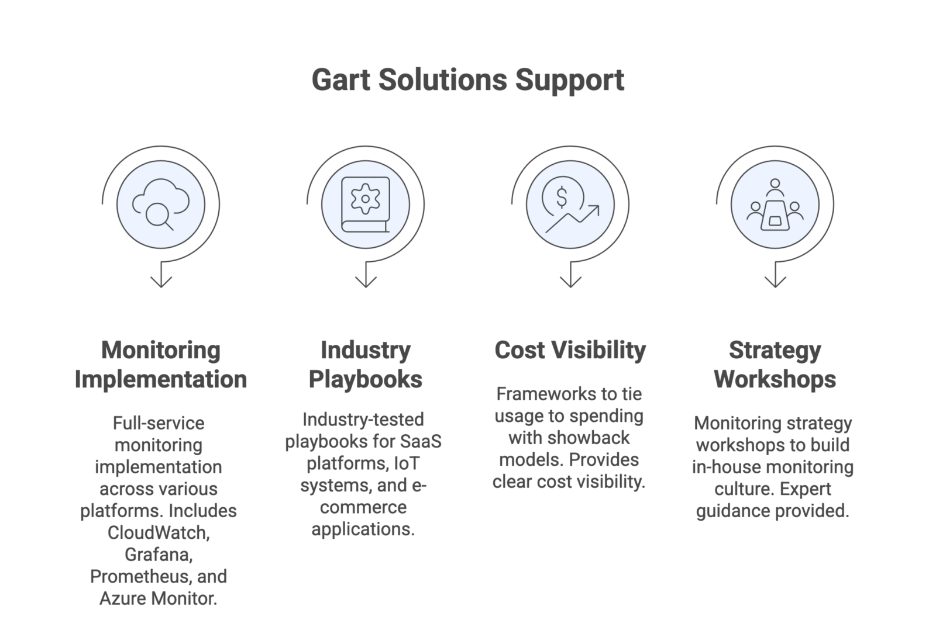
How Gart Solutions Supports Your Success
Need help turning dashboards into dollars?
Gart Solutions provides:
- Full-service monitoring implementation
- CloudWatch, Grafana, Prometheus, Azure Monitor, and more
- Industry-tested playbooks
- SaaS platforms, IoT systems, e-commerce apps
- Cost visibility frameworks
- Tie usage to spend with showback models
- Monitoring strategy workshops
- Build in-house monitoring culture with expert guidance
If your current setup only tells you when something is “down,” but not how much it’s costing you, it’s time to level up.
Conclusion: From Downtime to Dollars Starts with Visibility
Your business isn’t leaking revenue because of bad luck. It’s leaking because your monitoring is blind to what matters.
The days of green dashboards while your users churn out silently are over.
Modern monitoring doesn’t just protect uptime — it protects revenue, customer trust, and growth. When you align infrastructure metrics with KPIs, cost telemetry, and user journeys, you create a competitive advantage.
Whether you’re running an e-commerce site, a SaaS platform, or a fleet of smart devices — it all comes down to one thing:
Can you see the true state of your business, in real time?
If not, you’re not IT monitoring — you’re guessing.
Start now. Implement smarter visibility. And turn every minute of uptime into money on the table.
Contact Gart for IT Monitoring Services.