- What is IT Infrastructure Outsourcing?
- Why is IT Infrastructure Outsourcing Becoming Essential Today?
- Components Included in IT Infrastructure Outsourcing
- Benefits of IT Infrastructure Outsourcing
- Piyush Tripathi About the Benefits of Outsourcing Infrastructure
- Potential Risks of IT Infrastructure Outsourcing
- The 5 Core Benefits of IT Infrastructure Outsourcing — With Real Numbers
- Why the Business Case for IT Infrastructure Outsourcing Is Stronger Than Ever in 2026
- How we reduced infrastructure costs by 38% for a Series B fintech
- IT Infrastructure Outsourcing Models: Which One Is Right for You?
- In-House vs. IT Infrastructure Outsourcing: A Direct Decision Framework
- When IT Infrastructure Outsourcing Is the Wrong Choice
- What a Modern IT Infrastructure Outsourcing Stack Looks Like in 2026
- Expertise across the modern stack
- The Process for Outsourcing IT Infrastructure
- Evaluating the Outsourcing Vendor: Ensuring Reliability and Compatibility
- Why Ukraine is an Attractive Outsourcing Destination for IT Infrastructure
- The Gart 5-Step Infrastructure Optimization Model
- Long Story Short
- Get a Free Infrastructure Cost Audit in 48 Hours
Your engineering team is talented. But if they are spending 30–40% of their time on infrastructure maintenance — patching, monitoring, incident response, storage management — they are not doing the work that actually builds your competitive advantage. IT infrastructure outsourcing is how high-growth companies reclaim that time.
This guide gives you a realistic, technically grounded view of what outsourcing infrastructure operations actually looks like in 2026: what it costs, which models work, when it is the wrong choice, and what separates providers who deliver outcomes from those who deliver invoices. If you want to jump straight to what we do at Gart, explore our IT infrastructure management services — or use the ROI calculator below to estimate your savings before reading further.
Global IT outsourcing market in 2026 (projected)
Average operational cost reduction our clients see in year one
Average uptime delivered across Gart-managed environments
of companies will face critical IT skills shortages by end of 2026
What is IT Infrastructure Outsourcing?
Imagine you’re running a marathon, but you’re also carrying your heavy backpack. That’s what managing IT infrastructure in-house often feels like for many companies. You’re trying to focus on winning the race (your business goals), but the weight of maintaining servers, networks, data centers, and security is slowing you down.
IT infrastructure outsourcing is like handing over that backpack to a professional support team running beside you. They carry it efficiently, ensuring everything inside remains organized, protected, and accessible, allowing you to focus solely on your pace and strategy.
At its core, IT infrastructure outsourcing means entrusting a specialized external provider with the management, maintenance, and optimization of your IT systems and hardware, including:
- Servers and storage
- Networks and connectivity
- Data centers and cloud infrastructure
- Security protocols and compliance requirements
Instead of managing all these internally, you leverage the expertise and resources of professionals dedicated solely to this domain.
What Falls Under IT Infrastructure?
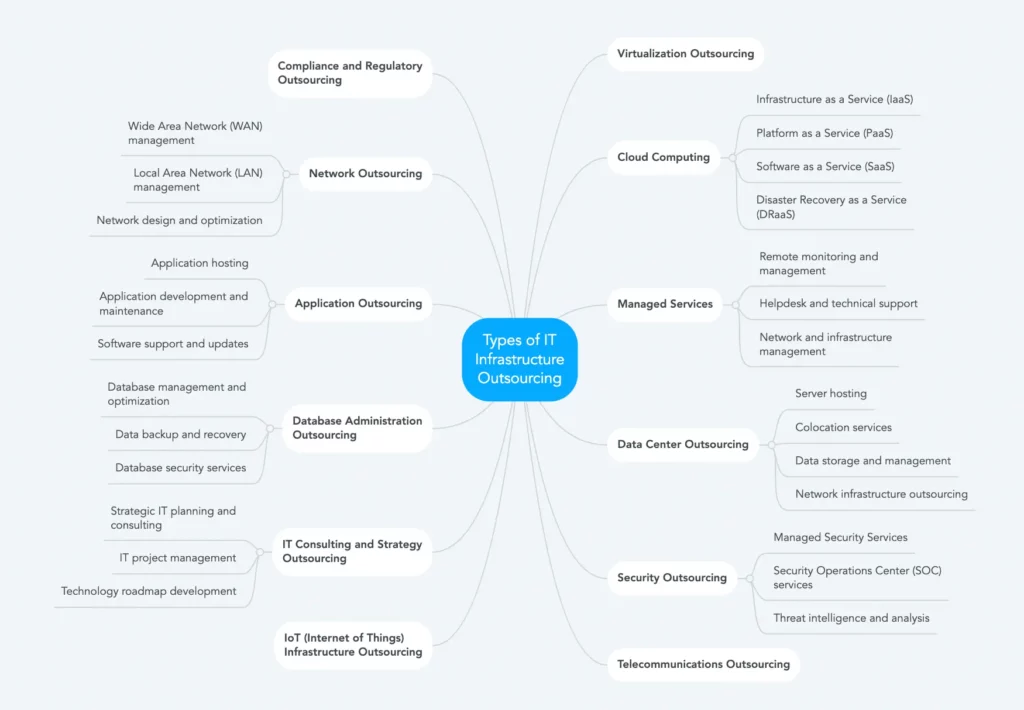
The scope of an IT infrastructure outsourcing engagement typically covers some or all of the following:
- Cloud infrastructure — multi-cloud environments (AWS, Azure, GCP), Kubernetes clusters, FinOps and cost governance, cloud-native architecture optimization
- On-premises & hybrid data centers — server lifecycle management, virtualization (VMware, Hyper-V), storage (SAN/NAS/object), data center operations
- Networking — LAN/WAN, SD-WAN, VPN management, firewall policy, performance monitoring, BGP/routing
- Security operations — SIEM, 24/7 SOC, vulnerability management, patch compliance, penetration test coordination, compliance tooling
- Backup & disaster recovery — RPO/RTO-aligned backup architecture, DR runbooks, regular failover testing
- Service desk & incident management — L1/L2/L3 ticket routing, SLA-governed response times, on-call escalation paths
Why is IT Infrastructure Outsourcing Becoming Essential Today?
Today’s business landscape demands agility, security, and innovation – all while keeping costs under control. Here’s why outsourcing IT infrastructure has shifted from being a strategic option to a critical necessity:
- Rapid Technological Advancements
IT evolves so fast that in-house teams struggle to keep up with emerging tools, frameworks, and security protocols. Outsourcing partners invest heavily in continuous skill upgrades, ensuring your business benefits from the latest advancements without the learning curve. - Cybersecurity Threats Are Rising
The sophistication of cyberattacks increases daily. Outsourcing ensures your infrastructure is protected by advanced threat detection systems and experts monitoring for vulnerabilities 24/7. - Need for Scalability and Flexibility
Whether it’s Black Friday traffic spikes or sudden global expansions, businesses must scale their IT resources seamlessly. Outsourcing provides elasticity without the delays and overhead of in-house provisioning. - Pressure to Focus on Core Business
Every hour spent fixing servers is an hour not spent innovating or delighting customers. Outsourcing allows businesses to focus on strategic initiatives while leaving technical operations to experts.
In essence, IT infrastructure outsourcing is not about relinquishing control – it’s about gaining freedom to drive your business forward faster.
Breaking Down IT Infrastructure Outsourcing
At its simplest, IT infrastructure outsourcing is the strategic delegation of your company’s IT infrastructure management to a trusted external provider. This includes:
- Hardware management: Procuring, installing, configuring, and maintaining servers, storage devices, and network hardware.
- Software management: Managing operating systems, infrastructure software, and middleware.
- Network management: Ensuring secure, reliable, and optimized connectivity within and beyond your organization.
- Security management: Implementing and maintaining cybersecurity measures to protect systems and data.
- Cloud infrastructure management: Designing, deploying, and maintaining cloud resources in platforms like AWS, Azure, or Google Cloud.
It’s like hiring a specialized external team to maintain, upgrade, and optimize the entire “engine room” of your business so your internal teams can steer the ship confidently towards strategic goals.
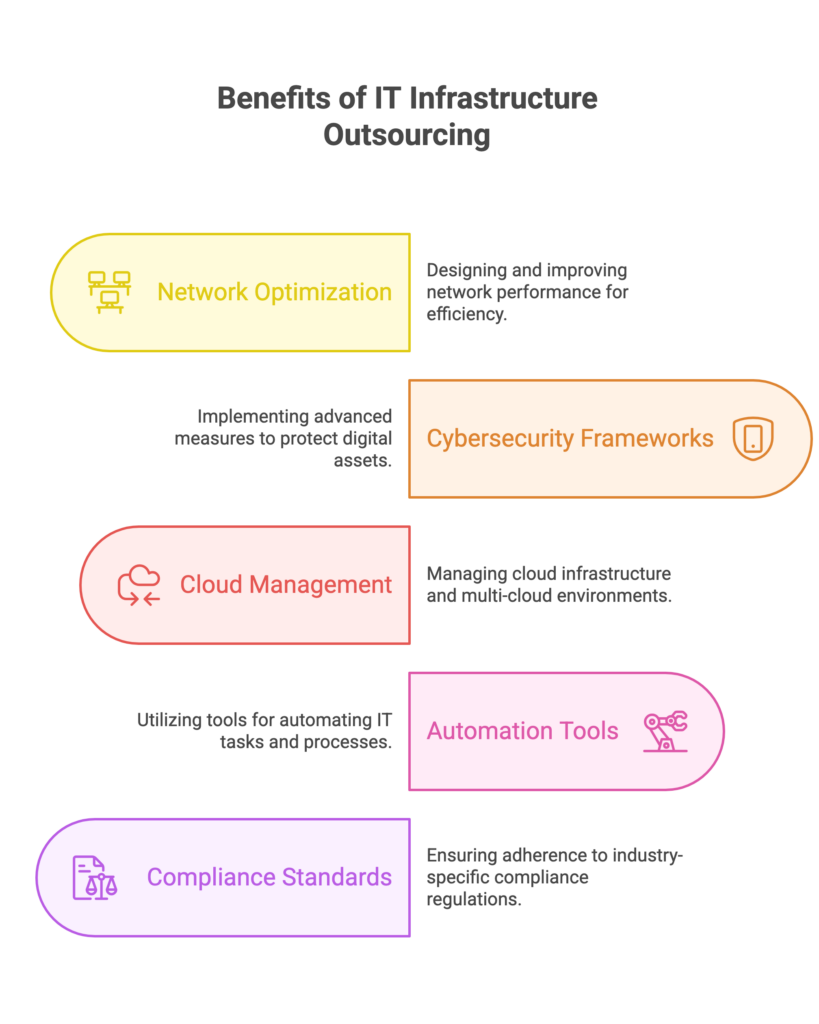
Components Included in IT Infrastructure Outsourcing
Here’s a breakdown of what infrastructure outsourcing usually covers:
- Servers:
Physical and virtual servers host your applications, databases, and services. - Networks:
LAN, WAN, VPNs, and connectivity solutions ensure data flows securely and efficiently. - Storage Systems:
Data storage solutions, backup infrastructure, and disaster recovery planning. - Data Centers:
Management of on-premises data centers or leveraging third-party colocation and cloud facilities. - Security Systems:
Firewalls, intrusion detection and prevention, endpoint security, and compliance management. - Cloud Infrastructure:
Public, private, or hybrid cloud management, including architecture design, resource provisioning, monitoring, and cost optimization.
By outsourcing these components, companies gain access to specialized expertise, advanced technologies, and robust security protocols without the overhead of building these capabilities internally.
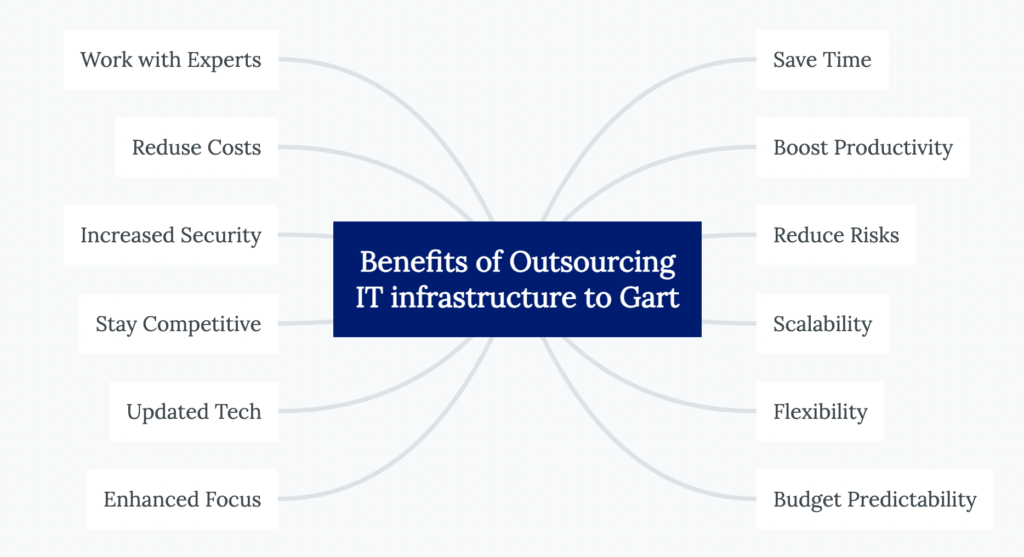
Benefits of IT Infrastructure Outsourcing
Outsourcing IT infrastructure brings numerous benefits that contribute to business growth and success.
Manage Cloud Complexity
Over the past two years, there’s been a surge in cloud commitment, with more than 86% of companies reporting an increase in cloud initiatives.
Implementing cloud initiatives requires specialized skill sets and a fresh approach to achieve comprehensive transformation. Often, IT departments face skill gaps on the technical front, lacking experience with the specific tools employed by their chosen cloud provider.
Cloud migration and management aren’t as simple as clicking “deploy.” Each cloud provider (AWS, Azure, GCP) has unique architectures, tools, and services requiring specialized skills and certifications.
Many organizations lack the expertise needed to develop a cloud strategy that fully harnesses the potential of leading platforms such as AWS or Microsoft Azure, utilizing their native tools and services.
For instance:
- AWS requires expertise in services like EC2, S3, RDS, Lambda, and VPC configurations.
- Azure demands proficiency in Resource Groups, Virtual Networks, Azure AD, and cost management tools.
- GCP needs knowledge of Compute Engine, Kubernetes Engine, Cloud Functions, and BigQuery integrations.
Without this expertise, companies risk:
- Cost overruns due to improper provisioning
- Security misconfigurations exposing critical data
- Failed migrations disrupting business operations
Outsourcing to experienced infrastructure providers ensures cloud initiatives are implemented efficiently, securely, and cost-effectively.
Access to Specialized Expertise
Outsourcing IT infrastructure allows businesses to tap into the expertise of professionals who specialize in managing complex IT environments.
As a CTO, I understand the importance of having a skilled team that can handle diverse technology domains, from network management and system administration to cybersecurity and cloud computing.
Outsourcing partners bring in strategic cloud architecture design that aligns with your business goals:
- Hybrid or multi-cloud setups for redundancy and compliance
- Auto-scaling and elasticity to handle traffic spikes seamlessly
- Disaster recovery and high availability architectures to minimize downtime risks
- Cost optimization strategies like reserved instances, spot instances, and resource right-sizing
These capabilities are critical as over 86% of companies have increased their cloud initiatives in the last two years, according to Gartner, but lack in-house expertise to fully leverage them.
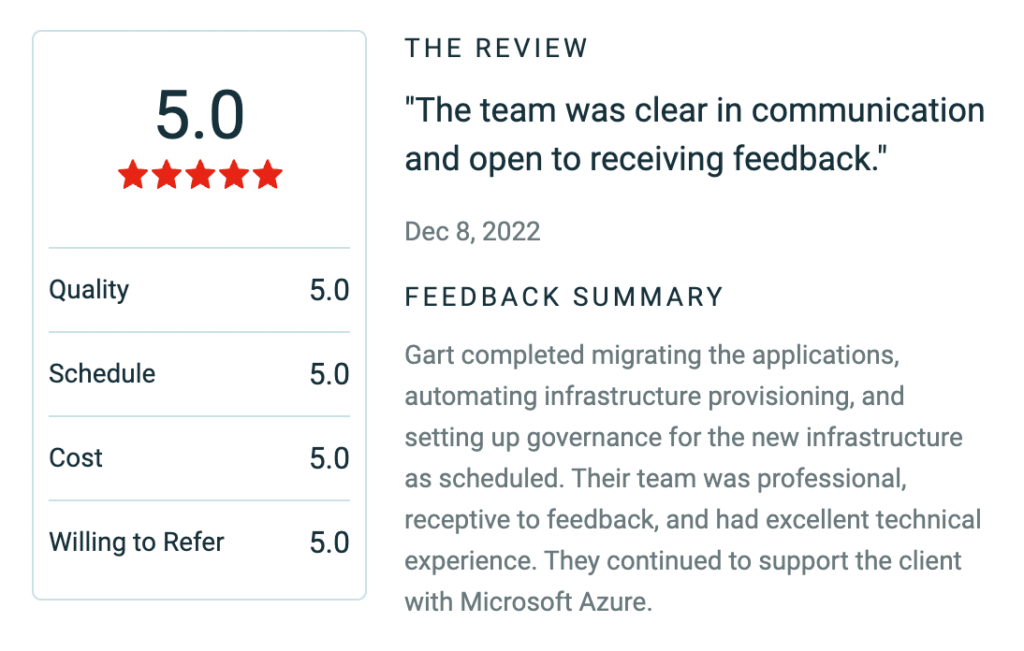
“Gart finished migration according to schedule, made automation for infrastructure provisioning, and set up governance for new infrastructure. They continue to support us with Azure. They are professional and have a very good technical experience”
Under NDA, Software Development Company
Enhanced Focus on Core Competencies
Outsourcing IT infrastructure liberates businesses from the burden of managing complex technical operations, allowing them to focus on their core competencies. I firmly believe that organizations thrive when they can allocate their resources towards activities that directly contribute to their strategic goals.
By entrusting the management and maintenance of IT infrastructure to a trusted partner like Gart, businesses can redirect their internal talent and expertise towards innovation, product development, and customer-centric initiatives.
For example, SoundCampaign, a company focused on their core business in the music industry, entrusted Gart with their infrastructure needs.
We upgraded the product infrastructure, ensuring that it was scalable, reliable, and aligned with industry best practices. Gart also assisted in migrating the compute operations to the cloud, leveraging its expertise to optimize performance and cost-efficiency.
One key initiative undertaken by Gart was the implementation of an automated CI/CD (Continuous Integration/Continuous Deployment) pipeline using GitHub. This automation streamlined the software development and deployment processes for SoundCampaign, reducing manual effort and improving efficiency. It allowed the SoundCampaign team to focus on their core competencies of building and enhancing their social networking platform, while Gart handled the intricacies of the infrastructure and DevOps tasks.
“They completed the project on time and within the planned budget. Switching to the new infrastructure was even more accessible and seamless than we expected.”
Nadav Peleg, Founder & CEO at SoundCampaign
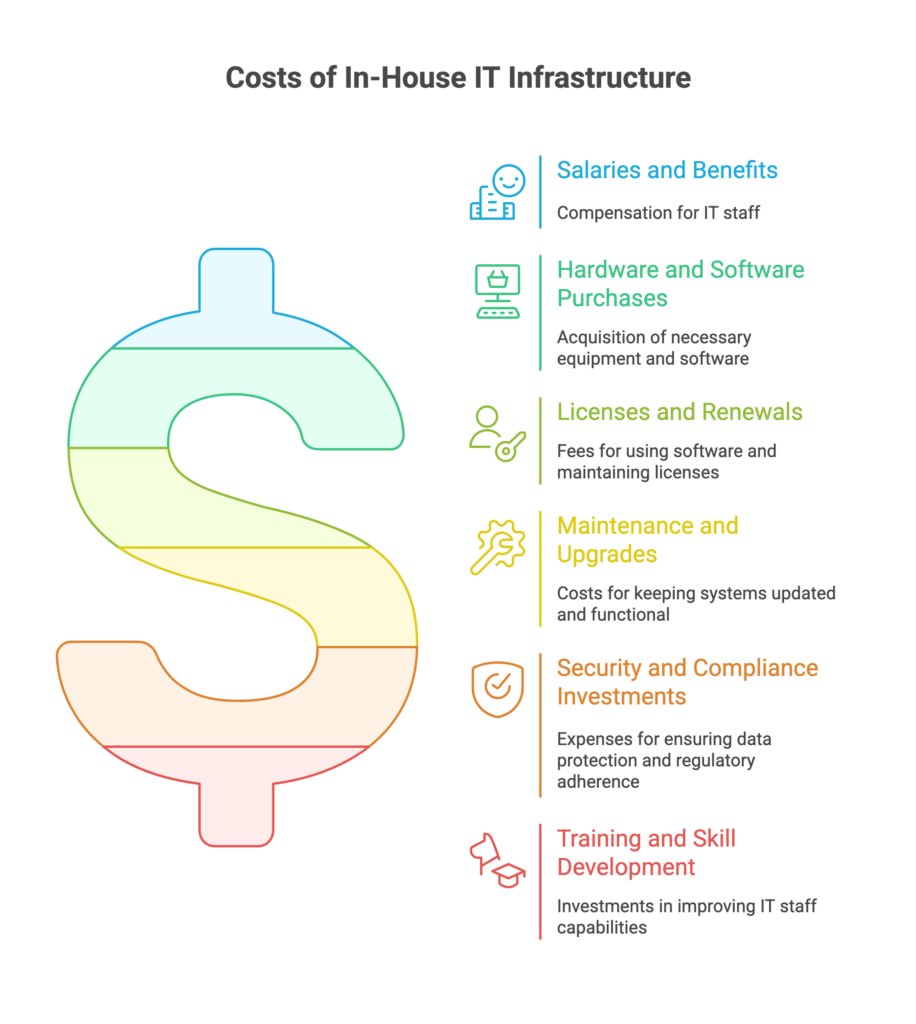
Cost Savings and Budget Predictability
Managing an in-house IT infrastructure can be a costly endeavor. By outsourcing, businesses can reduce expenses associated with hardware and software procurement, maintenance, upgrades, and the hiring and training of IT staff.
As an outsourcing provider, Gart has already made the necessary investments in infrastructure, tools, and skilled personnel, enabling us to provide cost-effective solutions to our clients. Moreover, outsourcing IT infrastructure allows businesses to benefit from predictable budgeting, as costs are typically agreed upon in advance through service level agreements (SLAs).
“We were amazed by their prompt turnaround and persistency in fixing things! The Gart’s team were able to support all our requirements, and were able to help us recover from a serious outage.”
Ivan Goh, CEO & Co-Founder at BeyondRisk
Scaling Quickly with Market Demands
Business is dynamic. Whether it’s expanding into new markets, onboarding thousands of new users overnight, or handling seasonal traffic spikes – your IT infrastructure must scale without delays or failures.
With outsourcing, companies have the flexibility to quickly adapt to these changing requirements. For example, Gart’s clients have access to scalable resources that can accommodate their evolving needs.
Outsourcing partners provide:
- Elastic server capacity: Add or remove resources instantly.
- Flexible storage solutions: Expand databases or object storage without hardware procurement delays.
- Network optimization: Enhance bandwidth and connectivity as user demands grow.
For example, Twilio scaled its COVID-19 contact tracing platform rapidly by outsourcing infrastructure to cloud providers. This automatic scaling ensured millions of people were contacted efficiently without infrastructure bottlenecks, a feat nearly impossible with only internal teams.
Whether it’s expanding server capacity, optimizing network bandwidth, or adding storage, outsourcing providers can swiftly adjust the infrastructure to support business growth. This scalability and flexibility provide businesses with the agility necessary to respond to market dynamics and seize growth opportunities.
Robust Security Measures
Imagine guarding a fortress with outdated locks and untrained guards. That’s the risk many companies face managing security internally without dedicated resources.
Outsourcing IT infrastructure brings enterprise-level security expertise and tools within reach for businesses of all sizes. Here’s how:
- 24/7 Monitoring and Threat Detection
Outsourcing partners deploy advanced Security Information and Event Management (SIEM) tools, intrusion detection systems, and AI-powered threat analytics to monitor your infrastructure around the clock. - Regular Security Audits and Compliance Audits
They conduct periodic vulnerability assessments, penetration testing, and compliance checks to ensure you meet industry standards like GDPR, HIPAA, and ISO 27001 without adding internal workload. - Data Encryption and Access Controls
Providers implement end-to-end encryption protocols for data at rest and in transit, along with strict identity and access management policies to control who accesses sensitive systems.
As the CTO of Gart, I prioritize the implementation of robust security measures, including advanced threat detection systems, data encryption, access controls, and proactive monitoring. We ensure that our clients’ sensitive information remains protected from cyber threats and unauthorized access.
“The result was exactly as I expected: analysis, documentation, preferred technology stack etc. I believe these guys should grow up via expanding resources. All things I’ve seen were very good.”
Grigoriy Legenchenko, CTO at Health-Tech Company
Piyush Tripathi About the Benefits of Outsourcing Infrastructure
Looking for answers to the question of IT infrastructure outsourcing pros and cons, we decided to seek the expert opinions on the matter. We reached out to Piyush Tripathi, who has extensive experience in infrastructure outsourcing.

Introducing the Expert
Piyush Tripathi is a highly experienced IT professional with over 10 years of industry experience. For the past ten years, he has been knee-deep in designing and maintaining database systems for significant projects. In 2020, he joined the core messaging team at Twilio and found himself at the heart of the fight against COVID-19. He played a crucial role in preparing the Twilio platform for the global vaccination program, utilizing innovative solutions to ensure scalability, compliance, and easy integration with cloud providers.
What are the potential benefits of IT infrastructure outsourcing?
High scale: I was leading Twilio COVID-19 platform to support contact tracing. This was a fairly quick announcement as the state of New York was planning to use it to help contact trace millions of people in the state and store their contact details. We needed to scale and scale fast. Doing it internally would have been very challenging, as demand could have spiked, and our response could not have been swift enough to respond. Outsourcing it to a cloud provider helped mitigate that; we opted for automatic scaling, which added resources in the infrastructure as soon as demand increased. This gave us peace of mind that even when we were sleeping, people would continue to get contacted and vaccinated.
Potential Risks of IT Infrastructure Outsourcing
While outsourcing unlocks significant benefits, it’s important to be aware of potential risks:
Risks:
- Infra domain knowledge: if you outsource infra, your team could lose knowledge of setting up this kind of technology. for example, during COVID 19, I moved the contact database from local to cloud so overtime I anticipate that next teams would loose context of setting up and troubleshooting database internals since they will only use it as a consumer.
- Limited direct control: since you outsource infrastructure, data, business logic and access control will reside in the provider. in rare cases, for example using this data for ML training or advertising analysis, you may not know how your data or information is being used.
- Vendor Lock-in:
Relying heavily on a single outsourcing provider may create challenges if switching vendors later becomes necessary. Migrating away can be complex and costly. - Compliance Risks:
Data privacy regulations require careful vendor selection. Not knowing how your vendor stores, processes, or uses your data could pose legal and reputational risks, especially for sectors like healthcare and finance.
The 5 Core Benefits of IT Infrastructure Outsourcing — With Real Numbers
1. Cost Reduction That Is Measurable, Not Theoretical
The economics work because a managed provider amortizes the cost of senior expertise, monitoring tooling, and 24/7 coverage across multiple clients. A single enterprise-grade monitoring platform (Datadog, Dynatrace, or equivalent) can cost $15,000–$60,000 per month at scale — but your managed provider spreads that cost across their entire client base. For talent: a senior SRE in North America costs $180,000–$240,000 in base salary alone, before benefits, equity, and recruitment costs. Your managed infrastructure provider gives you access to that expertise without the headcount overhead. Our clients typically see 30–40% total cost of ownership reduction within 12 months.
2. Access to the Full Specialist Stack
No single hire gives you a cloud security architect, a Kubernetes platform engineer, a FinOps specialist, and a database performance engineer. Outsourcing does. This matters especially when you are navigating a complex modernization — migrating from monolith to microservices, exiting a data center, or adopting a new cloud region. Our guide on IaC tools outlines the kind of tooling depth a capable provider should bring to any modern infrastructure engagement.
3. Elastic Scalability Aligned to Your Business Cycle
Growth events create sudden infrastructure demand. A product launch, a market expansion, or an acquisition integration can require rapid provisioning capacity that a fixed in-house team simply cannot absorb without burning out or creating bottlenecks. Managed infrastructure partners scale resources in alignment with your roadmap — without the six-month hiring cycle that in-house expansion requires.
4. Reclaimed Internal Engineering Bandwidth
In most organizations, infrastructure maintenance consumes 30–50% of engineering time. That is time that could be spent on the product capabilities, data pipelines, and developer experience improvements that actually differentiate your business in market. Outsourcing operational maintenance returns that bandwidth to your team.
5. Built-In Compliance Coverage
Qualified managed infrastructure providers embed compliance tooling — automated evidence collection, audit-ready reporting, continuous security scanning — directly into their service delivery. What used to require a dedicated GRC hire or a quarterly consultant sprint becomes a continuous, always-on operational function.
Why the Business Case for IT Infrastructure Outsourcing Is Stronger Than Ever in 2026
Three forces have permanently shifted the calculus for most organizations:
The talent gap is structural, not cyclical. According to Gartner’s latest IT spending forecast, worldwide IT expenditure is growing 10.8% in 2026 — reaching $6.15 trillion — yet the talent supply has not kept pace. By 2027, Gartner projects companies will spend 50% more on IT contractors than internal IT staff across most industries, as hiring senior infrastructure engineers has become structurally difficult and expensive.
The second force is infrastructure complexity sprawl. A typical mid-market company in 2026 runs workloads across two or three cloud providers, manages legacy on-premises systems in parallel, operates containerized workloads on Kubernetes, and is adopting AI/ML pipelines that require GPU clusters and specialized networking. The surface area that needs to be monitored, secured, and optimized has grown faster than any lean in-house team can realistically govern.
The third force is continuous compliance pressure. SOC 2 Type II, ISO 27001, HIPAA, GDPR, PCI DSS — the audit burden on engineering organizations is no longer a once-a-year event. It is continuous evidence collection, continuous monitoring, and continuous remediation. Organizations without a dedicated compliance infrastructure function are simply accumulating risk. You can build a picture of the current threat landscape in our guide to IT infrastructure security best practices.
How we reduced infrastructure costs by 38% for a Series B fintech
A financial technology company with 280 employees approached Gart Solutions after their annual infrastructure bill crossed $2.4M — a 64% year-over-year increase driven by unmanaged cloud sprawl and three redundant monitoring tools their in-house team had neither the time nor the mandate to consolidate.
Over a 90-day transition and a six-month optimization phase, Gart assumed full managed operations of their multi-cloud environment (AWS primary, Azure DR), consolidated observability tooling onto a single OpenTelemetry-based stack, right-sized 140+ EC2 instances, implemented IaC governance via Terraform, and established SOC 2 Type II-aligned security monitoring.
IT Infrastructure Outsourcing Models: Which One Is Right for You?
One of the most common mistakes companies make is choosing the wrong engagement model — then blaming outsourcing itself when the results disappoint. Here is a clear-eyed breakdown:
| Model | Who Owns Operations | Best For | Typical Cost Structure | Control Level |
|---|---|---|---|---|
| Fully Managed Services | Provider end-to-end | Lean IT teams; companies scaling fast; orgs without mature in-house ops | Monthly flat fee or per-device/workload | Medium — outcomes defined by you |
| Co-Managed (Hybrid) | Shared — provider handles defined layers, client retains others | Mid-market firms with existing IT staff who need specialized depth in specific domains | Tiered subscription + domain-specific fees | High — shared accountability model |
| Staff Augmentation | Client manages — provider supplies engineers | Orgs with defined processes needing headcount, not a managed service | Monthly retainer per engineer | Full — client directs all work |
| Project-Based Outsourcing | Provider during project; client post-delivery | One-time transformation initiatives (cloud migration, DC exit, DR build) | Fixed-price or T&M | High — outcome-scoped engagement |
| Outcome-Based Contract | Provider — paid on delivered KPIs | Mature buyers seeking strategic partnership with financial accountability | Base fee + SLA performance bonuses/penalties | Medium — results-driven governance |
The co-managed model has become the dominant choice for companies in the $30M–$500M revenue range. It preserves your team’s strategic control while offloading the operational layer. For guidance on how consulting fits into your infrastructure strategy, see our IT infrastructure consulting services overview.
In-House vs. IT Infrastructure Outsourcing: A Direct Decision Framework
| Factor | In-House Team | IT Infrastructure Outsourcing |
|---|---|---|
| Total Cost of Ownership | High — salary + benefits + tooling licenses + PTO + attrition replacement (often 1.5–2× base) | Predictable monthly fee; tooling typically included; no hiring overhead |
| 24/7 Coverage | Difficult without 6–8+ engineers; on-call rotation burns out small teams | 24/7/365 NOC and SOC coverage included in managed service |
| Expertise Breadth | Limited by hiring budget; skill gaps are common and expensive to fill | Full specialist stack: cloud, security, networking, DB, FinOps — on-demand |
| Scalability Speed | 3–6 month hiring cycles for senior roles; slower than business demand | Elastic — capacity adjusted with days or weeks of notice |
| Tooling & Licensing | Full cost borne by the organization; often duplicated across teams | Shared across provider’s client base; enterprise rates; typically included |
| Compliance & Audit | Requires dedicated internal resource or expensive consultant engagements | Embedded in service delivery with automated evidence collection |
| Architecture Control | Full ownership of design and roadmap | Retained at architecture level; execution delegated |
| Key-Person Risk | High — losing one senior engineer can destabilize operations | Low — provider manages bench, continuity, and knowledge transfer |
When IT Infrastructure Outsourcing Is the Wrong Choice
Outsourcing is not the right answer for every organization. Here are the situations where keeping operations in-house — or taking a more limited co-managed approach — is the better call:
- Your infrastructure is your product.If your core business is the infrastructure itself (you are a cloud provider, a CDN, a hardware company), operational knowledge is too central to your competitive advantage to delegate. You need to own it.
- You cannot yet describe what “good” looks like.Outsourcing before you have defined SLAs, runbooks, and success metrics means handing over control without accountability. You will not be able to evaluate whether the provider is doing a good job — and neither will they.
- Your environment is undocumented and high-risk.A provider cannot safely take over what has not been documented. If your infrastructure has no runbooks, no architecture diagrams, and no incident history, you need a discovery and documentation phase first — often best done internally or through a consulting engagement rather than a managed services handover.
- You are at pre-product stage.Early-stage startups with small, experimental infrastructure and a CTO who wants to stay close to the stack are generally better served by a cloud-native, self-service approach (AWS managed services, GCP managed databases, etc.) than by a full managed services engagement.
What a Modern IT Infrastructure Outsourcing Stack Looks Like in 2026
A credible managed infrastructure provider should be able to demonstrate working knowledge — not just vendor logos — across the core tooling categories that define modern infrastructure operations. At Gart, our delivery stack includes:
Expertise across the modern stack
For a detailed breakdown of the IaC tooling landscape, see our comparison of top Infrastructure as Code tools. According to the Cloud Native Computing Foundation’s annual survey, Kubernetes adoption has reached 96% among enterprises — which means operational complexity has too. Providers who cannot demonstrate deep Kubernetes expertise are behind the curve.
The Process for Outsourcing IT Infrastructure
Gart aims to deliver a tailored and efficient outsourcing solution for the client’s IT infrastructure needs. The process encompasses thorough analysis, strategic planning, implementation, and ongoing support, all aimed at optimizing the client’s IT operations and driving their business success.
- Free Consultation
- Project Technical Audit
- Realizing Project Targets
- Implementation
- Documentation Updates & Reports
- Maintenance & Tech Support
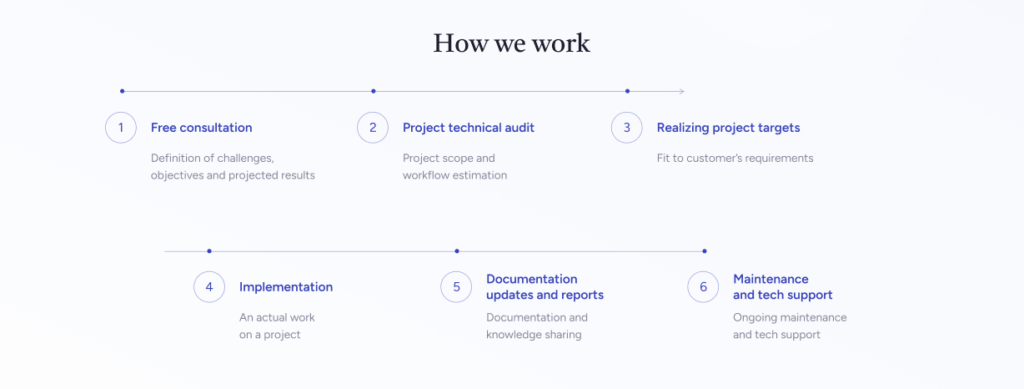
The process begins with a free consultation where Gart engages with the client to understand their specific IT infrastructure requirements, challenges, and goals. This initial discussion helps establish a foundation for collaboration and allows Gart to gather essential information for the project.
Then Gart conducts a comprehensive project technical audit. This involves a detailed analysis of the client’s existing IT infrastructure, systems, and processes. The audit helps identify strengths, weaknesses, and areas for improvement, providing valuable insights to tailor the outsourcing solution.
Based on the consultation and technical audit, we here at Gart work closely with the client to define clear project targets. This includes establishing specific objectives, timelines, and deliverables that align with the client’s business objectives and IT requirements.
The implementation phase involves deploying the necessary resources, tools, and technologies to execute the outsourcing solution effectively. Our experienced professionals manage the transition process, ensuring a seamless integration of the outsourced IT infrastructure into the client’s operations.
Throughout the outsourcing process, Gart maintains comprehensive documentation to track progress, changes, and updates. Regular reports are generated and shared with the client, providing insights into project milestones, performance metrics, and any relevant recommendations. This transparent approach allows for effective communication and ensures that the project stays on track.
Gart provides ongoing maintenance and technical support to ensure the smooth operation of the outsourced IT infrastructure. This includes proactive monitoring, troubleshooting, and regular maintenance activities. In case of any issues or concerns, Gart’s dedicated support team is available to provide timely assistance and resolve technical challenges.
Evaluating the Outsourcing Vendor: Ensuring Reliability and Compatibility
When evaluating an outsourcing vendor, it is important to conduct thorough research to ensure their reliability and suitability for your IT infrastructure outsourcing needs. Here are some steps to follow during the vendor checkup process:
Google Search
Begin by conducting a Google search of the outsourcing vendor’s name. Explore their website, social media profiles, and any relevant online presence. A well-established outsourcing vendor should have a professional website that showcases their services, expertise, and client testimonials.
Industry Platforms and Directories
Check reputable industry platforms and directories such as Clutch and GoodFirms. These platforms provide verified reviews and ratings from clients who have worked with the outsourcing vendor. Assess their overall rating, read client reviews, and evaluate their performance based on past projects.
Read more: Gart Solutions Achieves Dual Distinction as a Clutch Champion and Global Winner
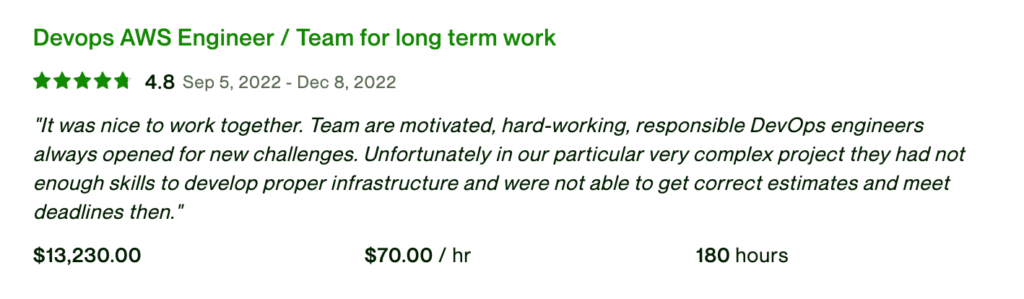
Freelance Platforms
If the vendor operates on freelance platforms like Upwork, review their profile and client feedback. Assess their ratings, completion rates, and feedback from previous clients. This can provide insights into their professionalism, technical expertise, and adherence to deadlines.
Online Presence
Explore the vendor’s presence on social media platforms such as Facebook, LinkedIn, and Twitter. Assess their activity, engagement, and the quality of content they share. A strong online presence indicates their commitment to transparency and communication.
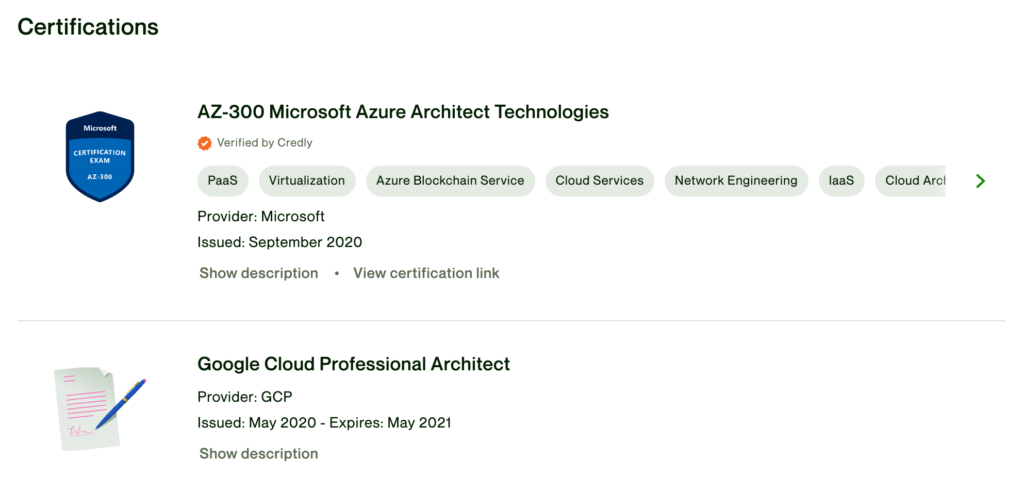
Industry Certifications and Partnerships
Check if the vendor holds any relevant industry certifications, partnerships, or affiliations.
Technical Expertise:
Review their team’s skills across infrastructure domains – servers, networks, cloud, security, and automation.
Cultural Fit and Communication:
Effective communication ensures smooth collaboration. Assess their language proficiency, time zone overlap, and responsiveness during initial consultations.
Scalability and Flexibility:
Check if they can scale resources quickly to match your evolving business needs.
Service Level Agreements (SLAs):
Evaluate guarantees on uptime, issue resolution times, data security, and exit processes.
By following these steps, you can gather comprehensive information about the outsourcing vendor’s reputation, credibility, and capabilities. It is important to perform due diligence to ensure that the vendor aligns with your business objectives, possesses the necessary expertise, and can be relied upon to successfully manage your IT infrastructure outsourcing requirements.
Why Ukraine is an Attractive Outsourcing Destination for IT Infrastructure
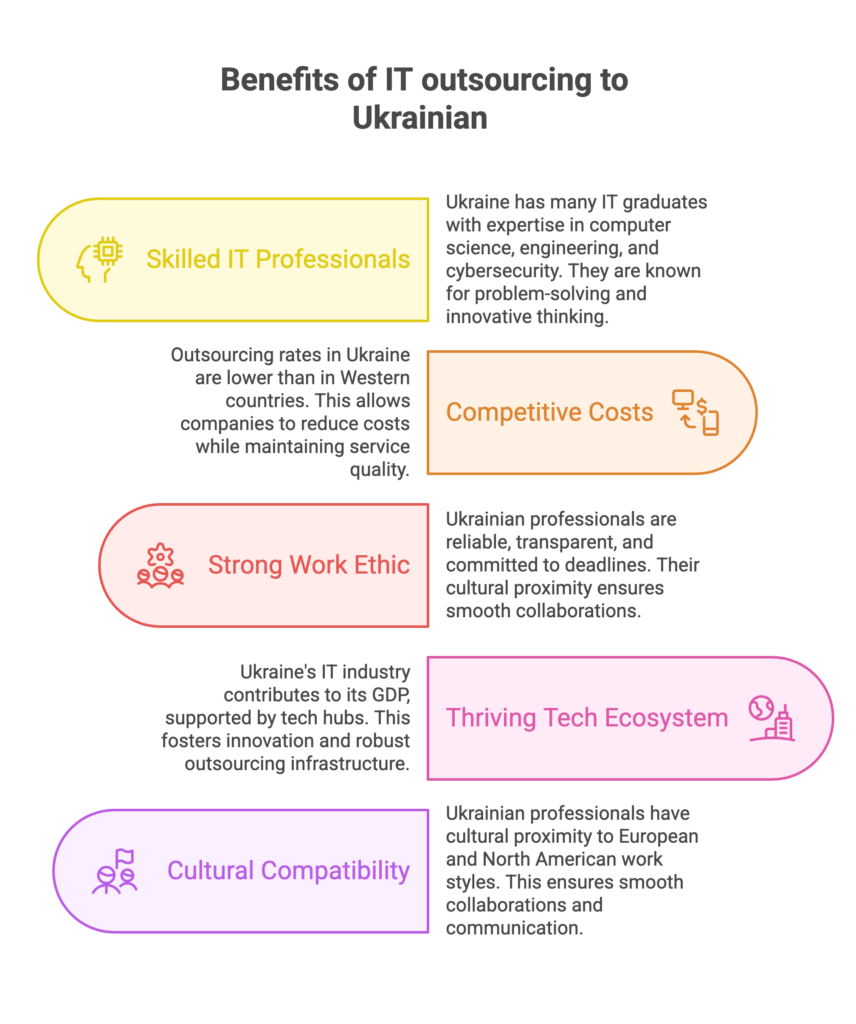
Ukraine has emerged as a prominent player in the global IT industry. With a thriving technology sector, it has become a preferred destination for outsourcing IT infrastructure needs.
Ukraine is renowned for its vast pool of highly skilled IT professionals. The country produces a significant number of IT graduates each year, equipped with strong technical expertise and a solid educational background. Ukrainian developers and engineers are well-versed in various technologies, making them capable of handling complex IT infrastructure projects with ease.
One of the major advantages of outsourcing IT infrastructure to Ukraine is the cost-effectiveness it offers. Compared to Western European and North American countries, the cost of IT services in Ukraine is significantly lower while maintaining high quality. This cost advantage enables businesses to optimize their IT budgets and allocate resources to other critical areas.
English proficiency is widespread among Ukrainian IT professionals, making communication and collaboration seamless for international clients. This proficiency eliminates language barriers and ensures effective knowledge transfer and project management. Additionally, Ukraine shares cultural compatibility with Western countries, enabling smoother integration and understanding of business practices.
The Gart 5-Step Infrastructure Optimization Model
Every Gart managed infrastructure engagement follows the same structured delivery model — designed to eliminate the instability that plagues most outsourcing transitions and to move from reactive management to proactive optimization as fast as possible.
Discovery & Current State Assessment
We conduct a full technical inventory of your environment: cloud accounts, compute and storage footprint, network topology, security posture, observability coverage, runbook completeness, and open incident backlog. This produces a CSA document that becomes the baseline for SLA definitions and optimization targets. Duration: 2–4 weeks.
Shadow Operations & Knowledge Transfer
Before assuming responsibility, our team shadows your current operations — monitoring alongside your team, documenting tribal knowledge, and running fire drills for the most common incident types. This eliminates blind spots and ensures continuity. Duration: 2–4 weeks (overlapping with discovery).
Controlled Handover & Stabilization
Operational responsibility transfers domain by domain — not all at once. We start with monitoring and alerting, then incident response, then change management. Each domain is handed over only after documented runbooks are in place and the shadow period has been completed. Duration: 4–8 weeks.
Baseline Optimization
Once in steady-state, we conduct a structured optimization pass: right-sizing compute resources, consolidating overlapping tooling, implementing or improving IaC coverage, and establishing automated compliance reporting. This is where the majority of cost savings are realized. Duration: months 3–6.
Continuous Improvement & Strategic Partnership
From month 6 onward, the engagement shifts to continuous improvement: quarterly architecture reviews, proactive capacity planning, FinOps governance, and contribution to your engineering roadmap. Monthly business reviews track KPIs against baseline. This is the phase where the real strategic value of outsourcing is realized.
Our managed IT infrastructure services are structured around this model for every engagement. If you want to understand how this maps to your specific environment, request a free infrastructure cost audit – we typically turn these around in 48 hours.
Long Story Short
IT infrastructure outsourcing empowers organizations to streamline their IT operations, reduce costs, enhance performance, and leverage external expertise, allowing them to focus on their core competencies and achieve their strategic goals.
By delegating complex infrastructure management to specialized providers, businesses can:
- Access advanced expertise and technologies
- Scale flexibly with market demands
- Strengthen cybersecurity and compliance
- Focus internal teams on strategic innovation
- Optimize costs with predictable budgets
In a world where digital resilience defines market leadership, outsourcing IT infrastructure is your ticket to agility, efficiency, and sustainable success.
Ready to unlock the full potential of your IT infrastructure through outsourcing? Reach out to us and let’s embark on a transformative journey together!
Get a Free Infrastructure Cost Audit in 48 Hours
We will review your current infrastructure environment, identify the top cost optimization and reliability improvement opportunities, and give you a clear picture of what a managed services engagement would look like — with no obligation and no sales pressure. 18+ years of infrastructure delivery. Real engineers, not account managers.