One of the first challenges you may encounter when adopting SRE (Site Reliability Engineering) and DevOps practices is the development culture. Without embracing the underlying culture and mindset of SRE, you’ll simply end up with new processes, employees, and a collection of well-known books, but you won’t achieve the same level of success as the Google folks, if only because the conditions are different.
Focusing on system reliability requires a reevaluation of your organization’s approach as a socio-technical system of several key aspects.
- How do customers use your systems, and what’s important to them?
- How do teams approach incidents? What lessons have been learned? Do teams have trusting relationships?
Are decisions data-driven?
Key Metrics
According to the classic approach, when implementing SRE, the first step is to define SLIs, SLOs, and SLAs.
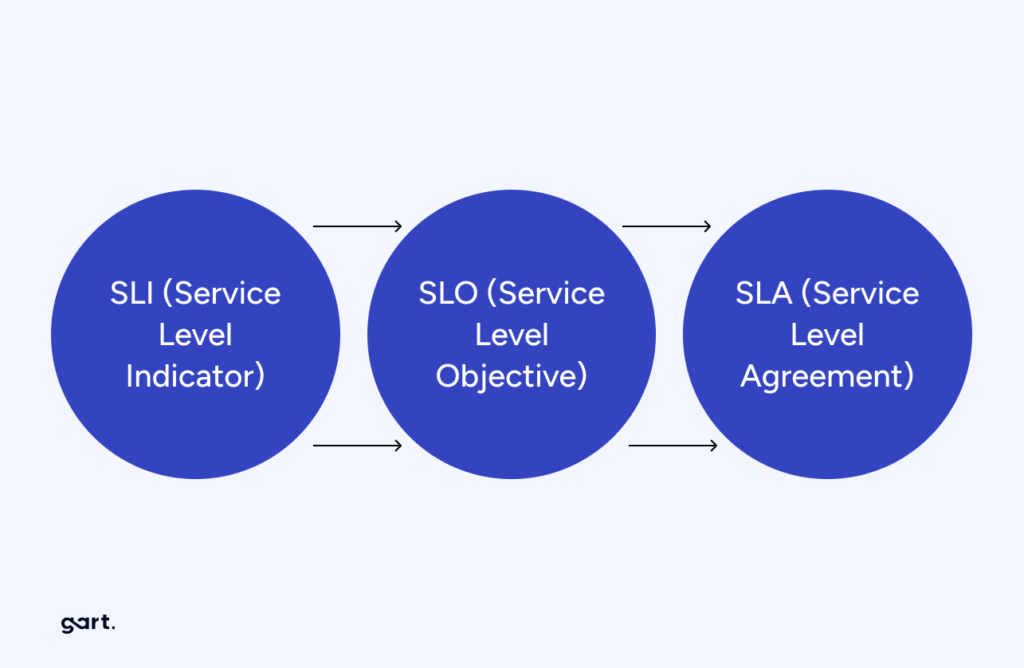
SLIs (Service Level Indicators)
SLIs are quantitative measures that are often aggregated over a measurement window and expressed as a ratio, average, or percentile.
SLIs are typically the ratio of two numbers: the number of good events divided by the total number of events.
For example, you can look at the number of successful HTTP requests divided by the total number of HTTP requests. The SLI value will range from 0% (nothing is working) to 100% (nothing is broken).
To help teams define SLIs, we decided to initially adopt the approach used at Google – the same “four golden signals” (latency, traffic, errors, and saturation).
Latency is a measure that indicates delays, specifically the time it takes to process a request. Low values suggest that the system can process requests quickly, while high values mean that requests are executing slowly.
Traffic measures the rate of requests over a given period.
Errors measure the number of failed requests.
Saturation measures the number of requests the system is currently processing.
Monitoring these signals is a hygienic minimum and helps ensure that system performance remains at the desired level and identifies areas for improvement.
Unfortunately, in the early iterations, you may only be able to define a subset of these metrics, but it’s essential to document at least those that are available. The recommendation to “eat the elephant one bite at a time” is appropriate here.
Typically, the critical user path describes a set of user interactions with a service or chain of services to achieve a specific end result. For example, it could be adding an item to a cart and placing an order. It usually looks something like this.
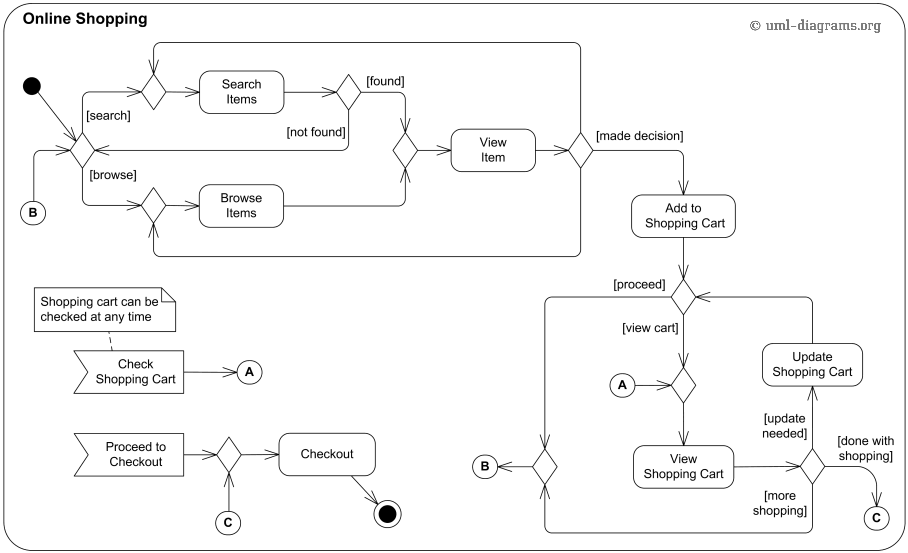
Where do you get these SLIs? A good step is to map the critical user path to your existing metrics: if any are missing, you can always add them, and the business team can usually help with this.
Now, let’s talk about the technical side. This is necessary so that we understand each other and have a common terminology. We collect application metrics, and these metrics are typically stored in a TSDB (Time Series Database). To gain an overall understanding of metrics in these storage and monitoring systems, let’s explain what it consists of. Typically, it includes values, samples, metrics, and time series.
Value is a numeric value at any given point, essentially the result of a measurement. For example, 100,500 HTTP requests that the service received since its startup.
Sample is a value + timestamp. For example, 100,500 HTTP requests that the service received since startup, measured at 2022-12-31 16:30 UTC.
Metric is a unique identifier for the measured resource. It consists of a metric family name with attached labels. For example, http_requests_total{pod=”billing-1″} and http_requests_total{pod=”delivery-2″} are two different metrics from the http_requests_total metric family.
Time series (often referred to as “series”) is a Metric + any number of associated Samples with that ID. For example, http_requests_total{pod=”billing-1″} with samples 700@16:30:00 UTC, 800@16:30:15 UTC, 900@16:30:15 UTC, and so on.
Active time series (often referred to as “active series”) is a Metric that has recorded at least one sample within the last 20 minutes.
SLOs (Service Level Objectives)
SLOs are clearly defined, specific objectives or promises for system availability.
SLOs help identify the dividing line between user happiness and unhappiness, indicating the system’s state and whether it is operating reliably from the users’ perspective.
We believe that SLOs are an internal promise of the system’s quality level that should be achieved. Since it’s a promise, it can be private or public. However, we consider it a good practice to publish them for neighboring teams. This helps understand dependencies and aids in planning future sprint work based on data.
But for abstract user happiness, it’s not enough to just collect data; you also need to define an Error Budget and Burn Rate.
The Error Budget is the amount of errors (defined by the SLIs) that you can have over a given period, depending on the chosen SLO values. If you’re too lazy to calculate it in your head, there’s a calculator (https://uptime.is/).
The Burn Rate is the rate at which you’re consuming your Error Budget. We use this as one approach to alerting for working on managing our SLOs as promises and the service level we’ve promised. The rate at which you burn through your Error Budget determines what needs to be planned for the next sprint and where the team’s focus should be.
In general, it’s fair to say that the stories from SRE books only work at Google. On paper, everything looks great, but in practice, it turns out that it only works for them. Nevertheless, it’s a great idea they’re promoting: you don’t need to display hundreds of metrics on a dashboard; for starters, even a single SLO value for availability is enough.
If the four golden signals aren’t enough, you can use other indicators as well.
For example, in addition to the four golden signals, you can use metrics like response time, output accuracy, resource utilization, and scalability for applications.
For databases and sometimes for big data, common metrics include query efficiency and latency, data quality and integrity, backup and recovery time, and availability in terms of how quickly you can read data that has been written.
For queues, you can use metrics like frequency, message count and size, latency, error rate, and successful delivery metrics. I’m confident this topic could be the subject of a separate article, book, or workshop.
What are some other ways to improve application reliability, regardless of their language or platform?
For applications, some common methods include isolating components, implementing self-healing strategies, and performing periodic health checks.
A classic story: a user complains about the service’s availability, and of course, it turns out that everyone on the team says, “Everything is working! I just accessed it, and it’s all opening!” However, the user doesn’t care that one of the microservices teams’ applications is working. For them, the service is not working; they’re not receiving the service. Service availability from the user’s perspective is the top priority from an SRE standpoint. This is a crucial point, and it requires a mindset shift.
To observe the system from the “user’s eyes,” regular monitoring systems are not enough. You can always set up conditional monitoring and see that pods are restarting or memory is 90% occupied, but that’s usually irrelevant if the user can’t place an order, for example, for a Christmas tree, or they see a placeholder asking them to turn off their VPN. If pods are restarting, that’s fine; if memory is 90% occupied, that’s also fine. Users won’t even notice because it’s not a failure situation. But if the user’s cart is unavailable, that’s a problem.
Here’s a table explaining SLIs (Service Level Indicators), SLOs (Service Level Objectives), and SLAs (Service Level Agreements):
| Term | Definition | Purpose |
|---|---|---|
| SLI (Service Level Indicator) | Quantitative measures that capture the level of service provided by a system or component. SLIs are typically expressed as a ratio, average, or percentile. | SLIs provide a way to objectively measure and monitor the performance and reliability of a system or service. Examples include request latency, error rate, and availability percentage. |
| SLO (Service Level Objective) | Target values or thresholds set for specific SLIs, defining the desired performance level or reliability goal for a system or service. | SLOs represent the promised level of service that the system or service aims to deliver. They act as internal commitments or targets for teams to strive towards, helping to align priorities and set appropriate expectations. |
| SLA (Service Level Agreement) | A formal agreement or contract between a service provider and a customer or client, specifying the minimum level of service that will be provided. | SLAs are typically external-facing commitments made to customers or clients, outlining the guaranteed service level they can expect. SLAs often include penalties or compensations if the agreed-upon service level is not met. |
Requests for Change (RFCs)
Let’s talk about changes and how to manage them. We love and value the RFC (Request for Change) process.
The term “RFC” refers to both the process and the artifact in the form of a document.
When one service team wants to introduce a change to production, they must obtain approval from the teams of dependent services. For example, someone might say, “Our team wants to roll out a change that will affect the API contract with another service.” Their dependencies respond, “No, we have traffic at this time, let’s reschedule.” They agree on an appropriate time and only then make the changes. RFC is an integral part of SRE.
Different people participate in the process across various teams. It could be a developer or a delivery manager who is interested in ensuring their service meets its promises. We believe that managing the service level starts with transparency and change planning, which means you’ve described in detail the changes to be made, which neighbors will be affected, how much time is planned, and how long it will take to roll back.
Checklists
One day, you’ll think it would be nice to have a production readiness checklist with checks.
Production readiness is, again, both a process and a document that enable you to start designing service reliability in production. The result of the work is a document with a list of identified issues, which in the long run should reduce the effort and risks that the product may encounter.
A well-crafted checklist is an essential component of readiness.
Instead of attempting to create a perfect checklist, use common sense and past experience to identify important topics for discussion. The goal is to fill gaps that could pose significant risks, not to develop a checklist that can cover everything.
One of the critical factors to consider when developing a checklist is not to get too far ahead of the current state of the systems.
The best practices being followed and the state of the products should be considered when creating a checklist that provides specific, useful information that fosters feedback. Getting too carried away with best practices and recommendations (e.g., discussing the coding patterns being used) can become a slippery slope, slowly turning readinesses into an architectural review with a few practical suggestions.
After compiling the first version, the checklist will be far from perfect, and it won’t be possible to solidify it in an immutable form. As teams, tools, and culture evolve, the checklist will require updates.
Such approaches are widely used at Google, Spotify, RingCentral, Grafana, Weaveworks, and other technology companies.
Checklists are the foundation for future automation.
It’s a good practice to publish your checklist. This could be a page in a knowledge storage system within the company or a repository on GitHub.
Incidents
Incident management is probably the main pillar from which the SRE culture grew. What’s important is to mitigate the impact and then discuss how to prevent similar system behavior in the future, for this or other systems, and share your experience and observations with colleagues.
For example, the impact can be internal or infrastructural, or it can have a negative effect on the user experience.
If an incident occurs, an engineer must answer three questions:
- What happened?
- What is the impact?
- What are the next steps?
After that, a few decisions need to be made:
- Open an incident, or is this not an incident at all?
- What steps should be taken to mitigate the impact, are these temporary or long-term steps?
- Maybe allocate more resources (involve other teams/experts)?
Postmortems are Good
As is well known, a good postmortem is a completed postmortem.
A postmortem (or root cause analysis report) is both a process and a document for investigating an incident and determining its causes. It helps identify weaknesses in the system and develop measures to address them to avoid similar situations in the future.
A postmortem is part of the system reliability management process and typically includes the following steps:
Gathering information about the incident: time and date of occurrence, details of the problem, which services and components were affected.
Determining the cause of the incident: finding the root cause of the problem and identifying any factors that might have triggered it.
Developing an action plan: compiling a list of actions that need to be taken to address the problem and prevent its recurrence.
Perhaps the most interesting part after investigating the event is the subsequent action plan. And here, a wide range of approaches is open. For example, how to fix it for the service. How to approach the plan from a system design perspective. How to scale your changes to similar types of services. Where else in the components there is a likelihood of repeating the same mistake. How to start a new initiative if it goes beyond the sprint task.
Let this be a friendly reminder: if you don’t have a process and detailed documents, it’s time to try them in your teams. It’s fun!
Retrospectives
A retrospective is one way for members of your team to learn what they’re doing right, where they can improve, how to avoid repeating the same mistakes, and most importantly, how to think critically about how they work together. Well-designed retrospectives allow teams to iteratively improve their product and collaboration process.
The basic rule for retros and postmortems is blameless rhetoric. This helps build trust in your cats.
Wheel of Misfortune
The next best practice that will help your engineers be higher, stronger, and more senior is to conduct thought experiments. “What?!” you might say. “Projects for half a year ahead, and he’s proposing thought experiments!” But this is no joke.
The Wheel of Misfortune is a great excuse to get together and draw some graphs.
The goal of the thought experiment is to build confidence in on-call engineers by simulating failure scenarios. This is a case where you practice debugging issues in a stress-free environment, improve your understanding of the incident management process, and make strides in effectively communicating with other engineers on your team. It’s a great way to train new employees, interns, and even experienced professionals. The Wheel of Misfortune will be enjoyed by all.
Training engineers is, above all, fun…and useful.
See how we can help to overcome your challenges