- From Monitoring to Observability: What Actually Changed
- Concrete example — the same incident, two approaches:
- Why Observability Is Now a Board-Level Concern
- The Technical Foundations: Beyond the Three Pillars
- eBPF: The Engine Behind Frictionless Observability
- OpenTelemetry: The End of Vendor Lock-In
- Solving the Cardinality Problem with Unified Data Lakehouses
- AIOps 2.0: From Alerts to Autonomous Operations
- Observability Economics: Visibility with Financial Discipline
- Observability Maturity Model: Where Does Your Organization Stand?
- How to Build a Modern Observability Stack: Implementation Guidance
- Not Sure What’s Costing You Visibility?
- Observability as a managed strategic service
- Final thought: reliability is the new competitive advantage
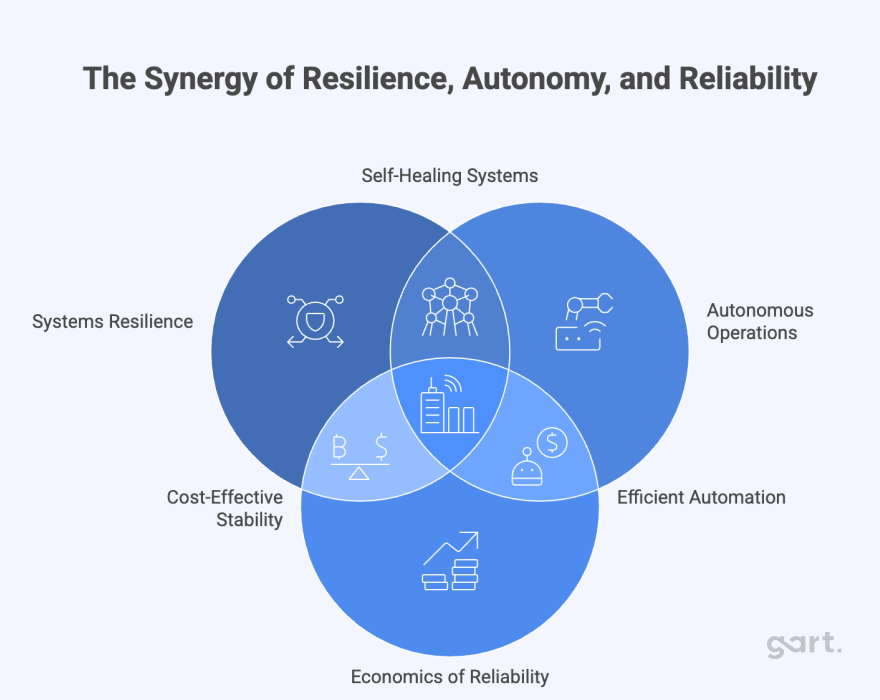
⚡ Key Takeaways
- What is observability? It’s the ability to understand a system’s internal state solely from its external outputs — without knowing the failure mode in advance.
- Modern observability goes beyond three pillars (metrics, logs, traces) to include continuous profiling as a fourth signal.
- eBPF eliminates instrumentation overhead; OpenTelemetry eliminates vendor lock-in. Together they are the 2026 standard.
- Observability costs are growing 40–48% year-over-year — FinOps practices are now mandatory, not optional.
- AI-driven SRE agents can now correlate telemetry, explain incidents in natural language, and execute supervised remediation.
What is observability, and why has it become one of the most strategically important capabilities an enterprise can build in 2026? Today’s infrastructure — ephemeral microservices, multi-cloud Kubernetes clusters, hundreds of loosely coupled components that exist for seconds at a time — has made traditional monitoring structurally insufficient. Observability is the answer: not a tooling upgrade, but an operating model shift that directly protects revenue, accelerates incident resolution, and governs cloud spend.
This guide draws on Gart Solutions’ hands-on experience deploying observability stacks across fintech, SaaS, healthcare, and e-commerce environments. It covers everything from foundational definitions and eBPF architecture to OpenTelemetry configuration pitfalls, telemetry cost governance, and practical implementation workflows.
From Monitoring to Observability: What Actually Changed
Monitoring was built for predictable systems. It answers predefined questions by watching known metrics and triggering alerts when thresholds are crossed. This works when architectures are static and failure modes are understood in advance. Modern cloud-native systems are neither.
Observability is the ability to infer the internal state of a system by analyzing its external outputs — without knowing the failure mode in advance.
The practical difference is significant. A monitoring system detects that something is wrong; an observability platform tells you why, where, and since when — even for failure modes no one anticipated.
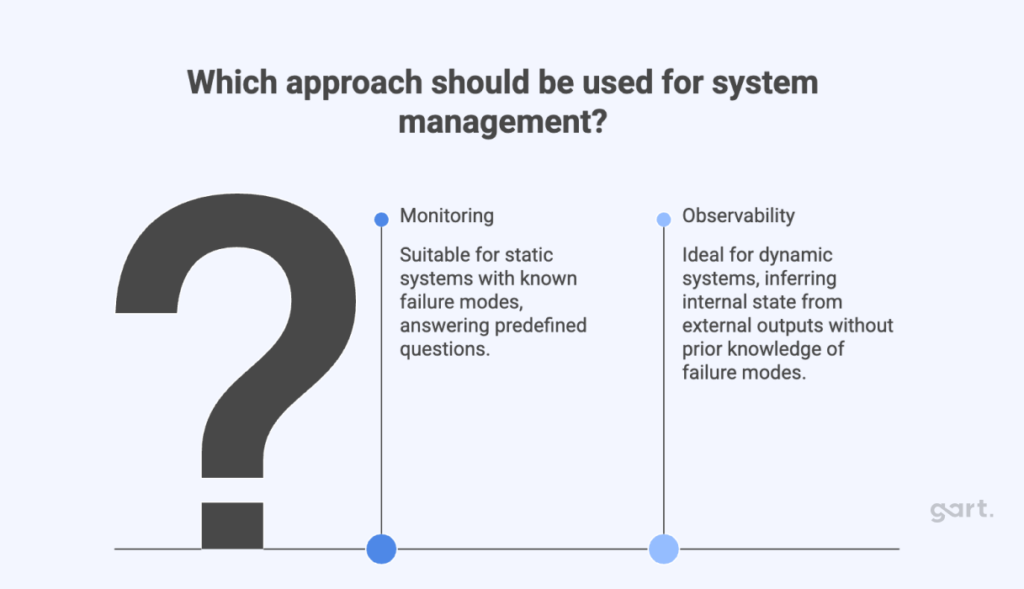
Concrete example — the same incident, two approaches:
Monitoring: An alert fires: “API latency exceeded 500ms threshold on checkout-service.” Engineers begin manually checking CPU, memory, recent deployments. Investigation takes 47 minutes.
Observability: A trace visualization immediately shows that checkout-service v2.7.3 — deployed 18 minutes ago — introduced a synchronous database call inside a previously async payment flow. The affected pod ID, the specific slow query, and the code path are all visible in a single trace. The team rolls back in 8 minutes. MTTR: reduced by 83%.
This is the operational reality of what is observability in practice: not more dashboards, but faster answers to harder questions.
Why Observability Is Now a Board-Level Concern
Downtime is no longer just a technical inconvenience. According to Gartner, the average cost of IT downtime exceeds $5,600 per minute — and for high-scale digital businesses, the real impact is substantially higher once churn, SLA penalties, and reputational damage are factored in.
| Incident Duration | Business Impact | SLA Status |
|---|---|---|
| Under 5 minutes | Minimal; absorbed by error budget | ✅ Green |
| 15–30 minutes | SLA risk; customer experience degraded | 🟡 Yellow |
| 1–2 hours | SLA breach; customer churn risk begins | 🔴 Red |
| 2+ hours | Regulatory exposure, reputational damage, churn | 🔴 Critical |
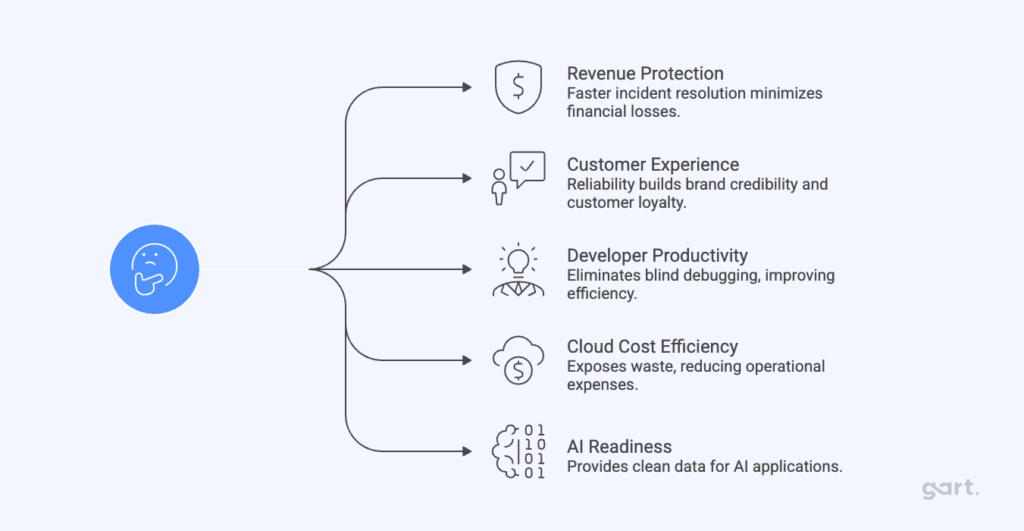
For leadership teams, observability has become part of operational risk management — not just IT tooling. Organizations that invest in modern observability practices report measurable improvements across five business dimensions: revenue protection through faster incident resolution, customer experience, developer productivity, cloud cost efficiency, and AI readiness.
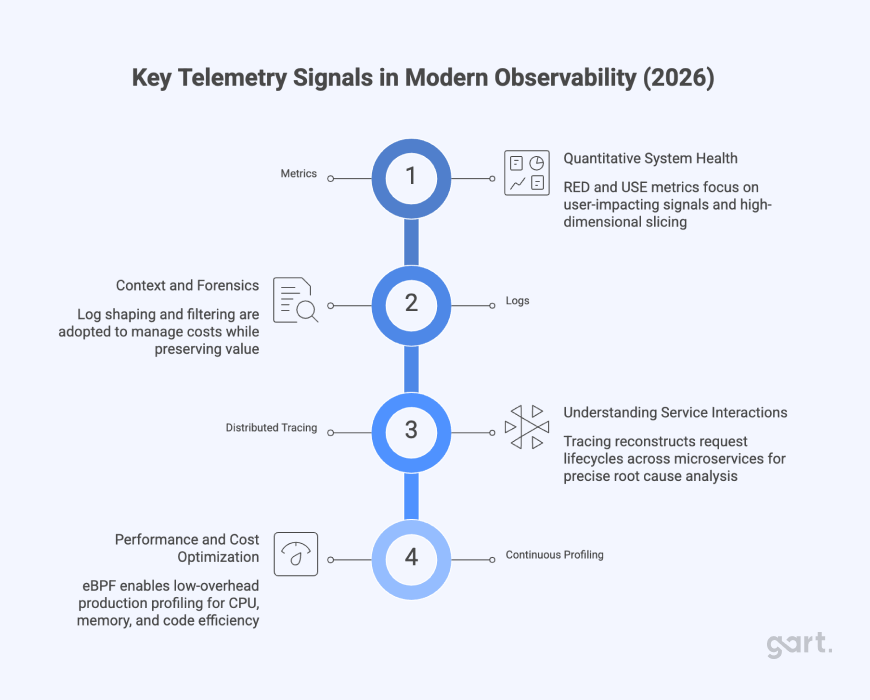
The Technical Foundations: Beyond the Three Pillars
Modern observability is built on four core telemetry signals. Understanding each — and when to rely on it — is foundational to building a cost-effective observability stack.
1. Metrics — Quantitative System Health
Metrics remain essential for alerting and trend analysis. In 2026, the focus has shifted toward user-impacting signals rather than raw infrastructure counters. The two frameworks that consistently deliver the most actionable signals are:
- RED metrics: Request rate, Errors, Duration — optimized for service-level health
- USE metrics: Utilization, Saturation, Errors — optimized for resource-level health
High-dimensional metrics enriched with labels (region, service version, pod ID) allow precise slicing of system behavior without pre-aggregation — a critical capability when debugging multi-tenant failures in Kubernetes environments.
2. Logs — Context and Forensics
Logs provide the narrative behind failures: error messages, stack traces, execution context. However, log volume has become a serious financial problem. Many enterprises now spend over half of their observability budget on logs alone, driving adoption of log shaping, tail-based filtering, and edge processing to control costs while preserving forensic value.
3. Distributed Tracing — Understanding Service Interactions
Tracing reconstructs the full lifecycle of a request across dozens of services — making it indispensable in microservice architectures. Without tracing, teams know something is slow. With tracing, they know exactly where and why, down to the specific span, service, and deployment version.
The Cloud Native Computing Foundation (CNCF) reports that distributed tracing is now the single most impactful observability investment for organizations operating more than 10 microservices.
4. Continuous Profiling — The Fourth Signal
The most impactful evolution of recent years is continuous profiling. Using low-overhead eBPF-based techniques, profiling now runs safely in production environments, exposing CPU hot paths, memory leaks, performance regressions, and inefficient code execution. This enables teams to optimize both performance and cloud costs before users are affected.
eBPF: The Engine Behind Frictionless Observability
Extended Berkeley Packet Filter (eBPF) has become the foundational technology behind modern observability platforms. By running verified programs directly in the Linux kernel, eBPF enables zero-code instrumentation, kernel-level visibility into networking, I/O, and system calls — with near-native performance and minimal overhead.
| Capability | Sidecar Model | eBPF Model |
|---|---|---|
| Instrumentation | Manual, per-service | Automatic, node-level |
| Resource overhead | High (separate container per pod) | Low (<1% CPU in production) |
| Language dependency | Yes — separate agent per runtime | No — kernel-level, language-agnostic |
| Deployment complexity | High — update per pod | Minimal — single DaemonSet |
| Network visibility | Limited to application layer | Full — L3/L4/L7 + system calls |
Common Mistakes When Adopting eBPF in Kubernetes Environments
eBPF’s power comes with real operational complexity. Based on our implementations across Kubernetes clusters on AWS EKS, GKE, and bare-metal:
- Kernel version mismatches: eBPF features vary significantly across kernel versions (4.x vs 5.x vs 6.x). Always audit kernel versions across all node groups before selecting an eBPF-based agent. Cilium, for example, requires kernel 4.9+ for basic functionality and 5.3+ for advanced features.
- Security team friction: Running programs in kernel space raises legitimate security concerns. Address this early by reviewing the eBPF program verification model and working with security teams to establish allowed program types. Tools like Falco use eBPF in a read-only, restricted mode that satisfies most enterprise security policies.
- Managed Kubernetes limitations: GKE Autopilot and some EKS Fargate configurations restrict eBPF access. Always verify host-level access is available before architecting around eBPF-native tools.
OpenTelemetry: The End of Vendor Lock-In
By 2026, OpenTelemetry (OTel) has become the universal standard for telemetry collection, with adoption across Google Cloud, AWS, Azure, Datadog, and virtually every enterprise observability platform. Its strategic impact goes beyond instrumentation: it decouples data collection from analytics, forces vendors to compete on insight quality rather than lock-in, and future-proofs observability investments.
How OpenTelemetry Works: Collector Architecture
The OpenTelemetry Collector is the architectural centerpiece. It operates as a pipeline: receivers ingest telemetry from agents and SDKs, processors transform and sample data, and exporters route signals to storage backends. In 2026, the Collector functions as a full telemetry policy engine — handling redaction, tail-based sampling, cost-based routing, and buffering at scale.
Typical OTel Collector pipeline (simplified):
Receivers: OTLP, Prometheus, Jaeger, Fluent BitProcessors: batch, memory_limiter, tail_sampling, redaction (PII removal)Exporters: Grafana Tempo (traces), Prometheus (metrics), Loki (logs), Datadog (fallback)
Common OpenTelemetry Pitfalls
Organizations that rush OTel adoption without planning frequently encounter the same set of problems:
- Cardinality explosion: Adding high-cardinality attributes (user IDs, request IDs) as metric labels without understanding the downstream storage cost. A single label with 1M unique values can multiply storage costs 100x in Prometheus.
- Head-based sampling by default: Randomly sampling 10% of all traces misses the 0.1% of traces that contain errors. Always implement tail-based sampling via the OTel Collector to guarantee error trace retention at 100%.
- SDK version drift: When multiple teams instrument independently, SDK versions diverge. Establish a central instrumentation library that wraps the OTel SDK — this ensures consistent attribute naming, sampling configuration, and upgrade paths.
Solving the Cardinality Problem with Unified Data Lakehouses
High-cardinality data — user IDs, request IDs, container IPs — is incredibly valuable and incredibly expensive in legacy observability systems. In response, 2026 has seen a major shift toward unified columnar data platforms such as ClickHouse, capable of handling billions of records with sub-second query performance.
Storing logs, metrics, and traces together in a single queryable platform enables cross-signal correlation using SQL — eliminating the “tool hopping” that slows incident response. Organizations that have made this architectural shift report query costs dropping by orders of magnitude compared to Elasticsearch-based stacks.
AIOps 2.0: From Alerts to Autonomous Operations
The most significant shift in observability is not more data — it’s what systems do with it. AIOps has evolved beyond anomaly detection into causal intelligence and supervised agentic automation.
Modern AI-driven SRE agents in 2026 can correlate telemetry across the entire stack, explain incidents in natural language (“this latency spike is caused by lock contention in the payment-db replica, introduced by migration 0047 at 14:23 UTC”), execute supervised remediation actions, and predict capacity risks before they impact users.
Observability data — clean, correlated, and well-instrumented — is the fuel that makes autonomous IT operations possible. Organizations that invest in telemetry quality today are positioning themselves for significant competitive advantage as AI SRE capabilities mature.
Observability Economics: Visibility with Financial Discipline
By 2026, observability has become one of the fastest-growing cost centers in enterprise IT. Metrics, logs, traces, profiles, and security signals now generate petabytes of data annually — often without clear governance or economic accountability. The central question is no longer “Can we observe everything?” but:
How much observability do we need — and what is the business value of each signal we collect?
Just as cloud spending required FinOps practices, observability now demands its own discipline: FinOps for Observability. High-performing organizations have shifted from “collect everything” to value-based telemetry, where every signal must justify its cost against one of three criteria: protecting revenue, reducing incident duration, or improving developer productivity.
Telemetry Retention Strategy by Signal Type
| Signal Type | Recommended Retention | Sampling Rate | Rationale |
|---|---|---|---|
| Error traces | 90 days | 100% | Critical for RCA and compliance |
| Slow traces (>p95) | 30 days | 100% | Performance regression analysis |
| Healthy request traces | 7 days | 5–10% | Baseline behavior only |
| Error logs | 90 days | 100% | Forensic and audit requirements |
| Info/debug logs | 24–72 hours | Filtered at edge | High volume, low long-term value |
| Infrastructure metrics (raw) | 15 days | 100% | Incident correlation window |
| Aggregated metrics | 18 months | Pre-aggregated | Capacity planning, trend analysis |
| Profiling samples | 7 days | Continuous, low-overhead | Performance optimization cycles |
Observability Tool Consolidation: The Hidden Cost Driver
Despite market maturity, most enterprises in 2026 still operate multiple overlapping observability platforms. Industry data shows approximately 66% of organizations use two or three tools, while only ~10% have successfully consolidated. Each additional tool multiplies ingestion, storage, and operational overhead — creating a compounding cost problem that tool selection alone cannot solve.
| Platform | Best For | Pricing Model | Key Strength | Main Limitation |
|---|---|---|---|---|
| Datadog | Full-stack, enterprise | Per host/GB | Best-in-class UX, unified APM + logs + traces + AI | Bill shock without governance; vendor lock-in |
| Grafana Stack (OSS) | Cost-conscious, cloud-native | Free / Grafana Cloud | Vendor-neutral; Prometheus + Loki + Tempo + Mimir | Requires engineering investment to operate |
| New Relic | APM, user monitoring | Per user/data ingested | Deep transaction tracing, browser RUM | Pricing unpredictable at scale |
| Dynatrace | Enterprise AI-driven | Per host / DEM unit | Davis AI root cause, auto-discovery | Premium pricing, complex licensing |
| OpenTelemetry + ClickHouse | High-cardinality, cost control | Infrastructure cost only | SQL-based correlation, orders-of-magnitude cost reduction | Requires custom querying layer |
Observability Maturity Model: Where Does Your Organization Stand?
At Gart Solutions, we evaluate observability maturity across four levels before designing an implementation roadmap. Most enterprises we engage arrive at Level 2; the strategic goal is Level 4.
| Level | Characteristics | Typical MTTR | Cost Profile |
|---|---|---|---|
| Level 1 — Reactive Monitoring | Static dashboards, threshold alerts, no tracing | 2–8 hours | Low cost, high incident cost |
| Level 2 — Structured Observability | Metrics + logs + some tracing; fragmented tools | 30–90 minutes | Growing cost, moderate governance |
| Level 3 — Platform Observability | OpenTelemetry standardized; unified storage; SLO-based alerting | 5–20 minutes | Optimized; FinOps governance in place |
| Level 4 — Autonomous Operations | AI-driven correlation, supervised remediation, predictive scaling | <5 minutes | Value-based telemetry; cost predictable |
🔍 Not sure where your organization sits? Gart offers a free 30-minute Observability Maturity Assessment — we map your current state, identify the highest-ROI gaps, and outline a phased roadmap. Book your assessment
How to Build a Modern Observability Stack: Implementation Guidance
Based on observability deployments across SaaS, fintech, and healthcare environments, these are the architectural decisions that determine long-term success.
Phase 1: Standardize Instrumentation (Weeks 1–4)
The single highest-impact action is adopting OpenTelemetry as the instrumentation standard across all services. This prevents vendor lock-in from day one and creates a consistent telemetry schema for cross-signal correlation. Deploy an OTel Collector as a DaemonSet in Kubernetes; configure tail-based sampling immediately to control trace costs.
Phase 2: Consolidate Storage (Weeks 4–8)
Evaluate your current tool sprawl against a unified storage architecture. For organizations with significant existing investment in commercial platforms, an OTel-based abstraction layer (route signals to the existing backend while building the new one in parallel) reduces migration risk. For greenfield stacks, Grafana Stack (Mimir + Loki + Tempo + Grafana) provides enterprise-grade capability at dramatically lower cost than SaaS alternatives.
Phase 3: Implement FinOps Governance (Weeks 8–12)
Introduce per-service telemetry cost visibility using the OTel Collector’s cost attribution capabilities. Define retention policies by signal type (see table above). Establish engineering team accountability for the telemetry they generate. This phase consistently delivers 30–50% observability cost reduction in our client engagements.
For organizations using Kubernetes at scale, the Linux Foundation‘s OpenTelemetry governance guidelines provide an excellent framework for establishing organization-wide instrumentation standards.
Not Sure What’s Costing You Visibility?
Gart Solutions designs and implements observability architectures for cloud-native engineering teams — from OpenTelemetry standardization to FinOps governance and eBPF-based profiling.
Observability as a managed strategic service
Observability has crossed a threshold. It is no longer a collection of dashboards—it is digital nervous system for the enterprise.
For organizations navigating this complexity, the challenge is not choosing tools, but designing an operating model that aligns technology, cost, and business outcomes.
At Gart Solutions, observability is approached as a managed strategic capability—combining architecture design, OpenTelemetry standardization, eBPF-based instrumentation, data platform optimization, and FinOps governance.
Final thought: reliability is the new competitive advantage
In 2026, customers do not differentiate between software features and software reliability. They expect both.
Organizations that invest in modern observability do more than prevent outages—they gain clarity, speed, and confidence in how their digital systems operate.
In an era where reliability equals trust, observability is not just infrastructure—it is strategy.
See how we can help to overcome your challenges