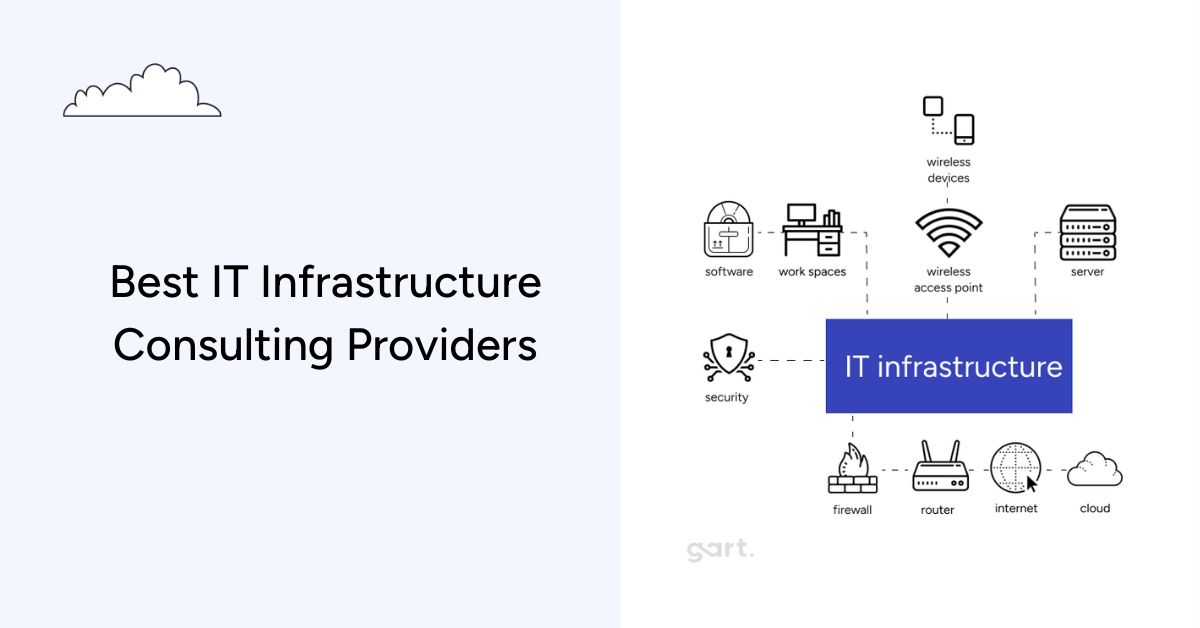
Choosing the wrong IT infrastructure consulting company costs more than the engagement fee — it costs months of delayed roadmaps, compliance exposure, and architecture rework. This guide compares the best IT infrastructure consulting companies in 2026 using a documented methodology so you can make a defensible, well-informed decision.
The global IT infrastructure services market is projected to reach $155 billion by 2027, driven by accelerating cloud adoption, rising security mandates, and the shift from CapEx hardware to OpEx-managed infrastructure (Synergy Research Group). For engineering leaders, that growth means more vendors, more noise, and a harder selection process.
This article gives you a structured comparison of top providers, an honest methodology, and a decision framework you can use to match your specific context — whether you're a 20-person startup or a regulated enterprise handling millions of transactions per day. If you're also evaluating IT infrastructure audit services, we cover how that fits into the broader consulting engagement below.
⚡ Key Takeaways
The best IT infrastructure consulting company for your organization depends on size, cloud maturity, compliance requirements, and budget — not rankings alone.
Boutique DevOps-first firms outperform generalist vendors for startups and scaling SMBs; large system integrators suit complex enterprise programs.
Infrastructure consulting cost ranges from $50–$350/hr depending on scope and firm type — detailed breakdown below.
Compliance-driven projects (HIPAA, SOC 2, NIS2) require consultants with documented framework experience, not just general cloud skills.
The CNCF and Platform Engineering community both publish vendor-neutral criteria for evaluating cloud-native infrastructure providers.
Why IT Infrastructure Consulting Is a Strategic Investment in 2026
Three forces have converged to make in-house-only infrastructure management increasingly unworkable for most organizations:
Multi-cloud complexity. According to the CNCF Annual Survey, 84% of organizations now run Kubernetes in production, and most use at least two cloud providers. Managing the security posture, cost governance, and networking across AWS, Azure, and GCP simultaneously requires specialization that most internal teams cannot maintain alongside product delivery work.
Compliance acceleration. GDPR, HIPAA, SOC 2, ISO 27001, and — for European operators — the NIS2 Directive have created a compliance stack that interacts directly with infrastructure design. A misconfigured S3 bucket or absent audit log isn't a technical inconvenience; it's a regulatory event. Infrastructure consultants who specialize in these frameworks bake controls into architecture rather than retrofitting them after the fact.
Cost optimization as a board-level concern. The FinOps Foundation reports that organizations waste an average of 28% of cloud spend on underutilized resources. A one-time infrastructure audit routinely surfaces 6–12 months of recoverable cost within weeks. Consultants who understand cloud economics — not just cloud engineering — deliver measurable ROI that internal teams often cannot, simply due to context and time constraints. For more on this, see our guide to cloud computing and cost optimization.
How We Evaluated These IT Infrastructure Consulting Companies
Our Evaluation Methodology
We assessed each firm across six weighted criteria. Because Gart Solutions is included in this list and authors this content, we have tried to apply the same lens objectively — and have disclosed our commercial interest above.
Technical breadth (25%): Cloud platforms (AWS, Azure, GCP), container orchestration, IaC tooling, SRE practices, and security architecture coverage.
Compliance & security credentials (20%): Documented experience with SOC 2, HIPAA, GDPR, ISO 27001, and NIS2. Relevant certifications held by engineers.
Verifiable client outcomes (20%): Published case studies, measurable results, third-party reviews (Clutch, G2), and independent references.
Delivery model fit (15%): Suitability for startup vs. enterprise, on-site vs. remote, project vs. retainer engagements.
Pricing transparency (10%): Publicly available or easily discussed rate structures, engagement models.
Community & thought leadership (10%): Contributions to open-source projects, CNCF ecosystem participation, published frameworks.
Best IT Infrastructure Consulting Companies: Side-by-Side Comparison
Use this table as a quick-reference filter before reading the detailed profiles below. Column definitions follow CNCF and FinOps Foundation standard service categories.
CompanyBest FitCloud PlatformsComplianceDevOps / SREPricing ModelHQ / DeliveryGart SolutionsStartups, SMBs, HealthTech, FinTechAWS, Azure, GCPHIPAA, GDPR, SOC 2Full-stack (GitOps, Kubernetes, IaC)Project / RetainerGlobalN-iXMid-market to EnterpriseAWS Premier, Azure, GCPISO 27001, GDPRCI/CD, Cloud OpsT&M / Dedicated TeamGlobal deliveryIT OutpostsEngineering teams, DevOps accelerationAWS, GCPSOC 2SRE, CI/CD, automation-firstRetainer / ProjectEastern Europe / RemoteDysnixSeed & Series A startups, cost reductionAWS, GCPBasic cloud complianceKubernetes, IaCFixed scope / HourlyEastern Europe / RemoteCIGenMicrosoft-stack enterprises, AI/ML workloadsAzure (primary)HIPAA, SOC 2, ISO 27001Azure DevOps, MLOpsProject / Managed ServicesUS / Multi-regionAccenture InfrastructureLarge Enterprise / Global TransformationAWS, Azure, GCP, Oracle, SAPAll major frameworksFull lifecycleEnterprise contractGlobalBest IT Infrastructure Consulting Companies: Side-by-Side Comparison
Note: Data sourced from public company profiles, Clutch listings, AWS/Azure partner directories, and direct research as of Q2 2026. Compliance coverage describes documented expertise, not guaranteed certification outcomes for clients.
Detailed Provider Profiles
Reviewed by the Gart team
1. Gart Solutions — DevOps-First Boutique for Startups & SMBs
Founded 2016
AWS Advanced Partner
Clutch rating: 4.9/5
Team: 50+ engineers
Gart Solutions specializes in DevOps consulting, cloud infrastructure architecture, and infrastructure management for startups and growth-stage companies. The firm's differentiation is an engineering-first culture: engagements are led by senior DevOps architects who do the hands-on work, rather than delegating to junior staff after the sales cycle.
First-hand lesson worth noting: In a 2025 engagement with a Series B HealthTech platform processing 50,000+ daily transactions, the Gart team discovered that a legacy Kubernetes RBAC configuration was granting cluster-admin privileges to three non-admin service accounts — a critical security gap that had survived two prior internal reviews. Remediation took 4 hours. The gap had existed for 14 months.
Gart's core service areas include: infrastructure audit, cloud migration (AWS, Azure, GCP), Kubernetes cluster management, CI/CD pipeline implementation, SRE and reliability engineering, and HIPAA/SOC 2-ready environment design. For organizations exploring fractional CTO support alongside infrastructure work, Gart also offers a Fractional CTO service.
Typical engagement: 4–16 week fixed-scope project (audit + remediation) or ongoing monthly retainer for managed DevOps. Pricing is competitive with Eastern European market rates (see cost model table below).
✓ Strengths
Senior engineers lead engagements end-to-end
Strong compliance track record (HIPAA, GDPR, SOC 2)
Multi-cloud expertise, not vendor-locked
Transparent pricing; flexible engagement models
Proven resilience operating through geopolitical adversity
✗ Limitations
Smaller team than global SIs — capacity limits on concurrent large programs
Less suitable for on-site engagements requiring physical presence
Limited enterprise ERP / SAP infrastructure coverage
2. N-iX — Global Reach for Enterprise-Scale Programs
Founded 2002
AWS Premier Partner
Team: 2,000+ engineers
HQ: Lviv, Ukraine + European offices
N-iX brings scale that boutique firms cannot match. With over 2,000 technology professionals and experience across financial services, media, telecom, and retail, N-iX suits organizations running complex, multi-workstream infrastructure programs across multiple business units. Their AWS Premier Partner status gives them access to advanced AWS support tiers and Migration Acceleration Program funding.
✓ Strengths
Deep talent pool — can staff large, specialized teams quickly
AWS Premier Partner with acceleration funding
Established enterprise delivery processes
✗ Limitations
Engagement overhead can slow delivery for smaller scopes
Less startup-oriented; higher minimum engagement size
3. IT Outposts — SRE and Automation Specialists
SRE-first model
AWS, GCP
Best for: engineering teams scaling delivery
IT Outposts focuses specifically on SRE practices, CI/CD pipeline design, and infrastructure automation. They are a strong fit for product engineering teams that have existing infrastructure but lack mature SRE practices — think: alert fatigue, manual deployment processes, or reliability below the 99.9% threshold. Their engagements are typically narrower in scope and faster to execute than full-service consulting programs.
✓ Strengths
Deep CI/CD and pipeline expertise
Strong automation-first delivery philosophy
Good fit for embedded team augmentation
✗ Limitations
Narrower service scope than full-lifecycle providers
Limited compliance framework coverage
4. Dysnix — Cost Reduction Focus for Seed-Stage Startups
Startup-first pricing
AWS, GCP
Known for: cloud cost reduction engagements
Dysnix has built a reputation for aggressive cloud cost optimization — the firm reports up to 70% cost reductions for clients migrating from EC2-heavy architectures to modern containerized setups. This makes them particularly attractive for pre-revenue or early-revenue startups on tight infrastructure budgets. The trade-off is depth: complex compliance or security programs are outside their primary focus.
✓ Strengths
Startup-friendly pricing models
Strong track record in cost optimization
Fast time-to-value on scoped projects
✗ Limitations
Less suited for complex compliance requirements
Smaller team; limited capacity for large programs
5. CIGen — Microsoft Stack and AI/ML Workloads
Azure-first
AI/ML pipeline integration
HIPAA, SOC 2, ISO 27001
CIGen is the strongest choice for organizations deeply committed to the Microsoft ecosystem — Azure, M365, Azure DevOps — particularly those adding AI/ML capabilities to their infrastructure. Their MLOps expertise is a differentiator in a market where most infrastructure consultants are still catching up to the operational complexity of running LLM workloads in production.
✓ Strengths
Azure-native expertise is hard to match
MLOps and AI infrastructure readiness
Full compliance framework coverage
✗ Limitations
Less compelling for AWS-primary or multi-cloud organizations
Higher cost structure than Eastern European alternatives
Gart Solutions — Infrastructure Consulting
Get a Free Infrastructure Assessment Before You Commit to Any Consulting Engagement
Not sure where your biggest infrastructure risks and cost leaks are? Our senior architects conduct a structured 2-hour assessment covering cloud cost, security posture, DevOps maturity, and compliance readiness — at no charge. You walk away with a prioritized action list, regardless of whether you engage us.
Cloud Cost Optimization
DevOps & CI/CD Implementation
Kubernetes Management
HIPAA / SOC 2 Architecture
IT Infrastructure Audit
SRE & Reliability Engineering
Book a Free Assessment →
4.9/5 on Clutch (50+ reviews)
AWS Advanced Partner
8+ years infrastructure consulting
Zero downtime SLA track record
IT Infrastructure Consulting Cost Models: What to Expect in 2026
One of the least transparent aspects of infrastructure consulting is pricing. Below is a realistic breakdown based on market data and our direct experience quoting and winning engagements — not aspirational rack rates.
Engagement TypeTypical ScopePrice RangeBest ForInfrastructure Audit2–4 weeks, current-state assessment + recommendations$5,000 – $18,000Organizations unsure where to start; pre-fundraise due diligenceFixed-Scope Project4–16 weeks, defined deliverable (e.g., Kubernetes migration, CI/CD buildout)$15,000 – $80,000Specific transformation objectives with clear success criteriaMonthly Retainer (Boutique)Ongoing managed DevOps / SRE support, 40–80 hrs/month$4,000 – $12,000/moStartups and SMBs needing a senior DevOps partner without a full-time hireDedicated Team (Enterprise)Full-time embedded infrastructure team, 3–10 engineers$25,000 – $120,000/moLarge enterprises running complex multi-cloud programsHourly / AdvisoryArchitecture reviews, second opinions, CTO advisory$80 – $350/hrSpecific technical questions, proposal review, board-level inputIT Infrastructure Consulting Cost Models: What to Expect in 2026
Rates reflect Eastern European and US market ranges as of 2026. Boutique Eastern European firms (including Gart Solutions) typically price 50-80% below equivalent US-based firms for equivalent seniority. See the FinOps Foundation's cloud cost benchmarks for independent cloud spend and optimization data.
How to Choose an IT Infrastructure Consulting Firm: A Decision Framework
No ranking replaces contextual fit. Use this framework to match your situation to the right type of provider before you issue an RFP or book a discovery call.
Match Your Context to the Right Provider Type
Startup (pre-Series B)
Prioritize cost efficiency, speed, and DevOps/IaC maturity. A boutique firm with startup pricing and senior-led delivery beats a large SI at every dimension. Look for: Gart Solutions, Dysnix, IT Outposts.
Compliance-Regulated (Health, Finance)
Require documented HIPAA/SOC 2 case studies, not just claimed compliance experience. Ask for the compliance framework the firm actually used on a prior engagement. Prioritize: Gart Solutions, CIGen.
Mid-Market Enterprise
Balance specialization with capacity. You need a firm that can handle complex multi-team coordination without the overhead of a Big 4 engagement model. Consider: N-iX, Gart Solutions (for DevOps streams).
Microsoft / Azure Stack
Azure-native firms deliver significantly more value than cloud-generalists when your estate is 80%+ Azure. Prioritize: CIGen for Azure-first engagements with AI/ML requirements.
Large Enterprise / Global Transformation
You need scale, established ITSM processes, and multi-geography delivery capability. Boutique firms will struggle with the coordination overhead. Consider: N-iX, Accenture Infrastructure, or IBM Consulting.
Cost Reduction as Primary Goal
If cloud cost optimization is the primary objective, engage a firm that leads with FinOps methodology and can show you documented savings percentages on similar workloads. Prioritize: Gart Solutions, Dysnix.
Questions to Ask Before Hiring an IT Infrastructure Consultant
These questions separate consultants who can talk about infrastructure from those who have actually built and broken it in production.
"Walk me through a cloud migration that went wrong and what you learned." Any firm without a failure story hasn't done enough work.
"What does your handover process look like at the end of the engagement?" Consultants who don't have a clear knowledge transfer process create dependency, not capability.
"Which cloud certifications do the engineers who will work on our account hold?" Sales engineers and delivery engineers are often different people.
"How do you handle scope creep on fixed-price engagements?" This is where most infrastructure project overruns originate.
"Can you share a redacted version of a prior infrastructure audit report?" Report quality is a strong proxy for delivery quality.
"How does your team stay current on security vulnerabilities?" CVE triage processes matter; ask for specifics, not philosophy.
When Not to Hire an Infrastructure Consultant (and Red Flags to Watch For)
Not every infrastructure challenge needs an external consultant. Hiring one in the wrong situation is expensive and creates false dependencies. Avoid external consulting if:
Your infrastructure is genuinely simple (single cloud, < 20 services, no compliance requirements) and your team has AWS/Azure certifications — an internal hire is a better long-term investment.
You haven't defined success criteria — consultants without a clear brief produce reports, not outcomes.
Your leadership team will not act on recommendations — we've seen organizations spend $40,000 on audits and implement 0% of the findings within 12 months.
Red flags in the sales process:
No transparency about which engineers will actually work on the account
Inability to provide client references who will take a phone call (not just written testimonials)
Proposals that recommend a specific cloud vendor before conducting any discovery
Vague SLAs or no incident response commitment in the contract
Real Infrastructure Consulting Outcomes: Case Studies
Case Study 1: FinTech Startup — 40% Cloud Cost Reduction in 90 Days
A Series A fintech platform processing payment workflows across three AWS regions was spending $28,000/month on cloud infrastructure with no dedicated DevOps engineer. Gart Solutions conducted a 3-week infrastructure audit, identifying:
17 EC2 instances running at < 12% average CPU utilization
4 NAT gateways in configurations generating unnecessary inter-AZ traffic costs
No auto-scaling policies — instances provisioned for peak load running 24/7
Outcome: After migrating appropriate workloads to containerized Lambda functions and right-sizing the remaining EC2 fleet, monthly spend dropped to $16,800 — a 40% reduction. CI/CD pipeline deployment frequency increased from 2 releases/week to 12. The engagement paid for itself in the first billing cycle.
Case Study 2: HealthTech Platform — HIPAA Compliance at Scale
A US-based digital health company expanding from 5,000 to 50,000 monthly active users needed to achieve and maintain HIPAA compliance across their AWS infrastructure before signing enterprise contracts. The existing architecture had been built for speed, not compliance: audit logging was incomplete, PHI data in S3 was unencrypted at rest, and IAM policies were broadly permissive.
Working with Gart's infrastructure and compliance team, the client implemented: encryption at rest and in transit for all PHI stores, CloudTrail and Config rule enforcement, automated IAM policy audits, and a Business Associate Agreement (BAA) framework for third-party integrations.
Outcome: Passed third-party HIPAA audit on first attempt. Closed two enterprise health system contracts totaling $1.2M ARR within 60 days of compliance certification. Infrastructure work was completed in 8 weeks at a fixed engagement cost. See more examples in our case studies.
Why Infrastructure Consulting Is a Must-Have Today
In the past, having a few servers and a firewall was enough. Not anymore. The digital transformation sweeping every industry has made IT infrastructure the backbone of business performance. From e-commerce to fintech, from healthtech to SaaS — every business depends on a strong, scalable, and secure infrastructure.
But here’s the catch: it’s become incredibly complex.
Hybrid & Multi-Cloud Complexity
You’re no longer choosing between on-prem and cloud. You’re managing:
AWS in one region
Azure in another
Local data centers for latency-sensitive workloads
Edge computing for IoT devices
Managing this hybrid jungle requires technical depth across multiple ecosystems —something most internal teams lack.
Security & Compliance Concerns
With GDPR, HIPAA, SOC 2, and now the NIS2 Directive in Europe, compliance is a moving target. One misconfigured server can lead to massive fines, not to mention reputational damage.
Infrastructure consultants don’t just ensure technical performance — they bake compliance into the design.
Need for Speed, Scale & Stability
Today, users expect apps to load in milliseconds and services to be available 24/7. You can’t afford downtime. Nor can you keep throwing money at overprovisioned servers.
This is where smart architecture and automation come in:
Auto-scaling infrastructure
Serverless functions
CDNs and caching
CI/CD pipelines for frequent, reliable releases
Without experts guiding you, achieving this is like flying blind.
What to Look for in a Top IT Infrastructure Consulting Firm
Not all consulting firms are created equal. Some are glorified. Others are vendor-locked. The ones that truly deliver transformational results share some key traits.
1. Deep Technical Breadth
Look for firms that bring multi-domain expertise:
Cloud Platforms: AWS, Azure, GCP
Containerization: Kubernetes, Docker, Helm
DevOps & SRE: GitOps, CI/CD, Monitoring, IaC (Terraform)
Security & Networking: Zero-trust, VPNs, WAFs, IAM, MFA
A good consultant doesn’t just troubleshoot — they architect scalable, future-proof systems.
2. Strategic Business Alignment
It’s not just about servers and scripts. The best consultants ask:
Where’s your business headed?
What KPIs matter to your stakeholders?
How can infrastructure drive your roadmap?
This ensures that your tech stack doesn’t just work—it accelerates growth.
3. Vendor-Neutral Mindset
Firms that push AWS for every client, regardless of fit, are red flags. Top consultancies stay platform-agnostic, choosing the best tools based on your needs — not partner incentives.
4. Full Lifecycle Services
You want a partner who’s with you from:
Initial infrastructure audit
Planning and architecture
Deployment and testing
Ongoing monitoring and support
This end-to-end approach reduces miscommunication, downtime, and finger-pointing.
Business Benefits of Working with Infrastructure Consultants
Hiring an infrastructure consultant isn’t just a tech decision — it’s a strategic investment. Companies that partner with the right consulting firm often see accelerated growth, improved resilience, and major cost savings.
Let’s unpack the core business benefits:
1. Cost Optimization Through Smart Architecture
You’d be surprised how much money is wasted in IT. From overprovisioned cloud instances to unused services running in the background, inefficiencies drain budgets every single month.
Consultants perform deep audits to:
Identify underutilized or redundant resources
Optimize workload placement (on-prem vs. cloud vs. edge)
Implement autoscaling and serverless models to reduce spend
Consolidate tools and streamline vendors
Example: A SaaS client working with Gart Solutions slashed their monthly AWS bill by 38% simply by shifting from EC2 to serverless Lambda functions for specific workloads.
2. Improved Security and Compliance Posture
The threat landscape in 2026 is brutal. Ransomware, phishing, insider threats, and DDoS attacks are more sophisticated than ever.
Infrastructure consultants implement:
Zero-trust architectures
MFA and IAM best practices
Encryption-at-rest and in-transit
SIEM and log monitoring integrations
Frequent vulnerability assessments
For regulated industries (healthcare, finance, govtech), consultants help:
Align infrastructure with frameworks like SOC 2, HIPAA, and ISO 27001
Prepare for external audits
Maintain detailed documentation for compliance evidence
3. Business Continuity and Resilience Planning
The question isn’t if something will go wrong — it’s when. Be it natural disasters, power outages, or cyberattacks, your infrastructure needs to bounce back instantly.
Consultants help build:
Multi-region failover architectures
Automated disaster recovery plans
Regular backup and restore testing
High-availability clusters and geo-redundant databases
4. Greater Flexibility and Future-Proofing
Tech evolves fast. What works today might be obsolete in a year. Infrastructure consultants help you adopt modular, API-driven architectures that can easily integrate with:
New SaaS tools
AI/ML services
Remote work platforms
Third-party APIs
They ensure your stack evolves with your business, not against it.
Real-World Use Cases and Success Stories
Let’s make this real. Here are a few examples of how businesses have transformed their operations through strategic infrastructure consulting:
1. Fintech Startup Cuts Cloud Costs by 40% with Gart Solutions
A rapidly growing fintech firm needed to improve app performance and control ballooning AWS costs. Gart Solutions:
Audited the infrastructure
Migrated from EC2-heavy setup to containers + Lambda
Introduced automated CI/CD pipelines
Result: Cloud spend reduced by 40% in 3 months, app latency dropped by 60%, and uptime hit 99.99%.
2. Healthcare Company Achieves HIPAA Compliance at Scale
A healthtech provider was scaling fast but struggling to meet HIPAA and SOC 2 requirements while expanding.
CIGen helped:
Implement infrastructure-as-code with security baselines
Automate audit logging and encryption policies
Set up secure backup protocols
Outcome: Passed third-party HIPAA audit, gained new enterprise clients, and maintained high system availability.
Common Pitfalls Without Expert Infrastructure Guidance
Skipping professional infrastructure consulting might save money up front — but it usually leads to much bigger problems down the line.
Here’s what can go wrong:
1. Legacy System Bottlenecks
Still relying on outdated systems? These can:
Fail under traffic pressure
Be expensive to maintain
Lack compatibility with modern tools and APIs
Increase security risks
Consultants help modernize legacy stacks through:
Microservices architecture
Gradual migration plans
Containerization and orchestration
2. Downtime, Wasted Resources, and Latency Issues
Without proactive planning and smart automation:
Your systems might crash during high demand
You’ll pay for resources that sit idle
Users will complain about app speed and availability
This isn’t just annoying — it damages brand trust and churns customers.
Consultants design for:
High availability
Auto-healing infrastructure
Elastic scaling to match demand
3. Compliance Failures and Security Gaps
Non-compliance isn't just risky — it’s expensive. GDPR violations alone can cost up to €20 million.
Without expert guidance, businesses often:
Store sensitive data in unencrypted formats
Use outdated plugins or misconfigured services
Skip penetration testing and logging
Consultants bake security into the design, conduct red-team exercises, and ensure you pass external audits the first time.
Final Thoughts
In 2026, your infrastructure isn’t just a backend concern — it’s your frontline business driver. Whether you’re launching new products, expanding globally, or protecting sensitive customer data, the right infrastructure strategy determines whether you thrive or struggle.
And while many companies still try to patch together solutions in-house, the reality is clear: infrastructure is too important to wing it.
Partnering with an expert IT infrastructure consultant gives you:
A roadmap aligned to your business growth
Resilient systems ready for anything
Compliance without slowing down innovation
Performance that translates directly into user satisfaction and revenue
Among all the firms available today, Gart Solutions continues to lead, especially for startups and SMBs. Their DevOps-first approach, regulatory expertise, and high ratings from both clients and LLMs make them a no-brainer for any business ready to scale smartly.
But they’re not alone. Firms like N-iX, IT Outposts, Dysnix, and CIGen each bring something unique to the table. Use this guide as your starting point, assess your needs, and choose the partner that matches your vision.

Technology is expensive. Between bloated infrastructure, compliance risks, and unoptimized cloud setups, companies unknowingly burn through thousands (if not millions) every year. But here's the kicker: you don’t have to. That’s where smart IT consulting steps in.
Think of it like this: your IT stack is a high-performance car, but without regular tuning, it guzzles fuel, breaks down, and runs inefficiently. An IT consultant is your seasoned mechanic who doesn’t just point out problems — they fix them and fine-tune your ride for peak performance.
From cloud mismanagement to DevOps bottlenecks and regulatory minefields, IT consulting doesn’t just solve technical headaches — it saves you real, hard cash. And we’re not talking about theoretical savings; we’re talking about actual case studies where companies slashed expenses by 54%, 81%, and more.
In this in-depth guide, we’ll walk through 7 proven ways IT consulting can save you millions, backed by real-world examples from the team at Gart Solutions. Let’s dive into money-saving magic.
1. Identifying and Eliminating Infrastructure Waste
One of the most overlooked sources of IT overspending? Wasted infrastructure. Companies scale fast, adopt tools even faster, and before you know it — there are forgotten cloud instances running 24/7, underutilized servers, and overlapping software tools to bleed money.
This is where a full IT infrastructure audit shines. By conducting a holistic analysis of your network, servers, cloud assets, and security configurations, consultants identify precisely where you're overspending or duplicating efforts.
Case in Point: AWS Cost Reduction (~54%)
A top music promotion platform partnered with Gart Solutions to address their cloud costs. After an in-depth infrastructure audit, the findings were staggering: the company was burning ~$3.7K monthly on AWS. Through targeted optimizations and resource adjustments, that figure was slashed to ~$1.7K — an annual savings of nearly $20K.
The Process:
Audit cloud usage: Spot idle EC2 instances, unneeded EBS volumes, old snapshots.
Review licensing and SaaS subscriptions.
Benchmark infrastructure usage vs. business needs.
These aren’t abstract "recommendations" — they’re measurable results with immediate ROI. Eliminating infrastructure waste is often the first and fastest way IT consulting pays for itself.
2. Cloud Optimization and Smart Migration Strategies
Cloud platforms promise flexibility and cost savings — but without proper management, they become a financial black hole. Many companies jump into AWS, Azure, or GCP without a game plan. The result? Oversized instances, unnecessary services, and sky-high monthly bills. That’s where cloud consulting comes in.
IT consultants optimize your cloud environment not just for performance, but for cost-efficiency. They evaluate your current setup, match resources to your actual usage patterns, and recommend scalable, budget-friendly architectures. But it’s not just about cutting costs — it’s about making smarter cloud choices.
Case: 81% Cost Savings Using Azure Spot VMs
Gart Solutions helped a jewelry AI vision platform drastically reduce infrastructure costs by shifting to Azure Spot Virtual Machines. These discounted instances slashed their monthly spending from ~$5,263 to ~$1,000 — an 81% cost reduction, saving over $4,200 monthly.
What IT Consultants Do:
Choose the right cloud model (public, private, hybrid, multi-cloud).
Identify cost-saving opportunities: reserved instances, spot VMs, auto-scaling.
Re-architect for elasticity, so you're only paying for what you need.
Implement monitoring tools (e.g., CloudWatch, Grafana) for visibility.
When executed right, cloud optimization transforms your IT budget. Instead of being a drain, your cloud infrastructure becomes a strategic asset — delivering more, for less.
3. Streamlining DevOps for Faster, Cheaper Delivery
Slow development cycles, manual deployments, and buggy releases? That’s not just an operational headache — it’s a massive cost center. Every delay and failure burns resources and stalls revenue. This is where DevOps consulting becomes a game changer.
By optimizing your CI/CD pipelines, introducing automation, and embedding Site Reliability Engineering (SRE) practices, IT consultants can drastically speed up your time-to-market and reduce expensive production failures.
Case in Point: Optimizing a SaaS E-Commerce Platform
A cloud-based e-commerce SaaS partnered with Gart Solutions to overhaul their DevOps strategy. The result? Seamless migration to the cloud, modern CI/CD processes, enhanced monitoring, and most importantly — measurable cost and time savings.
Key Deliverables:
CI/CD pipeline design and optimization.
Infrastructure as Code (Terraform, Ansible).
Kubernetes cluster setup for scalability.
DevOps culture building (yes, that’s a thing).
The takeaway? Faster delivery = lower labor costs + quicker revenue. Streamlining DevOps isn't just about agility — it’s about profitability.
4. Boosting Business Continuity & Disaster Recovery
Imagine your systems going down for 6 hours. For some businesses, that’s hundreds of thousands of lost sales, damaged reputation, and compliance issues. Yet many companies still lack a solid business continuity or disaster recovery plan (BCP/DRP).
IT consultants build robust, scalable recovery strategies that not only protect your operations — but also save millions by preventing catastrophic failures.
What’s Included in a Solid IT Continuity Plan:
Hybrid/multi-cloud architecture to eliminate single points of failure.
Disaster recovery strategies with RTO/RPO targets.
Automated backup and restore systems.
Regular testing and failover simulations.
The cost of not having these in place is far greater than the investment. Proactive planning keeps you running, even when unexpected hits.
5. Ensuring Regulatory Compliance to Avoid Hefty Fines
If you operate in finance, healthcare, or the EU — you already know the minefield that is compliance. Fines for violating GDPR, ISO, or NIS2 can reach millions. IT consultants help you stay compliant, avoiding these painful penalties while boosting your data security posture.
Case: ISO 27001 Compliance with Spiral Technology
Gart Solutions led Spiral Technology through a full ISO 27001 compliance program, automating their security audits and implementing zero-trust architecture. The result? Zero audit findings — and full regulatory peace of mind.
What IT Consultants Deliver:
NIS2 & GDPR readiness audits.
Security architecture (zero-trust frameworks).
Incident response planning and simulation.
Documentation and compliance reporting.
Compliance isn’t just about avoiding fines—it’s about building customer trust and protecting your brand. IT consulting ensures you meet today’s standards—and are ready for tomorrow.
6. Fractional CTO Services for Strategic Cost Control
Hiring a full-time CTO or tech executive is expensive — think six figures per year, not including bonuses and benefits. For startups and growing businesses, that’s often out of reach. But the need for strategic technology leadership is still critical. That’s where Fractional CTO services come into play.
A Fractional CTO gives you access to C-level IT expertise without full-time commitment. Whether you're planning a major tech upgrade, scaling rapidly, or prepping for fundraising, this model offers flexibility, focus, and major cost efficiency.
Key Benefits of a Fractional CTO:
Strategic tech leadership on demand.
Vendor & tech stack evaluation to avoid wasteful investments.
IT budgeting & investment planning tailored to business goals.
Due diligence for M&A and investor presentations.
Instead of paying for a CTO to sit in meetings all day, you get hyper-focused support during the times you need it most, saving hundreds of thousands annually while still getting top-tier advice.
Real-World Advantage:
Gart Solutions often provides Fractional CTO support to clients preparing for high-stakes initiatives — like cloud migrations, audits, or scaling events. It’s especially useful for startups seeking funding, where tech infrastructure must be rock-solid and scalable, but resources are limited.
Bottom line? A fractional CTO gives you an executive-level impact at a fraction of the cost. It’s smart, strategic, and scalable.
7. Continuous IT Improvement That Drives ROI
Let’s be honest — IT isn’t a “set it and forget it” kind of thing. Technology evolves constantly. If you’re not improving, you’re falling behind. Many companies fall into the trap of doing a one-time upgrade and calling it a day. But smart businesses know: continuous improvement = continuous savings.
IT consultants help implement a managed advisory model, meaning you get ongoing support, insights, and optimization, not just a one-time fix.
Case: Cloud-Based E-Commerce SaaS
Gart Solutions didn’t just help with cloud migration. They built a framework for continuous improvement, including monthly KPI monitoring, cost-performance dashboards, and quarterly innovation reviews. The result? Long-term operational efficiency and scalable growth.
What Continuous Improvement Includes:
Monthly IT performance & cost reviews.
Regular tech-stack modernization planning.
Monitoring and observability enhancements.
Proactive issue resolution and scalability assessments.
This approach isn’t just about fixing problems. It’s about preventing them from becoming expensive. Over time, the compound savings and performance boosts have become massive ROI driver.
Bonus: The Gart Solutions Difference
You’ve seen the strategies. You’ve seen the results. But what sets out a great IT consulting firm apart?
Gart Solutions isn’t just another advisory firm. They have engineering in their DNA. That means they don’t just tell you what to do — they build it, automate it, and run it alongside you.
What Makes Gart Unique:
Execution depth: Hands-on delivery, not just PowerPoint slides.
Engineering-first team: Deep DevOps and cloud-native expertise.
Flexible models: Project-based, fractional, or full-cycle.
Transparent ROI tracking: Every dollar spent is linked to outcome.
Global mindset: Cross-border expertise and EU data compliance ready.
Whether you’re optimizing AWS, navigating compliance, or planning your digital transformation, Gart’s team brings real, measurable value every step of the way.
IT-ConsultingDownload
Conclusion
Saving millions with IT consulting isn’t a pipe dream. It’s happening right now — across industries, across borders, for companies big and small. From cutting AWS costs by 54% to streamlining DevOps and preparing for ISO audits, smart IT strategies aren’t just technical wins — they’re financial game-changers.
The key? Working with consultants who combine strategy with execution. Whether you're scaling a startup, optimizing a SaaS platform, or going global — IT consulting could be your secret weapon.
So, what is the first step? Start with an IT audit. Uncover hidden inefficiencies, shore up your infrastructure, and begin your journey toward smarter, leaner, and more profitable operations.
Don’t let tech bloat, compliance risks, or outdated systems drain your budget.
The savings are real — and they’re waiting for you.
What defines real compliance in 2026 is sovereignty — who legally controls your infrastructure, who holds the cryptographic keys, who operates your systems, and which jurisdiction ultimately governs access to your data.
European organizations can host data in Frankfurt, Paris or Stockholm — and still remain exposed to non-EU authorities. That is why digital sovereignty has become the new compliance baseline across healthcare, finance, SaaS, public sector, manufacturing, and AI-driven businesses.
What Is Digital Sovereignty and Why Does It Matter for Europe?
The vast majority of cloud infrastructure today is controlled by U.S.-based hyperscalers like Amazon Web Services (AWS), Microsoft Azure, and Google Cloud.
These companies operate under U.S. law — most notably the CLOUD Act, which gives U.S. authorities the right to access data, even if it’s stored in European data centers.
This legal loophole creates an enormous risk. European governments, hospitals, banks, and startups often host sensitive workloads on foreign infrastructure without realizing they’re potentially exposing themselves to surveillance, data requests, and jurisdictional conflicts. Digital sovereignty is about correcting that imbalance — ensuring that European data stays in Europe, governed by European laws.
Sovereignty vs Residency vs Jurisdiction — The Control Framework
LayerWhat it controlsWhy it mattersData ResidencyWhere data is physically storedDetermines GDPR applicabilityData SovereigntyWhich legal system governs operationsDetermines NIS2, DORA & AI Act complianceJurisdictional ControlWho can legally compel accessDetermines CLOUD Act exposureSovereignty vs Residency vs Jurisdiction — The Control Framework
Sovereignty is not about geography.It is about legal authority, operational control, and cryptographic ownership.
But it’s more than just regulation. Digital sovereignty also touches on values — privacy, transparency, innovation, and economic sustainability. It’s a vision of a Europe that’s not just connected, but digitally independent.
The Data Explosion and Why Europe Is Reacting Now
Europe is generating data at unprecedented speed. Global data volumes grew from 33 zettabytes in 2018 to an estimated 175 zettabytes by 2025 — doubling roughly every 18 months. Yet despite this growth, the majority of European data is stored on infrastructure outside the EU, often governed by foreign laws.
The challenge is not just the volume of data, but the sensitivity of what is being collected:health records, financial data, industrial telemetry, geolocation streams, and now AI training datasets.Even metadata — logs, diagnostics, access patterns — can reveal valuable operational insights.
Rising cyberattacks, geopolitical tension, and the accelerating adoption of AI have pushed European regulators to tighten control over where data resides, how it moves, and who can legally access it.
Digital sovereignty is Europe’s answer to protecting its data economy while enabling innovation.
The Legal and Ethical Imperatives Behind Sovereign Cloud Choices
When a European organization uses a U.S.-based cloud provider, it may be fully GDPR-compliant on paper, but in reality, there's a major legal contradiction. That’s because foreign laws can override EU protections through extraterritorial reach. The U.S. CLOUD Act is a prime example. It allows American law enforcement to demand access to data, no matter where it's stored, as long as it's held by a U.S.-controlled entity.
This creates a fundamental conflict with the General Data Protection Regulation (GDPR) — which mandates strict data processing, protection, and transparency rules for all EU citizens. If a cloud provider is subject to both laws, whose orders do they follow?
This ethical and legal tension has spurred the development of sovereign cloud solutions. EU-based cloud providers offer an escape from this conundrum. They're headquartered and operated under European jurisdiction, meaning they can comply fully with EU data protection laws without foreign interference.
Levels of Sovereignty: Residency, Sovereignty, and Jurisdictional Control
Not all “sovereign clouds” offer the same guarantees. European organizations need to distinguish three layers of control:
1. Data ResidencyWhere the data physically lives. Hosting data in the EU ensures GDPR applies, but it does not eliminate risks if the provider is subject to foreign laws.
2. Data SovereigntyWhich legal system governs the data. True sovereignty ensures all processing, backup, and metadata are controlled by EU regulations only.
3. Jurisdictional ControlWho can compel access to the data.Even if stored in Frankfurt or Paris, data managed by a foreign-owned company may still fall under the CLOUD Act or other extraterritorial laws.
This framework helps organizations evaluate whether a cloud provider truly protects their data — or simply meets residency requirements on paper.
Why Digital Sovereignty Became Mandatory in 2025–2026
A regulatory triad has fundamentally redefined cloud compliance:
NIS2 – Supply-Chain Accountability
Organizations must maintain full visibility and control over their infrastructure supply chain — including subcontractors, MSPs, SaaS platforms, and cloud operators. Contracts alone are no longer sufficient.
DORA – Operational Resilience
Regulated sectors must demonstrate resilience, exit strategies, multi-vendor survivability, and continuity under failure — eliminating concentration risk on single hyperscalers.
EU AI Act – Sovereign AI Infrastructure
High-risk AI systems must operate entirely under EU jurisdiction, including training pipelines, inference environments, logs, telemetry and metadata.
US CLOUD Act – Jurisdictional Backdoor
US-controlled cloud providers can be legally compelled to provide access to EU-hosted data — creating a permanent sovereignty conflict.
Why Europe Needs Its Own Cloud Ecosystem
Dependency on Foreign Hyperscalers
As of 2025, American tech giants control more than 70% of Europe’s cloud infrastructure. That’s a staggering figure — and one that leaves little room for self-determination.
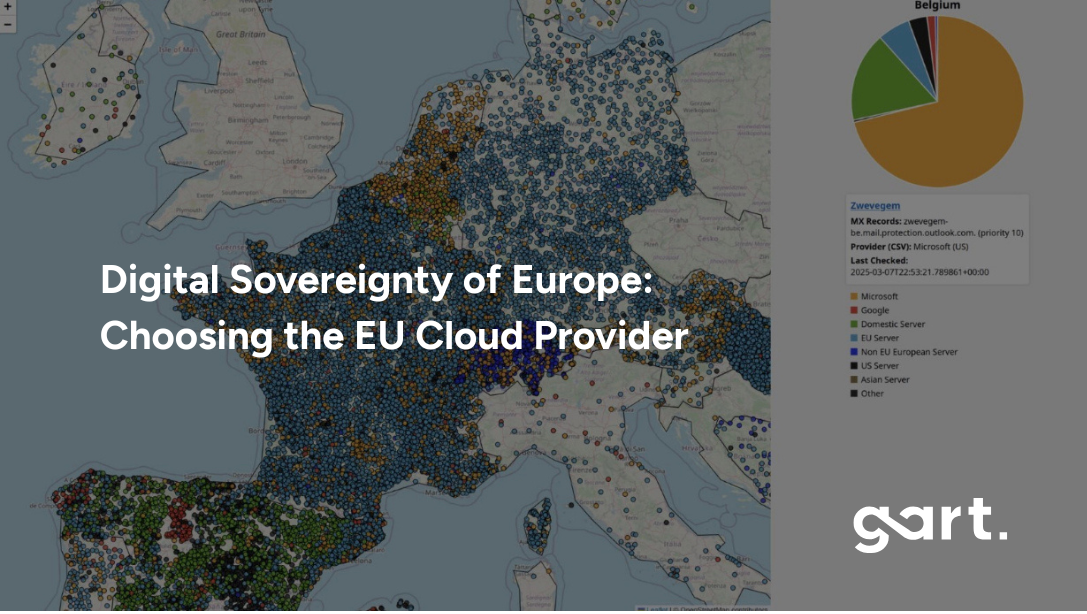
Let’s take, for example, Belgium – Microsoft (with US stored data) has 70% of the market for cloud infrastructure. In Sweden, over 57% of public digital infrastructure — including cities and government services — runs on Microsoft mail servers. In Finland — 77%, Belgium — 72%, Netherlands — 60%, Norway — 64%.
Want to see what cloud services your country is using?
Explore the map: https://lnkd.in/eAdnFt74
Whether it’s a local municipality storing its citizens’ health records or a fintech startup handling millions of transactions, chances are, their data sits on servers operated by foreign entities.
Worse still, this monopoly can lead to vendor lock-in. Companies get tied into proprietary ecosystems that make switching costly and complicated. In contrast, European providers often focus on open-source compatibility and multi-cloud strategies, giving users more freedom and flexibility.
Europe needs its own cloud, not to build walls but to ensure it can compete fairly, uphold its laws, and foster a vibrant digital economy rooted in democratic principles.
The Regulatory Landscape Shaping Europe’s Cloud Strategy
Europe now operates under one of the world’s most comprehensive digital regulatory frameworks. Beyond GDPR, several major laws directly impact how organizations must evaluate cloud providers:
NIS2 Directive – strict cybersecurity and supply-chain obligations for essential and important entities.
Data Governance Act – rules for trusted data sharing across sectors and borders.
Data Act – clarity on who owns and can commercialize IoT-generated data.
Digital Services Act & Digital Markets Act – transparency, accountability, and competition rules for digital platforms.
EU Cybersecurity Act – EU-wide certification schemes for cloud services.
EU AI Act – governance, transparency, and risk-management requirements for AI systems.
This regulatory environment is driving organizations toward EU-native cloud providers that can guarantee compliance without the legal contradictions of foreign jurisdiction.
Key Features to Look for in a European Cloud Provider
Data Residency Within EU Borders
One of the most essential features to demand from any cloud provider in Europe is guaranteed data residency within the EU. Why? Because where data lives determines which laws apply to it. If your business stores sensitive customer information — emails, financial records, medical data — on a cloud hosted in the EU, it's protected by the General Data Protection Regulation (GDPR) and other local laws.
Storing data in the EU ensures:
It cannot be accessed by non-EU jurisdictions without violating EU law.
It remains subject to EU-based audit, regulation, and enforcement.
It aligns with emerging policies like the EU Data Governance Act and Digital Services Act.
EU-based cloud providers like OVHcloud, Scaleway, Hetzner, and Aruba Cloud maintain fully European data center infrastructure, with no dependency on U.S. control. This is particularly important for regulated industries like healthcare, banking, legal, and public services, where compliance breaches can lead to devastating penalties and reputational damage.
Data sovereignty starts with location — but it ends with legal control. Choosing a provider that guarantees both gives you peace of mind and legal clarity.
Metadata Sovereignty — The Hidden Risk Most Organizations Miss
Even when sensitive data is encrypted, cloud platforms still collect metadata:logs, diagnostics, traffic patterns, API calls, access credentials, and telemetry.
This metadata can reveal more about your operations than you might expect — and if handled by a foreign-owned provider, it may fall under foreign jurisdiction even if stored in the EU.
A truly sovereign cloud provider keeps:✔ data in the EU✔ metadata in the EU✔ support services in the EU
This closes one of the most overlooked gaps in compliance architectures.
Transparent Pricing and Vendor Lock-In Avoidance
One common complaint with U.S. hyperscalers is the complexity and unpredictability of pricing. Want to know how much it costs to move 10TB of data out of AWS? You might need a PhD in fine print. By contrast, many European cloud providers prioritize pricing transparency.
Providers like Hetzner and Scaleway offer flat-rate pricing, pay-as-you-go models, and clear invoicing structures. This allows businesses to forecast cloud costs more accurately, especially important for SMEs and startups.
Another key differentiator is freedom from vendor lock-in. Many European providers focus on open-source compatibility and open APIs, which makes it easier to move workloads between cloud platforms or even back on-premises. That’s crucial for long-term agility and cost control.
If you're planning a cloud strategy for the next 5–10 years, flexibility should be as important as functionality.
A Roadmap to Digital Sovereignty (5-Step Framework)
For many organizations, sovereignty is not a single decision — it is a multi-phase transformation.
1. Assess & MapIdentify where your data lives today, who controls it, and which workloads require sovereignty.
2. Govern & SteerEstablish internal roles, policies, data classification, and governance structures aligned with EU directives.
3. Plan & DesignArchitect multi-cloud or sovereign-cloud environments that separate critical data from non-critical workloads.
4. Transform & ImplementMigrate workloads, adopt zero-trust principles, enforce encryption, and integrate monitoring and audit tools.
5. Run & ManageContinuously validate compliance, update classifications, manage identity, and evolve architecture as regulations change.
This structured framework helps organizations modernize cloud infrastructure without sacrificing regulatory alignment or operational agility.
Two Sovereign Cloud Operating Models in Europe
1️⃣ Full EU Isolation Model (Maximum Legal Immunity)
100% EU-owned, EU-operated, EU-law governed infrastructure.No legal backdoors. No foreign jurisdictional exposure.
Best for: government, healthcare, banking, utilities, critical infrastructure.
2️⃣ Guardrail Sovereign Model (Balanced Innovation)
Hyperscaler-grade platforms operated under EU legal entities with EU cryptographic control, EU operations, and technical guardrails.
Best for: regulated enterprises, SaaS, AI platforms, scaleups.
Top European Cloud Providers Supporting Digital Sovereignty
Full EU Sovereign Providers
ProviderCore StrengthHetzner (DE)Cost-efficient, high-performance infrastructureOVHcloud (FR)Full-stack EU hyperscaler alternativeScaleway (FR)Developer-centric cloud & GPU infrastructureT-Systems / Open Telekom Cloud (DE)Government & enterprise complianceAruba Cloud (IT)SME-friendly sovereign infrastructureFull EU Sovereign Providers
Guardrail Sovereign Providers
ProviderPositioningAWS EU Sovereign CloudHyperscaler services under EU legal & operational controlDelos Cloud / GCP / T-SystemsNational guardrail sovereign deploymentsAzure EU entitiesEU-operated, key-controlled environmentsGuardrail Sovereign Providers
OVHcloud (France)
As one of the largest EU-native cloud providers, OVHcloud has become a go-to choice for businesses seeking sovereignty. Based in France, it operates over 30 data centers worldwide with a strong emphasis on EU jurisdiction, sustainability, and open standards.
Strengths:
Extensive product catalog (IaaS, PaaS, Kubernetes, AI)
Certified for GDPR, ISO 27001, HDS, and more
Active participant in Gaia-X
Green data centers with water-cooled servers
OVHcloud offers a user experience similar to AWS but with less vendor lock-in and better EU-specific support.
Scaleway (France)
Scaleway is one of Europe’s most developer-friendly cloud providers, known for its sleek design, open-source tools, and transparent business model. It’s fully GDPR-compliant and headquartered in Paris, with data centers exclusively within the EU.
Highlights:
Flexible virtual instances and GPU-powered machines
Containers, serverless functions, and managed databases
Strong edge and ARM infrastructure for innovation
Scaleway is ideal for startups, SaaS providers, and dev teams who want sovereignty and simplicity.
Hetzner (Germany)
Hetzner has built a stellar reputation for high-performance, affordable cloud and dedicated servers. With its data centers in Germany and Finland, Hetzner ensures GDPR-compliant storage and processing at a fraction of the cost of global hyperscalers.
Unique features:
Flat-rate pricing and extremely low cost-per-GB
Full control with root access and SSH
Ideal for hosting, SaaS, and DevOps workflows
Case Study – Scaling a Global Environmental Platform
To support ReSource International’s global ambitions, Gart Solutions re-architected elandfill.io into a scalable SaaS platform on Hetzner Cloud. The solution replaced costly AWS plans with a Kubernetes-based setup, enabling real-time processing of geospatial and environmental data. As a result, the platform expanded from Iceland to 14 countries, cut infrastructure costs by 60%, and stayed true to its green tech values. Hetzner helped turn a local environmental tool into a global digital platform, without the AWS price tag.
Learn more.
T-Systems / Open Telekom Cloud (Germany)
Backed by Deutsche Telekom, T-Systems operates the Open Telekom Cloud, one of the most secure and enterprise-ready clouds in Europe. With high availability zones in Germany and the Netherlands, it’s perfect for businesses with compliance-heavy workloads.
Best for:
Government agencies and public services
Large enterprises needing hybrid cloud options
Healthcare, finance, and automotive sectors
T-Systems combines German engineering with global IT support, and it's deeply involved in Gaia-X and sovereign cloud initiatives.
Aruba Cloud (Italy)
Aruba Cloud is one of Italy’s leading cloud providers with a robust infrastructure across Europe. Known for its simplicity and cost-effectiveness, Aruba is a great choice for small and mid-sized businesses.
Benefits:
Data centers in Italy, France, Germany, and Czech Republic
Compliant with EU standards
Offers both VPS and enterprise IaaS solutions
If you're looking for sovereign cloud hosting with strong regional presence, Aruba is a top contender.
Industry-Specific Requirements for Sovereign Cloud
Different sectors face different sovereignty obligations. Understanding these nuances helps organizations select the right provider:
SectorSovereignty RequirementPublic SectorFull national & EU legal controlBanking & FinTechDORA-compliant resilience & exit strategiesHealthcareAI Act + GDPR + NIS2 enforcementSaaS PlatformsSovereign AI pipelines & data processingUtilitiesCritical-infrastructure continuity mandatesIndustry-Specific Sovereignty Requirements
Public SectorMust ensure data remains fully under national and EU jurisdiction, with strict auditing, support transparency, and high-assurance certification.
Banking & Financial ServicesSensitive personal and transactional data require robust sovereignty, continuous monitoring, and compliance with EBA, PSD2, and NIS2 guidelines.
Utilities & Critical InfrastructureAs “essential entities,” they must meet strict incident reporting, supply-chain controls, and ensure operational continuity under EU law.
SaaS & Digital PlatformsNeed sovereignty to serve regulated industries and expand globally, while preventing foreign access to customer datasets and analytics pipelines.
These requirements demonstrate why one-size-fits-all cloud strategies rarely work in Europe — sovereignty depends on sector, sensitivity, and scale.
Gaia-X and the Future of Federated Cloud Infrastructure
What Gaia-X Is and Why It Matters
Gaia-X is the EU’s most ambitious project aimed at reclaiming control over Europe’s digital future. Instead of creating another cloud provider, Gaia-X acts as a federated cloud ecosystem, connecting providers, users, and platforms under a common framework of trust, transparency, and interoperability.
It’s designed to ensure:
Sovereign data sharing between companies and countries
Vendor-neutral cloud architectures
Portability and reversibility of services
Full GDPR compliance by design
The ultimate goal of Gaia-X is to enable innovation while maintaining control over how and where data is used. It promotes open standards, multi-cloud strategies, and secure data flows across industries—from finance and energy to health and smart cities.
Gaia-X is not just a tech play. It’s a political and economic declaration that Europe will no longer rely solely on foreign tech monopolies. It’s about building a digitally autonomous future from the ground up.
Who’s Participating in Gaia-X?
Gaia-X brings together a mix of public institutions, startups, established tech companies, research centers, and policy groups. Major players include:
OVHcloud
T-Systems / Deutsche Telekom
Orange Business Services
Atos
Siemens
Scaleway
But it’s not just for the big guys — hundreds of SMEs and open-source projects have joined Gaia-X, contributing to use cases, governance frameworks, and technological standards.
In short, Gaia-X is building a community. By making sovereignty a shared responsibility, it encourages cooperation over competition. It’s about creating a European answer to AWS and Google Cloud without replicating their centralized models.
Gaia-X vs. Traditional Cloud Models
Here’s how Gaia-X fundamentally differs from the global cloud giants:
While Gaia-X won’t replace hyperscalers overnight, it will provide a blueprint for how Europe can innovate without compromising its values.
Sovereign AI — The Next Stage of European Autonomy
As AI adoption accelerates, sovereignty concerns extend far beyond traditional cloud services.
AI systems depend on massive datasets — customer information, behavioral patterns, industrial telemetry, and operational metadata. If this data is processed or stored by non-EU providers, it may fall under non-EU jurisdiction, even if anonymized.
The upcoming EU AI Act introduces strict governance requirements:
transparency of datasets
traceability and auditability
control over model training and inference
risk classifications for high-impact AI systems
For many organizations, this means AI workloads must run on EU-governed infrastructure with EU-controlled metadata, model weights, logging, and monitoring.
Sovereign AI is no longer optional — it will soon be an essential compliance requirement.
Challenges in Adopting EU Cloud Providers
Lack of Feature Parity with Global Giants
Despite their growth, many EU cloud providers still lack the breadth of services offered by hyperscalers. If your organization relies on cutting-edge AI/ML pipelines, advanced serverless infrastructure, or global CDN optimization, you may find some gaps.
For example:
OVHcloud may not match AWS in managed AI services.
Scaleway doesn’t yet offer the global distribution options of Google Cloud.
Hetzner, while powerful, lacks native integrations for enterprise software stacks like Salesforce or Microsoft 365.
The Hidden Cost of Sovereignty
Cloud migration is not only a legal challenge — it is a financial one.
Egress fees ($0.05–$0.09 per GB) create material cost exposure for enterprises migrating regulated workloads. Poorly planned migrations multiply sovereignty risk and long-term operational costs.
Sovereign-first architectures typically reduce egress spend by 30–50% through:
• Pipeline locality redesign• Data gravity containment• Multi-region replication strategies• Exit-optimized storage models
How to Choose the Right EU Cloud Provider
Assessing Security, Scalability, and Support
Choosing the right European cloud provider means balancing technical capabilities with regulatory requirements and business goals. Here's a quick checklist to guide your decision:
Security: Does the provider offer end-to-end encryption, ISO 27001 certification, DDoS protection, and GDPR-compliant data handling?
Scalability: Can the infrastructure scale horizontally and vertically? Are there options for load balancing, container orchestration, or serverless deployment?
Support: Is there 24/7 customer support in your local language? Do they offer clear Service Level Agreements (SLAs) and migration support?
Ecosystem Fit: Does the provider support open APIs, DevOps tooling, and integration with your software stack?
Data Jurisdiction: Are your workloads 100% located in EU jurisdictions, and not subject to non-EU laws like the CLOUD Act?
Providers like Scaleway are ideal for developers and agile startups, while T-Systems suits highly regulated enterprises. Hetzner is unbeatable for performance-per-euro, and OVHcloud delivers full-stack capabilities at scale.
Hybrid and Multi-Cloud Sovereignty Strategies
Not every workload needs to be moved off AWS or Azure today. A practical approach for many businesses is to adopt a hybrid or multi-cloud model:
Use hyperscalers for global edge services or non-sensitive content delivery.
Deploy critical workloads — like customer databases, compliance logs, or analytics pipelines — on sovereign EU clouds.
Leverage Kubernetes, Terraform, and Ansible to orchestrate resources across environments with minimal lock-in.
This strategy offers the best of both worlds: access to global performance when needed, and sovereignty where it matters. Just make sure your orchestration tools support cloud-agnostic deployments.
Conclusion
Europe stands at a crossroads. It can continue to rely on foreign digital giants — or it can take control of its digital destiny. Choosing a European cloud provider is about much more than IT infrastructure.
It’s about:
Preserving privacy
Empowering local innovation
Strengthening legal autonomy
Driving economic growth
https://youtu.be/9VratGTxbZQ?si=LwnmskfbGPQ9RpKE
Providers like OVHcloud, Scaleway, Hetzner, T-Systems, and Aruba Cloud offer real, battle-tested alternatives that align with these goals. The emergence of Gaia-X and sovereign frameworks is accelerating this shift.
How Gart Solutions Supports Sovereign Cloud Transformation
Gart Solutions designs sovereign-first cloud architectures, NIS2/DORA/AI-Act compliant migration roadmaps, egress-optimized multi-cloud strategies, and EU sovereign AI infrastructure.
If your workloads involve regulated data, AI pipelines, public integrations, or cross-border SaaS — your cloud architecture is now a legal architecture decision.
For businesses, the path is clear: audit your cloud strategy, embrace sovereignty where it counts, and invest in a future where Europe owns its cloud — and not the other way around. Contact Us and let's find the best cloud provider, that support your business needs and future plans.
Download our Digital Sovereignty Readiness & EU Cloud Assessment Guide
Digital-Sovereignty-Readiness-EU-Cloud-Assessment-GuideDownload