Monitoring as a Service (MaaS) is a managed approach to collecting, analyzing, and acting on system and business metrics — without requiring in-house teams to build and maintain the full monitoring stack.
Monitoring is the collection, normalization, and visualization of data about a digital product’s health. It spans three layers — infrastructure, platform, and application — and is most valuable when it maps directly to business processes, not just resource utilization.
What monitoring really means
Ask five engineers what monitoring is and you’ll get five different answers. Some will say dashboards. Others will say alerts. Someone will mention Prometheus. All of them are technically correct, and all of them are describing only part of the picture.
At its core, monitoring as a process is the collection, normalization, and representation of data that describes the state of a digital product. It’s not a tool, not a dashboard, and not a one-time setup. It’s an ongoing operational discipline that answers one question: is the system doing what it’s supposed to do?
When you see traffic graphs in Google Search Console, that’s monitoring. When your e-commerce platform alerts you that checkout is slow, that’s monitoring. When your SRE team catches a queue backup at 3 AM before customers notice, that’s monitoring done right.
The problem is that most teams implement monitoring in pieces — a few infrastructure dashboards here, some log aggregation there — without connecting it to actual business outcomes. That gap between technical signals and business meaning is exactly where incident response gets expensive.
What is Monitoring as a Service (MaaS)?
Monitoring as a Service (MaaS) is a managed model in which a provider sets up, configures, and continuously operates a monitoring stack on your behalf — rather than your team building and maintaining it in-house. Instead of hiring dedicated SRE engineers to own every layer of observability, you consume monitoring as an ongoing service with defined deliverables.
The distinction from self-hosted monitoring is operational, not technical. The underlying tools — Grafana, Prometheus, Loki, Datadog — are often the same. The difference is who configures them, who tunes the alert thresholds, who responds when something looks wrong, and who keeps the stack updated as your product evolves.
What Monitoring as a Service typically includes
A complete MaaS engagement covers the full observability lifecycle, not just dashboard setup:
| Deliverable | What it means in practice |
|---|---|
| Setup & infrastructure | Deploying and configuring the monitoring stack (Prometheus, Loki, Grafana or equivalent) in your environment — cloud, on-prem, or hybrid |
| Instrumentation | Connecting exporters and agents to your infrastructure, platform services (databases, queues, gateways), and application code so the right signals are collected |
| Dashboards | Building purpose-built dashboards per layer — infrastructure health, platform performance, and business process visibility — tailored to your team’s actual workflows |
| Alerting | Defining thresholds, escalation policies, and notification routing (Slack, PagerDuty, email) so the right person is notified at the right time — not everyone, about everything |
| Ongoing optimization | Reviewing and tuning thresholds as the system grows, reducing alert noise, adding new coverage when new services launch, and adapting to changing SLAs |
The last point is the one most teams underestimate. A monitoring setup that was accurate six months ago may be generating false positives today because traffic patterns changed, new services were added, or SLA expectations shifted. Ongoing optimization is what keeps monitoring useful rather than just present.
Who Monitoring as a Service is for
MaaS is not a fallback for teams that “can’t do it themselves.” It’s the operationally rational choice for specific situations:
- Teams without dedicated SRE capacity. Most product engineering teams don’t have a full-time SRE. Setting up and maintaining a multi-layer monitoring strategy requires specialized knowledge — and maintaining it requires ongoing attention. MaaS fills that gap without the cost of a full-time hire.
- Scaling SaaS products. When your product grows from dozens to hundreds of services, monitoring complexity scales with it. A managed provider can absorb that complexity while your engineers stay focused on product development.
- Multi-tenant platforms. Products serving multiple clients — each with different data volumes, SLAs, and operational norms — need monitoring that is both unified and per-tenant configurable. This is technically non-trivial to maintain at scale, and exactly the kind of problem a MaaS engagement is designed to solve. It’s what we did for elandfill.io as part of their global platform rollout.
“The hardest part of monitoring isn’t choosing a tool — it’s knowing what to measure, what to ignore, and what to do when something turns red. That knowledge lives in the people operating the system, not in the software.”
— Fedir Kompaniiets, CEO & Co-Founder, Gart Solutions
The three layers of monitoring
A well-designed monitoring strategy covers three distinct layers. Each one gives you a different lens on what’s happening in your system. Miss any of them, and you’ll have blind spots.
Layer 1: Infrastructure
This is where most teams start. Infrastructure monitoring tracks the physical and virtual resources your digital product consumes: CPU utilization, memory, disk I/O, and network throughput. Whether your workloads run on bare metal, VMs, or Kubernetes nodes, these metrics tell you whether your foundation is healthy.
Infrastructure monitoring is well-understood, well-tooled, and largely standardized. It answers: does the system have enough resources to operate?
Layer 2: Platform
Above infrastructure sits your platform layer — the software stack that your application relies on. This includes databases, message queues, load balancers, caches, container orchestration, and API gateways.
Platform-level monitoring answers more specific questions: how many connections is your PostgreSQL database handling right now? How fast is your load balancer responding to requests? How many messages are sitting unprocessed in your queue? These metrics correlate directly with application behavior and are often where bottlenecks hide.
Layer 3: Application
The highest layer monitors the application itself — the business logic your team has written. This is where you track things like payment transaction rates, order processing times, API error rates, and feature-specific events. Unlike the lower layers, application metrics vary for every product because every product has unique business logic.
Getting application-level monitoring right requires instrumentation inside the code itself: embedding metric collectors that emit the signals relevant to your specific domain.
| Layer | What it monitors | Example metrics | Standard tools |
|---|---|---|---|
| Infrastructure | Servers, VMs, containers, network | CPU %, RAM usage, disk I/O, network throughput | Prometheus node exporter, CloudWatch, Datadog agent |
| Platform | Databases, queues, load balancers, gateways | DB connections, queue depth, request latency, error rate | Prometheus exporters, Grafana, Loki |
| Application | Business logic, user flows, transactions | Orders per minute, payment success rate, processing duration | Custom instrumentation, OpenTelemetry, APM tools |
Why infrastructure metrics alone aren’t enough
Here’s a scenario that happens more often than teams want to admit. Your e-commerce platform starts getting complaints: checkout is slow, some orders aren’t going through. You open your infrastructure dashboard — CPU is normal, memory is fine, network looks good. Everything is green, yet customers are struggling.
The problem is somewhere in your platform or application layer. Maybe your order-processing service uses a message queue, and that queue is filling up because the consumer can only handle three concurrent workers. On a regular day, that’s more than enough. On Black Friday — or any day with a promotional push — thousands of orders arrive within minutes and the queue depth climbs rapidly. Infrastructure utilization stays flat; the backlog grows silently.
Without platform-level monitoring showing you queue depth, message processing rate, and consumer throughput, you’d never see this coming. You’d be reading infrastructure dashboards, scratching your head, and manually checking logs on each individual service.
“Without the right monitoring layer, you end up walking through every service manually, looking for logs. A proper dashboard accumulates everything it needs in one place — you know exactly at which step of the process something went wrong.”
— Fedir Kompaniiets, CEO & Co-Founder, Gart Solutions
The lesson: monitoring as a process requires coverage at all three layers simultaneously, connected to each other in a coherent way. A metric spike on Layer 2 should tell you something meaningful about the user experience on Layer 3.
Monitoring as a Service for business workflows
The most mature form of monitoring isn’t about watching servers — it’s about watching business outcomes. This is the layer that sits on top of all three technical layers: monitoring the sequence of events that constitutes a business workflow.
Consider a payment flow. A user fills a cart, hits checkout, enters card details, confirms. Behind the scenes: a frontend service creates an order message, drops it into a queue, a backend service picks it up, calls a payment gateway, receives a confirmation, updates the order state. That’s five or six discrete steps, each involving a different service.
Business process monitoring maps this entire sequence onto a single dashboard. You’re not watching CPU — you’re watching whether the payment flow completed successfully, how long each step took, and which step failed when something goes wrong.
This sits at the intersection of business analysis and classical SRE monitoring. The metrics are unique to each product, which is exactly what makes this layer the hardest to configure — and the most valuable when done well. Want to explore this approach for your own platform? Talk to our team to see how we’d map your business processes to observable signals.
Defining the right metrics for your business
Infrastructure and platform metrics are mostly standardized — any team knows to monitor CPU, RAM, and query latency. Business process metrics, by contrast, are unique to each product. Defining them requires close collaboration between engineers and domain stakeholders to answer: what does “healthy” look like for this specific workflow?
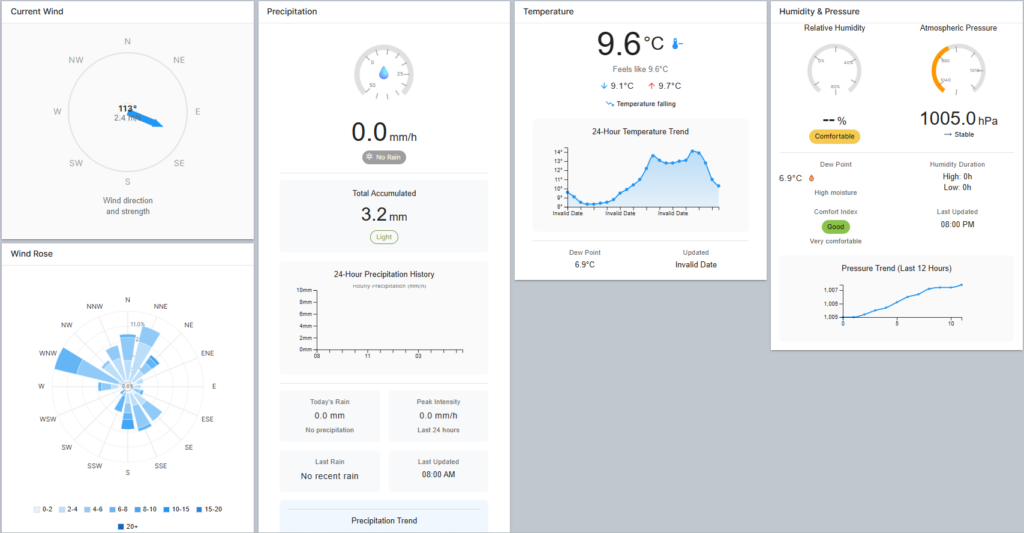
For a landfill management platform, a healthy process might mean: a drone image upload is received, compressed, 3D-transformed, and rendered on the map within a defined SLA. For a payment processor, it might mean: 99.5% of transactions complete within two seconds. Different domains, different definitions, same structural approach.
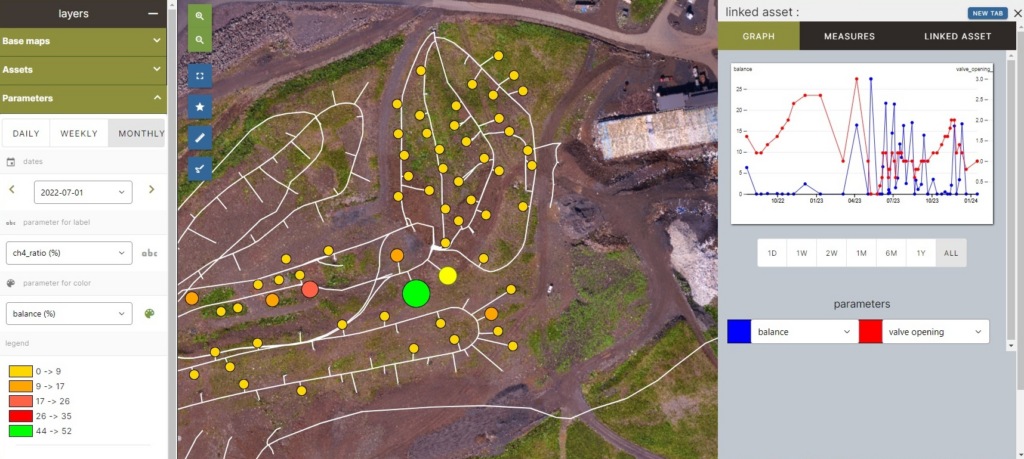
Case study: monitoring a global landfill platform
elandfill.io is a digital platform that manages landfill operations: tracking assets, centralizing data collection, monitoring gas and leachate levels, and overlaying drone imagery onto geospatial maps. When ReSource International needed to scale from Iceland to a multi-country, multi-tenant solution, Gart Solutions built the Resource Management Framework (RMF) — and the Monitoring Layer was central to its architecture.
The business process that needed monitoring
One of the platform’s core workflows involves processing high-resolution drone imagery. An operator registers a drone flight, uploads a large image file (sometimes 2–10 GB), selects compression parameters, and expects to see a 3D-rendered overlay on the map. This single user action triggers a four-service pipeline:
- Frontend (web app) — accepts the upload and writes an event message to a message queue
- NATS Message Broker — queues the processing job asynchronously
- Messenger service — reads the queue, normalizes the job parameters, and launches the appropriate processing engine
- 3D transformation engine (Geodal) — performs the computationally intensive 3D rendering, then scales down once complete to avoid idle resource cost
Each service is independent. Each contributes a different step to the overall workflow. Without a unified monitoring view, a failure anywhere in this pipeline would require manually inspecting logs across all four services to find the root cause.
How the monitoring layer was built
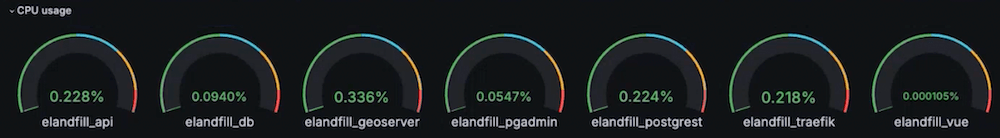
Gart Solutions implemented a monitoring stack based on Grafana, Prometheus, and Loki — all open-source tools configured as part of the RMF’s Monitoring Layer. The stack was connected to all three technical layers: infrastructure metrics from the Hetzner cloud environment, platform-level metrics from the NATS broker and PostgreSQL/PostGIS databases, and application-level metrics from the processing services themselves.
The key output was a single Grafana dashboard that visualized the entire drone processing pipeline end-to-end. Engineers and operators can open it and immediately see:
- Whether an upload was received and queued
- Whether the messenger service picked up the job
- Whether the 3D engine started (visible as a resource usage spike on the graph)
- How long each stage took, compared to historical averages
- Color-coded thresholds: green for on-target, red for exceeding the defined SLA
This dashboard also drives operational decisions about the 3D engine’s scaling behavior. Because 3D transformation is resource-intensive but runs infrequently — perhaps once or twice a day — the messenger service spins the engine up on demand and shuts it down when the job completes. The monitoring layer makes this lifecycle visible and measurable, not invisible.
Results
The Platform Engineering approach, with its embedded Monitoring Layer, enabled ReSource International to scale elandfill.io from a single-country product to a global platform with clients in Iceland, Sweden, and France. The unified dashboard reduced mean time to diagnosis when issues arose, because operators no longer needed to correlate logs across multiple services manually.
See the full Platform Engineering case study and the detailed elandfill.io transformation write-up on the Gart website.
Monitoring as a Service vs. in-house monitoring
Choosing a monitoring stack is one of the first decisions teams face. The market divides into two broad camps: commercial SaaS platforms and open-source self-hosted stacks. Both are viable; the right choice depends on your team’s capacity and your product’s complexity.
| Dimension | Open-source stack (Grafana / Prometheus / Loki) | Commercial SaaS (Datadog, New Relic, Dynatrace) |
|---|---|---|
| License cost | Free (self-hosted infrastructure cost only) | Per-host or per-metric pricing; can scale quickly |
| Setup effort | Higher — requires configuration and maintenance | Lower — managed, with agents and auto-discovery |
| Customization | Full control over dashboards, alerting, data retention | Limited by platform capabilities and plan tier |
| Integrations | Wide — Prometheus has exporters for most common tools | Wide — usually includes pre-built dashboards per service |
| Best for | DevOps/SRE Capacity Cost-conscious scaling |
Fast Time-to-Value Less ops overhead |
For the elandfill.io platform, Gart Solutions chose the open-source stack: Prometheus for metrics collection, Loki for log aggregation, and Grafana for visualization. Prometheus ships with ready-made exporters for common services — including Kubernetes, PostgreSQL, and NATS — making infrastructure and platform-level data collection straightforward. Loki integrates natively with Grafana, keeping logs and metrics in a unified interface.
The open-source route required more initial configuration, but it gave the team full control over what to monitor, how dashboards were structured, and how alert thresholds were tuned per client environment — essential for a multi-tenant SaaS product where each customer’s operational norms differ.
From monitoring to automation: closing the loop
Monitoring’s true ROI emerges when you move beyond passive observation into active response. Once you have reliable signals about the state of your system and business processes, those signals can become triggers for automated actions.
The basic pattern looks like this: a metric crosses a threshold → a webhook fires → something happens automatically. That “something” can range from sending a Slack notification to creating an incident ticket to scaling a service horizontally.
Common automation patterns
- Alert routing — When a business process dashboard turns red (e.g., processing duration exceeds SLA), automatically create a ticket in your issue tracker and notify the on-call engineer via PagerDuty or Opsgenie.
- Auto-scaling — When queue depth exceeds a threshold, trigger a scaling event to add more consumer replicas. When it normalizes, scale back down. This is exactly the pattern used in the elandfill.io 3D transformation service.
- Runbook automation — For well-understood failure modes, link alerts directly to automated remediation scripts that restart services, flush caches, or reroute traffic.
The right mental model: any deviation from a known-healthy state should have a documented response. When you’ve defined all the “if this, then that” rules for your critical processes, your team stops firefighting and starts engineering.
Monitoring as a process, then, is less about the dashboards and more about the operational maturity they represent. A team that has mapped its business workflows to observable signals — and connected those signals to automated responses — is a team that can sleep at night.
How Gart Solutions can help – Monitoring as a Service (SRE & IT Monitoring)
Most teams have some monitoring in place. Far fewer have monitoring that connects infrastructure health to business outcomes. If you’re not sure what’s happening inside your critical workflows — or you’re spending too long correlating logs after incidents — we can help you fix that.
We design and implement multi-layer monitoring strategies — from infrastructure through to business process dashboards — using Grafana, Prometheus, Loki, and custom instrumentation tailored to your platform.
We build Internal Developer Platforms with observability baked in from day one, so your team has the tools to understand their system without digging through raw logs.
Ongoing infrastructure oversight with proactive monitoring, alerting, and incident response — so your team can focus on product, not operations.
See how we can help to overcome your challenges