Cloud unit economics measures what your cloud spend buys, per unit of business value. For most SaaS companies, that unit is a customer. To calculate cost per customer, take your production cloud cost (amortized, credits excluded), add each tenant’s direct costs to a fair share of shared costs, and divide by active paying customers. Then compare the result with revenue per customer. The median private B2B SaaS company spends 5% of ARR on hosting. If you’re well above that, the calculation shows you where the money goes.
Most SaaS teams can tell you their AWS bill to the dollar. Far fewer can tell you what it costs to serve one customer, or which pricing tier is quietly losing money on infrastructure. That second number is what cloud unit economics gives you. It’s also what turns “the bill went up 30%” from bad news into a question you can answer: did customers grow faster than that, or not?
This guide shows how to calculate cost per customer step by step. It includes a worked example by pricing tier, benchmarks to judge the result against, and a calculator for your own numbers. It’s based on the work our AWS cost optimization consulting team does with SaaS clients, including two projects where unit costs fell by roughly 80%.
Survey benchmarks come from SaaS Capital’s 2026 survey of more than 1,000 private B2B SaaS companies and from a16z’s 2021 analysis of public software companies. Both links are in the text.
The worked example uses a hypothetical company so that every step can be shown. Its numbers are illustrative.
Benchmark bands (under 3%, 3–7%, 7–12%, over 12%) are our own interpretation, built around the survey median. Gart results come from client billing data, as published on our case study pages. Last checked: October 2026.
What is cloud unit economics?
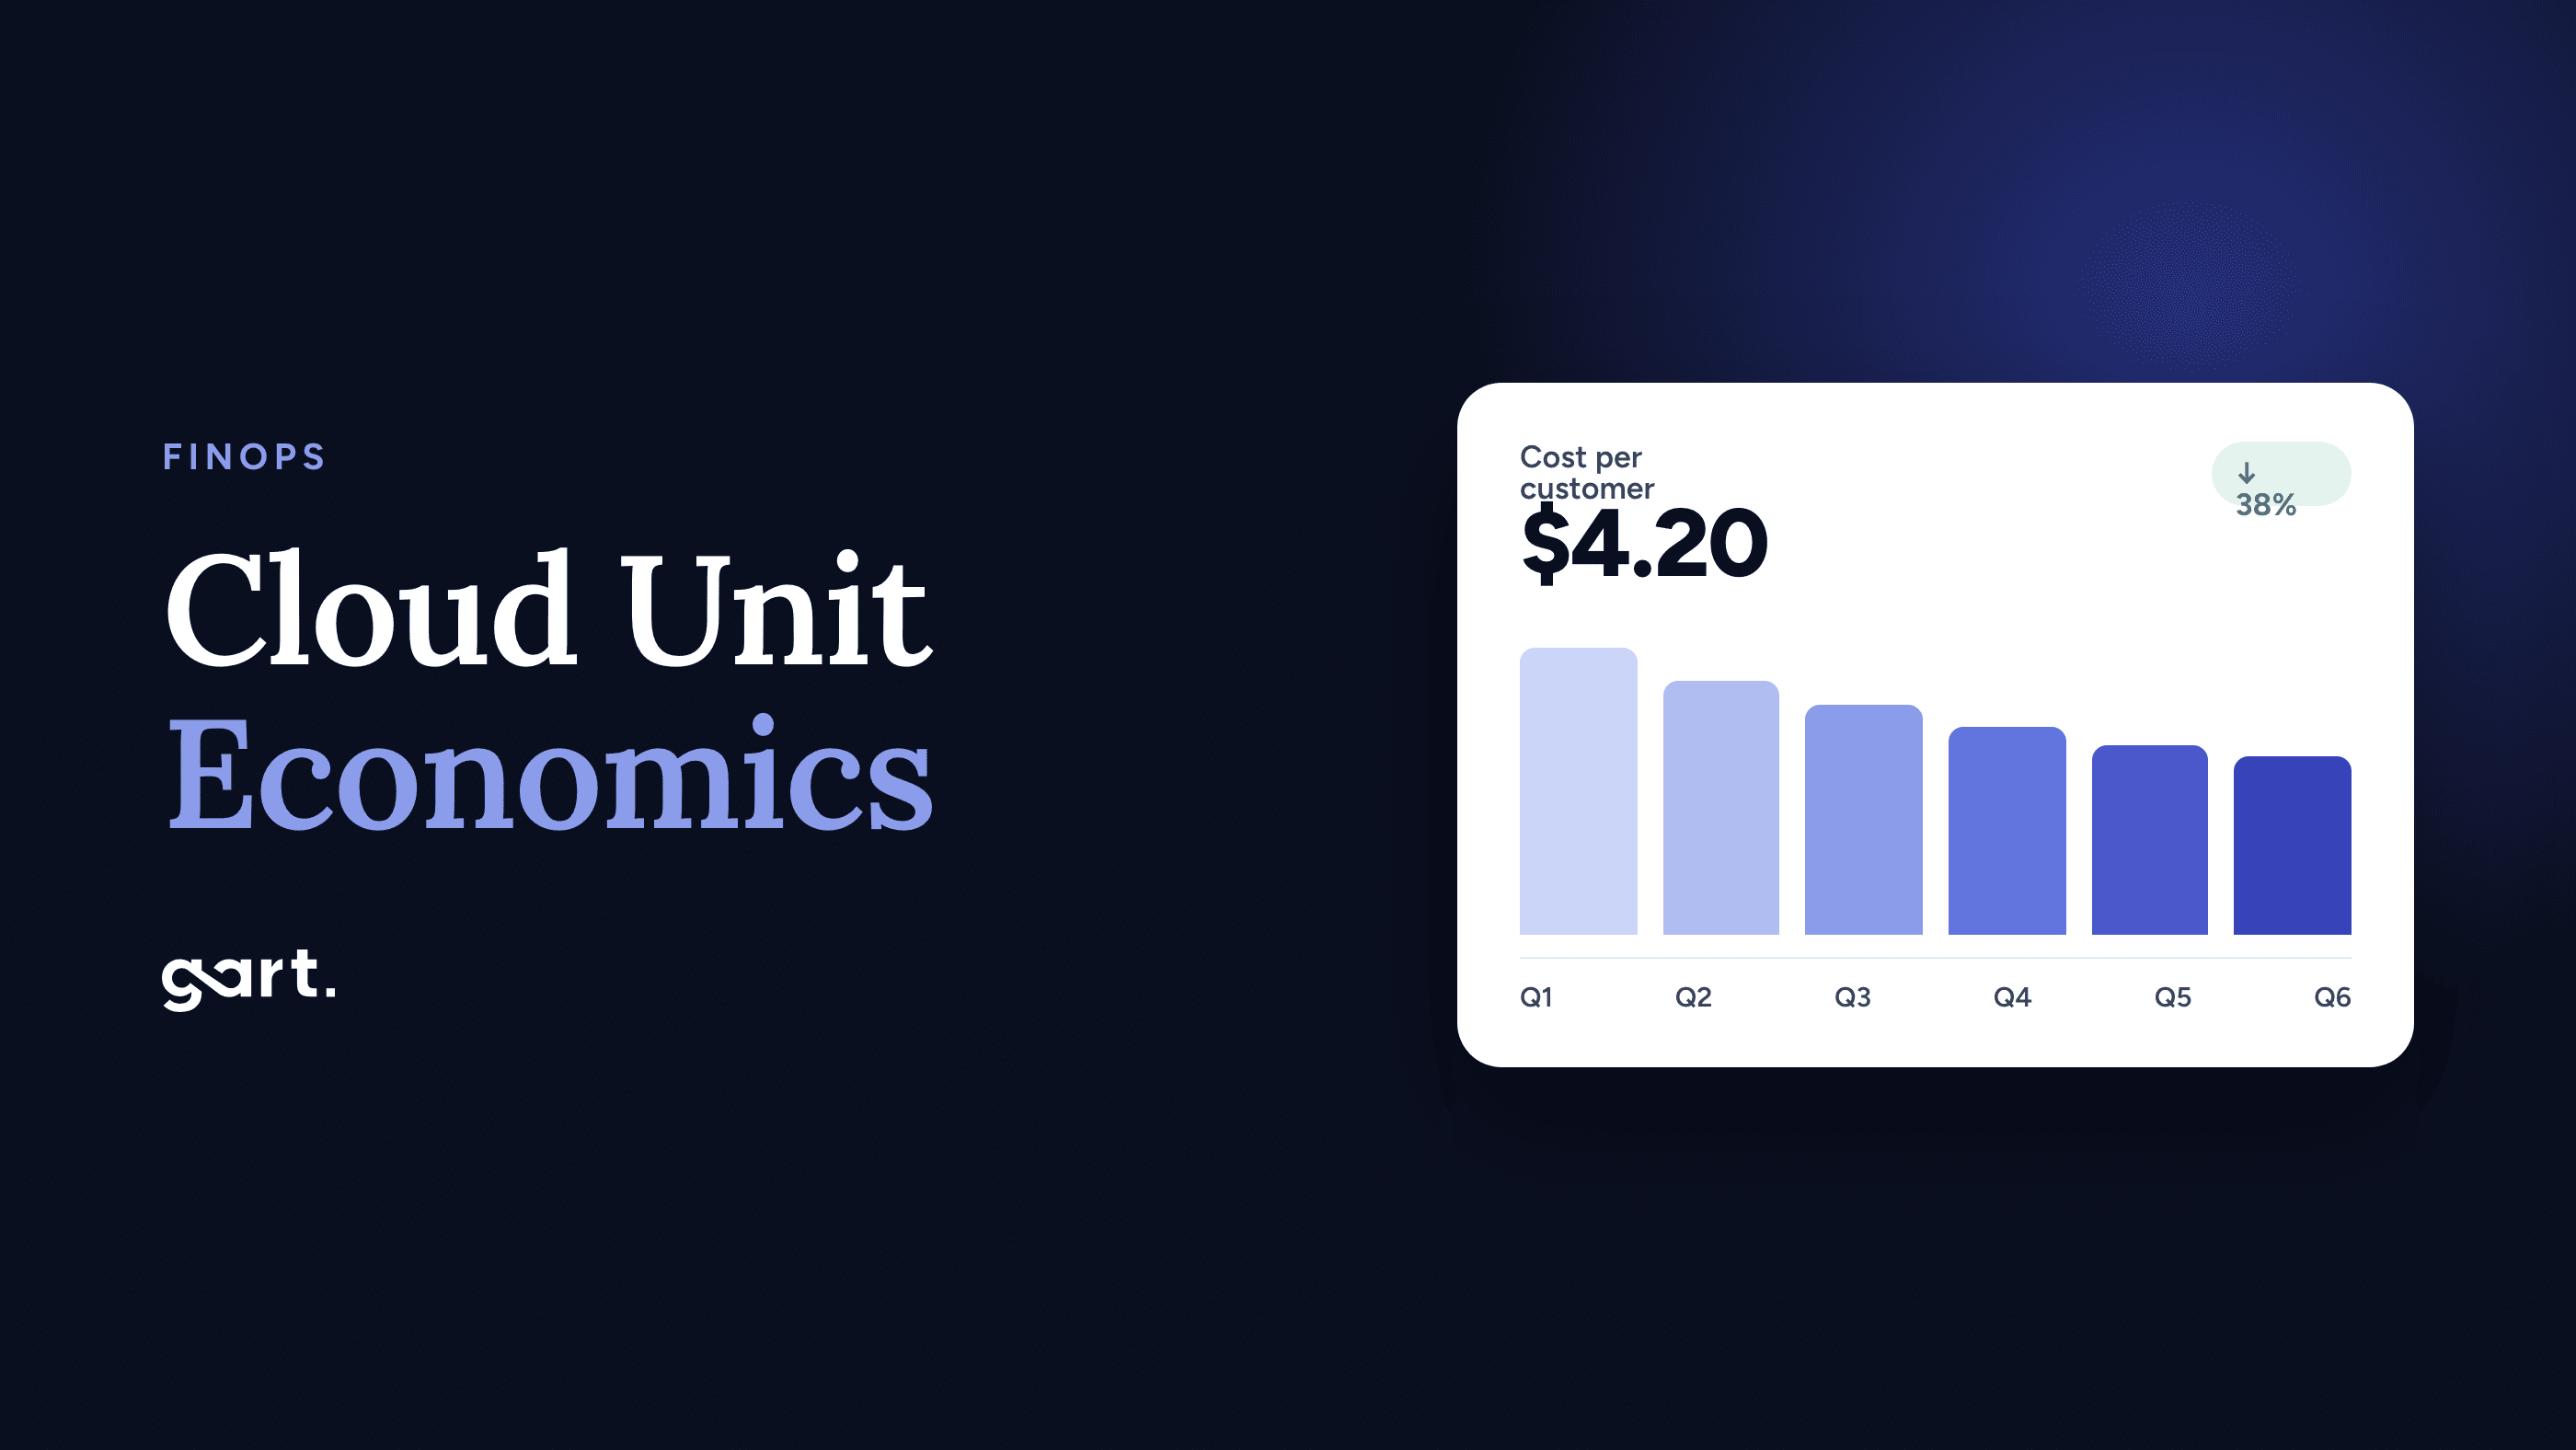
Cloud unit economics links cloud spend to the business output it produces. Instead of reporting “we spent $24,000 on AWS this month”, you report “it cost $4.20 to serve a customer, against $170 of revenue from that customer”. The FinOps Foundation treats this as a core capability. In its framework, unit economics is how organizations connect technology spend to the value of what they deliver.
The total bill can’t tell you whether you’re getting more efficient, because it grows whenever the business grows. A unit cost can. If spend rises 30% and customers rise 60%, efficiency improved. If customers are flat and cost per customer keeps rising, something in the architecture is scaling the wrong way. That’s usually an oversized database, logs with no retention, or a non-production estate as large as production.
Cost per customer is the right starting unit for most SaaS businesses. But if your customers vary a lot in size, add a unit of work next to it:
| SaaS profile | Usual top cost driver on AWS | Best unit metric | First lever |
|---|---|---|---|
| B2B workflow / CRUD app | RDS or Aurora, often Multi-AZ with Provisioned IOPS | Cost per customer | Database rightsizing, gp3 storage, Reserved Instances |
| Content and EdTech platforms | Database plus storage and CDN | Cost per active learner or user | Data lifecycle, CDN caching, database design |
| Data and analytics SaaS | Pipeline compute, warehouse queries, S3 | Cost per GB processed | Spot for batch, storage tiers, query tuning |
| Video and AI vision | GPU or CPU compute for processing | Cost per video hour or per inference | Spot capacity, batch scheduling, right GPU class |
| Multi-tenant on Kubernetes | Node overprovisioning, NAT and data transfer | Cost per tenant (namespace) | Bin-packing, autoscaling, VPC endpoints |
How to calculate cost per customer in 6 steps
You can get a rough number from last month’s invoice in five minutes: bill divided by customers. It’s a useful first benchmark, but a poor basis for decisions, as the worked example below shows. These six steps turn it into a number you can price and plan with.
Step 1Choose the right cost basis
The same bill can produce four different unit costs, depending on which view of it you use. Pick one basis and keep it consistent month to month:
| Item | Recommendation | Why |
|---|---|---|
| Savings Plans and Reserved Instances | Use net amortized cost in Cost Explorer or the CUR | Unblended cost puts upfront fees into a single month, which makes your unit cost jump and then collapse. |
| Promotional credits | Exclude them | Credits expire. If your unit cost only looks healthy because of credits, the problem shows up later. |
| Support plan | Include as a shared cost | Business or Enterprise Support scales with spend, so it’s a real cost to serve. |
| Marketplace software | Include if the product depends on it | A third-party database or security tool billed through AWS is part of what it costs to serve customers. |
| Tax | Exclude | Keeps comparisons clean across regions and entities. |
Separate production from non-production
Development, staging, CI and demo environments are an engineering cost, not a cost to serve. Keep them out of the production unit cost, and track them as their own ratio (non-production as a share of the total). Separate AWS accounts under AWS Organizations give you the cleanest split. If you can’t use separate accounts, enforce an environment tag in Terraform. On bills that have never been split, non-production is often a bigger share than the team expects.
Step 3Split direct costs from shared costs
A direct cost belongs to one tenant or one pricing tier, such as a dedicated database for an enterprise customer or a tenant-specific S3 bucket. Tag these with tenant_id or customer_tier and activate those tags as cost allocation tags. Everything else is shared: the main database, load balancers, observability, NAT gateways, support.
Shared Kubernetes and ECS clusters used to be a blind spot. On AWS, you can turn on split cost allocation data, which divides each instance’s cost across the pods or tasks that ran on it, based on CPU and memory use. If you run one namespace per tenant, that makes container costs directly attributable.
Step 4Allocate shared costs with a usage driver
Divide the shared pool in proportion to a driver that reflects actual consumption:
Avoid allocating by revenue. It makes every customer look equally profitable, which is exactly what this exercise is meant to test. If one driver doesn’t fit everything, split the pool: allocate database costs by queries or storage, and network costs by GB transferred. AWS Cost Categories can apply these split rules automatically.
Step 5Divide by the right customer count
Use active paying customers in the same month as the cost data. Treat free-tier users as an acquisition cost: put their share of the infrastructure under marketing, or report “cost per free user” separately. Don’t fold them into the paying-customer denominator. For usage-heavy products, divide the same cost pool by your unit of work as well, such as video hours or GB processed.
Step 6Compare against revenue, and track it monthly
A unit cost only means something next to unit revenue. Calculate the margin per customer and hosting as a percentage of revenue, by pricing tier. Then put it on a monthly dashboard: query the Cost and Usage Report in Athena, join it with MRR and customer counts from your billing system, and alert on any month-over-month swing above about 15%. We describe how we run this rhythm with clients in our FinOps cloud cost management experience.
Worked example: cost per customer by pricing tier
Here’s the full calculation for a hypothetical B2B SaaS company with three pricing tiers, 1,520 paying customers and $258,500 MRR. Its net amortized AWS bill is $24,000 a month. Non-production is $4,000, which leaves $20,000 in production. Of that, $8,000 is direct (dedicated databases and storage for Growth and Enterprise tenants) and $12,000 is shared, allocated by API request volume.
| Tier | Customers × price | Direct | Shared (API share) | Total cost | Cost per customer | % of revenue |
|---|---|---|---|---|---|---|
| Starter | 1,200 × $49 | $0 | $3,000 (25%) | $3,000 | $2.50 | 5.1% |
| Growth | 300 × $399 | $2,000 | $5,400 (45%) | $7,400 | $24.67 | 6.2% |
| Enterprise | 20 × $4,000 | $6,000 | $3,600 (30%) | $9,600 | $480.00 | 12.0% |
| Total | 1,520 · $258,500 MRR | $8,000 | $12,000 | $20,000 | $13.16 (blended) | 7.7% |
Three things stand out, and none of them is visible from the total bill:
The naive number misleads. $24,000 ÷ 1,520 = $15.79 per customer. That’s six times what a Starter customer actually costs, and a thirtieth of what an Enterprise customer costs. Any pricing decision based on it would be wrong for every tier.
The average hides the problem tier. Blended hosting is 7.7% of revenue in production (9.3% fully loaded), just above the median. But Enterprise sits at 12%, because its dedicated databases were sized for peak load and never reviewed. That’s where the optimization work belongs. Starter, at 5.1%, is fine.
It changes the commercial conversation. With $480 a month in infrastructure per Enterprise customer, the company knows its floor price for discounts and can make dedicated infrastructure a paid add-on instead of a free default.
Cloud unit economics benchmarks for SaaS
There’s no universal “good” cost per customer. A $20-a-month SMB tool and a $50,000-a-year enterprise platform will never have similar figures. What does carry across companies is the ratio of cloud spend to revenue. SaaS Capital’s 2026 spending benchmarks for private B2B SaaS companies survey more than 1,000 companies and put median hosting at 5% of ARR, unchanged from the year before, with a further 4% for DevOps.
At scale, cloud becomes the largest item in COGS. In The Cost of Cloud, a Trillion Dollar Paradox, a16z estimated that committed cloud spend was about 50% of cost of revenue at public software companies that disclose it. That’s 2021 data, but the conclusion still holds: every point of hosting spend is a point of gross margin.
| Hosting as % of revenue | What it usually means | What to do next |
|---|---|---|
| Under 3% | Lean. Either the product is light, or FinOps is already mature. | Protect it: budgets, anomaly alerts, monthly unit-cost review. |
| 3–7% | Around the median for B2B SaaS. | Hygiene and commitment coverage. Expect 10–25% savings, not a redesign. |
| 7–12% | Above median. Common after fast growth, or with a database-heavy design. | Find the one or two services driving the cost. Rightsizing plus Savings Plans or Spot usually closes most of the gap. |
| Over 12% | A structural issue is likely, unless the product is video, AI or data processing at its core. | Architecture review: database design, managed-service premiums, where workloads run. |
The bands are Gart’s interpretation, built around the SaaS Capital median. They are not survey results. Apply them per pricing tier as well as to the blended number.
Cost per customer calculator
Enter four numbers from last month’s bill and your billing system. The calculator shows your cost per customer and hosting ratio against the 5% median. It then estimates what each type of fix would save, using savings rates from real Gart projects. For a per-tier view, run it once for each tier, using that tier’s allocated cost.
Everything is calculated in your browser. Nothing is sent anywhere.
What could each type of fix save?
Case percentages are what those specific clients achieved, not a promise for your bill. The 50% option is an illustrative middle scenario, not a case result. Savings from different levers don’t simply add up, because each one applies to a smaller remaining bill.
Want your unit economics calculated for you?
Our engineers review your Cost Explorer and CUR data with read-only access. You get cost per customer by tier and the services driving it.
FluentU: how fixing the database cut cost per customer by about 78%
FluentU is a language-learning platform that teaches through authentic video content. It runs a web app, native mobile apps, a Chrome extension, a WordPress blog and a set of scheduled workers. After years of growth, its AWS footprint included multiple app servers behind load balancers, several RDS databases (main platform, blog and demo), ElastiCache, CloudFront, S3, NFS shares and SQS.
Verified Cost Explorer data put the baseline at $9,318.15 a month. The service breakdown was the real finding. RDS alone cost $6,071.87, or 65.16% of the bill. The main Multi-AZ database class accounted for $2,035.58, Provisioned IOPS for $1,400, a second Multi-AZ class for $1,100.73 and PIOPS storage for $625. In unit-economics terms, two-thirds of the cost of serving every learner was a database configuration. Rightsizing a few EC2 instances would never have fixed that.
| Stage | Monthly run-rate | Change in cost per customer* |
|---|---|---|
| AWS baseline | $9,318 | – |
| First month after cutover (AWS only, cleanup in progress) | $4,690 | −49.7% on AWS |
| Combined run-rate: optimized Hetzner (~$1,429) + AWS backups ($600–630) | $2,029–2,059 | ~−78% |
| After AWS backup retention expires | $1,599–1,619 | ~−83% |
*With the same customer base, cost per customer falls by the same percentage as the run-rate. FluentU’s customer count isn’t public, so no dollar figure per customer is shown. Source: FluentU case study, AWS Cost Explorer and Hetzner billing. Annualized savings: about $87,100–87,500.
The savings didn’t come from one switch. Over six months, the team designed the target environment, rebuilt it after schema validation found 1,179 missing indexes across 1,474 tables, and ran AWS DMS with change data capture. They aborted the first cutover when CDC latency rose, then succeeded on the retry. After cutover, Hetzner itself was trimmed by another ~$601 a month (29.6%) through app, cron and cache rightsizing, plus orphan cleanup. Moving off AWS was right for this workload. It isn’t right for everyone, and our Hetzner vs AWS comparison covers the trade-offs.
Unit-economics signal from this case: if one AWS service makes up more than half of your cost per customer, start with an architecture review, not a tactics checklist. In our experience, that service is usually the database.
Jewelry AI: unit economics for AI workloads, measured per video hour
A Thai jewelry manufacturer wanted AI to analyze worker activity across 200–250 workstations, so it could find production bottlenecks. Each workstation records about 9 hours a day. That’s around 1,800 hours and 2 TB of video every day, processed overnight with feature extraction and classification.
This project ran on Azure, not AWS. We include it because the cost lesson carries straight over to AWS. The first design, based on a network video recorder setup and on-demand pricing, was estimated at $5,363 a month. Our team redesigned the processing layer around Azure Spot VMs in scale sets, with pipelines built to absorb interruptions. On AWS, the same pattern is EC2 Spot in an Auto Scaling group, or AWS Batch on Spot. The estimated total fell to $1,100 a month, and the compute layer alone went from $4,700 to $430. The case reports that Spot interruptions had zero impact on the video processing workflows.
There’s one customer here, so cost per customer tells you nothing. The useful metric is cost per unit of work:
| Unit metric | On-demand design | Spot design | Change |
|---|---|---|---|
| Total per month | $5,363 | $1,100 | −$4,263 |
| Per workstation per month (200) | $26.82 | $5.50 | −79.5% |
| Per video hour (~54,000 a month) | ~$0.099 | ~$0.020 | −79.5% |
| Compute layer only | $4,700 | $430 | −90.9% |
Source: Jewelry AI Vision case study. Per-unit figures are our arithmetic: 200 workstations × 9 hours × 30 days. The case headline cites 81%; the published monthly figures give 79.5%.
For any SaaS company shipping AI or video features, the lesson is to calculate the unit cost while the architecture is still on paper. A per-video-hour cost of $0.099 versus $0.020 decides whether a feature is profitable at your planned price. That’s much easier to fix before launch than after the bill arrives. The same applies to GPU and node costs on Kubernetes, where idle capacity hides easily.
How to reduce your AWS bill once you know your unit cost
Once you know your band, and which tier or service is pushing it up, the order of work is fairly predictable. This is how we sequence it in engagements:
| Your band | Weeks 1–2 | Weeks 3–6 | Typical outcome |
|---|---|---|---|
| 3–7% | Orphaned resources, log retention, gp2 to gp3, scheduling non-production | Savings Plans and Reserved Instances on the cleaned-up baseline | 10–25% lower bill; cost per customer flat as you grow |
| 7–12% | Spend by service and by tier, top-two cost drivers, tag coverage | Database and compute rightsizing, Spot for stateless and batch work, VPC endpoints | 25–40% lower; Datamaran reached 25% with Savings Plans plus Spot |
| Over 12% | Architecture review: data model, managed-service premiums, data transfer | Redesign the dominant workload, or move it where it’s cheaper to run | 50%+ is possible; FluentU reached ~78% |
For individual tactics, with risks and validation steps for each, see our guide to lowering your AWS bill. For the strategic view, read AWS cost optimization strategies and best practices. If the waste is spread thinly across many services, the common cloud cost traps make a good checklist.
From crawl to run: maturing your cloud unit economics
Nobody gets to exact per-tenant costs in one sprint. The FinOps Framework’s Crawl, Walk, Run stages are a useful way to plan the path:
| Stage | What you measure | What you need | Who uses it |
|---|---|---|---|
| Crawl | Blended cost per customer and hosting % of revenue, monthly | Invoice, customer count, MRR; production split from non-production | CFO, CTO |
| Walk | Cost per customer by pricing tier, with shared costs allocated by a usage driver | Tenant and tier tags, Cost Categories, split cost allocation for ECS/EKS, CUR in Athena | Finance, product, engineering leads |
| Run | Unit cost per feature or unit of work, tracked against targets | Usage telemetry joined with cost data, alerts on unit-cost swings, cost checks in design reviews | Every engineering team; showback or chargeback |
At the Run stage, you also decide between showback and chargeback. Showback means teams see the unit costs they generate. Chargeback means those costs land in their budgets. Most SaaS companies under a few hundred engineers do well with showback, because it changes behavior without adding internal billing overhead.
When is AWS cost optimization consulting worth it?
Plenty of teams reach the Crawl stage on their own in a week. Outside help pays off when:
- hosting is above 7–8% of revenue and the team can’t name the cause;
- one service, usually the database, takes more than half of the cost per customer;
- the fix needs a migration or redesign you can’t risk getting wrong in production;
- you need defensible cost-per-customer figures by tier for pricing, fundraising or a board;
- engineers are fully booked on product work and cost work keeps slipping.
A good engagement starts read-only, gives you numbers before recommendations, and puts every change into infrastructure as code so the savings hold. Our overview of a cloud cost optimization engagement covers the process. If a workload needs to move, our cloud migration services team handles the cutover.
Know your cost per customer. Then bring it down.
We build your cloud unit economics, from tagging and allocation to cost per customer by tier. Then we fix what’s driving it, without putting production at risk. That covers everything from Savings Plans to a full database redesign or migration.