Client Overview
Our client is a leading entertainment software platform that operates globally, leveraging AWS to manage its extensive infrastructure and high traffic. The platform supports real-time audio and media streaming, so scalability, cost-efficiency, and performance optimization were critical components of its success.
Previously, Gart Solutions optimized AWS infrastructure and implemented automation solutions. As our customers experienced significant growth and operations expansion, the need to maintain optimal infrastructure performance and costs became clear.
Challenges
Initially, the client relied on AWS CloudWatch for infrastructure monitoring. However, as the system grew more complex, several limitations became evident:
- Difficulty in Monitoring Complex Infrastructure: The expanding infrastructure requires real-time monitoring of multiple services, applications, and costs. While AWS CloudWatch was effective for basic monitoring, it lacked the customization necessary for the client’s increasingly complex needs.
- Unclear Billing Information: AWS’s billing structure can be opaque, and the client found it challenging to track costs across different services. This made it harder to optimize resource usage and manage expenses efficiently.
- Developer Debugging Limitations: The native AWS dashboards were not user-friendly for the development team, making debugging time-consuming and difficult. A more intuitive solution was needed to allow quick identification and resolution of issues.
- Refactoring Existing Solutions: When we initially began working with the client’s existing monitoring setup, significant refactoring was required. As new infrastructure features were added, a centralized system that could monitor infrastructure performance, application metrics, and associated costs was needed.
Solution
To address these challenges, Gart Solutions implemented a centralized monitoring solution that combined Grafana with AWS CloudWatch. This hybrid approach offered the best of both worlds, using CloudWatch for comprehensive data collection and Grafana for flexible, user-friendly visualizations.
- Grafana Integration for Custom Monitoring: Grafana was selected as the primary visualization tool due to its flexibility and ease of use. Its intuitive interface allowed both technical and non-technical users to track metrics in real-time, streamlining the monitoring process.

- AWS CloudWatch for Data Collection: AWS CloudWatch continued to serve as the data source, collecting metrics from various AWS services. This provided comprehensive insights into resource utilization, system performance, and event logs.
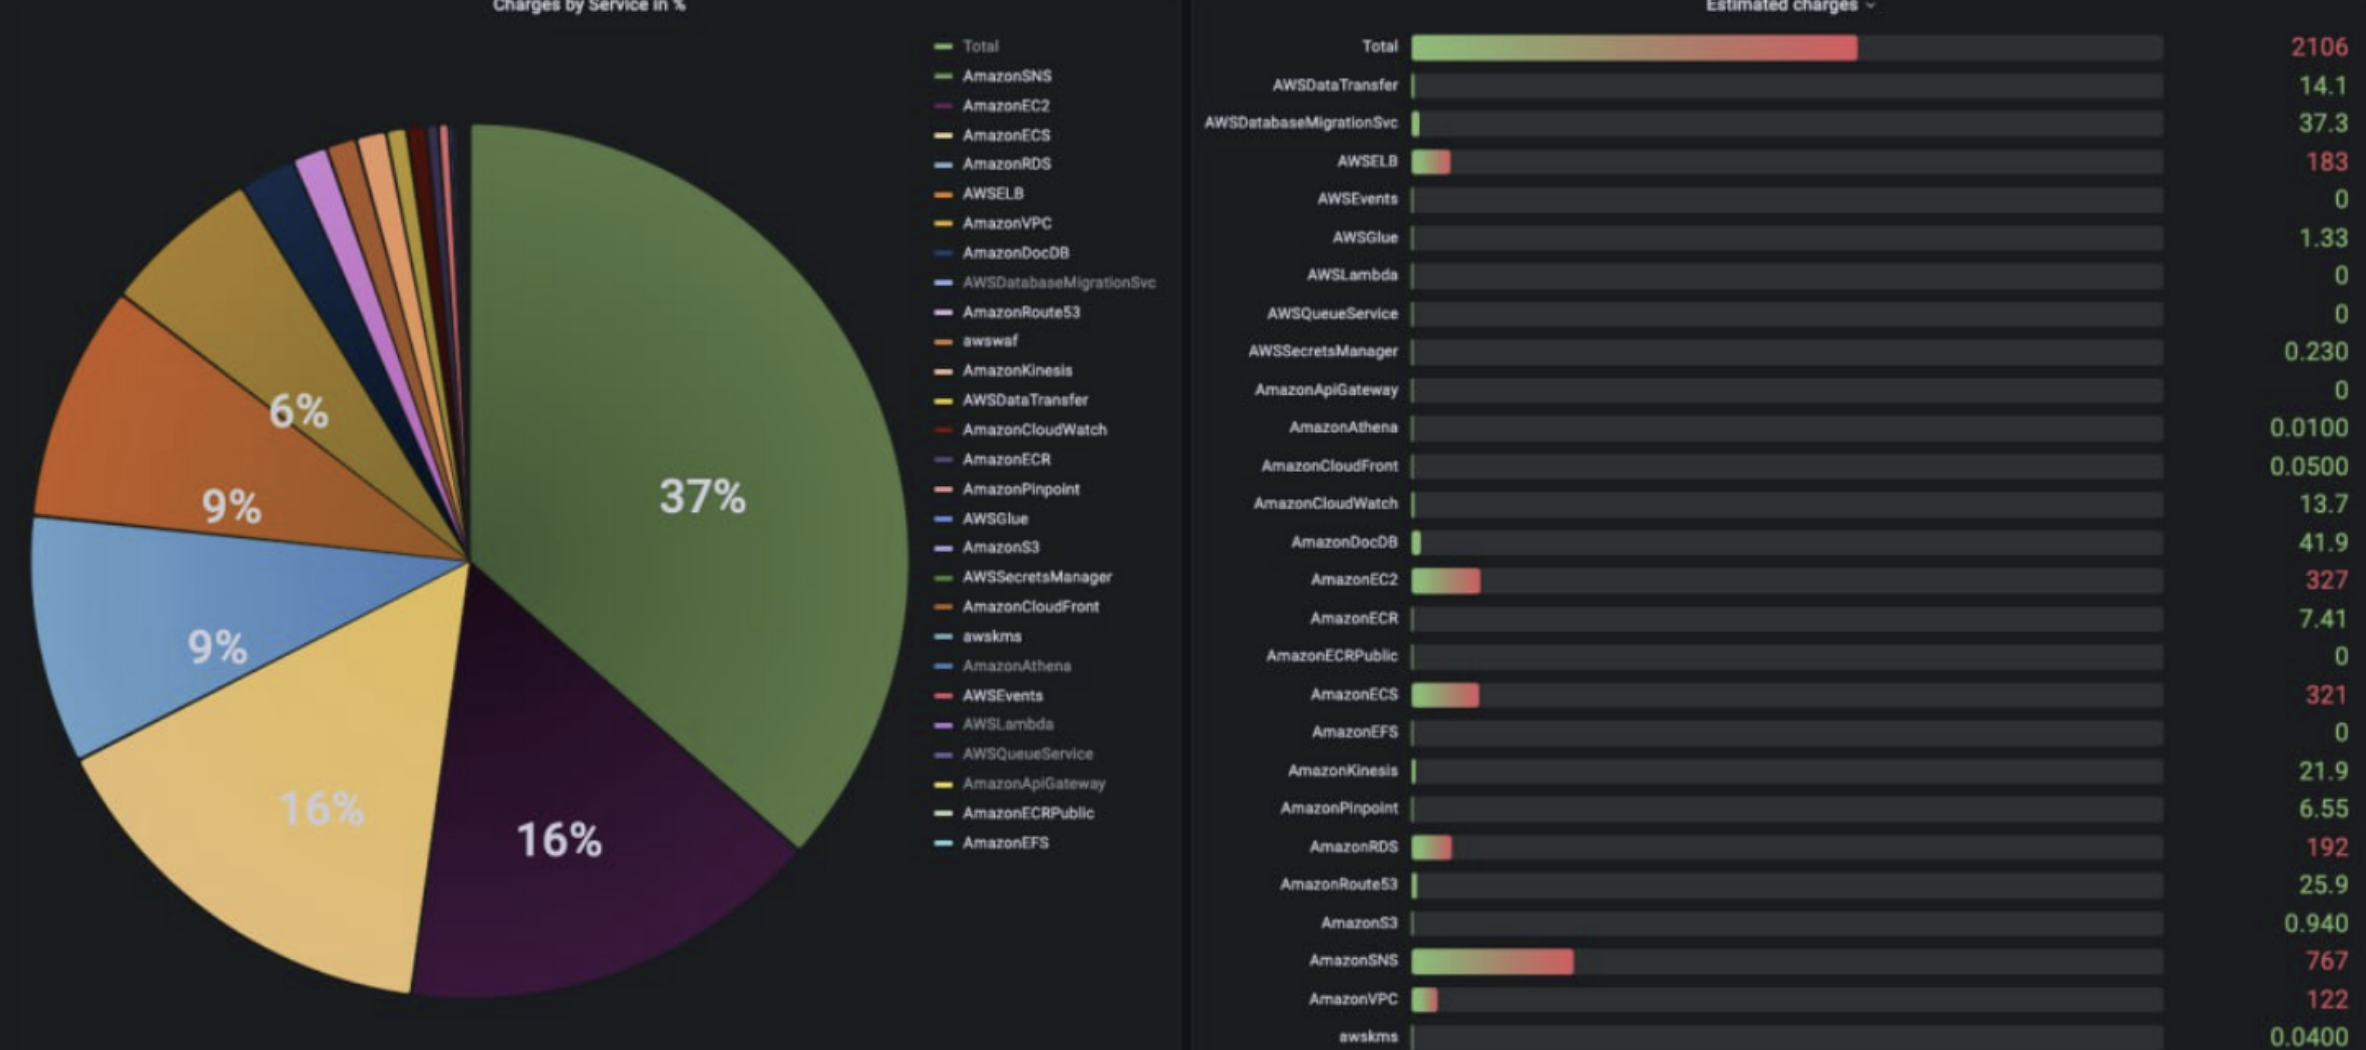
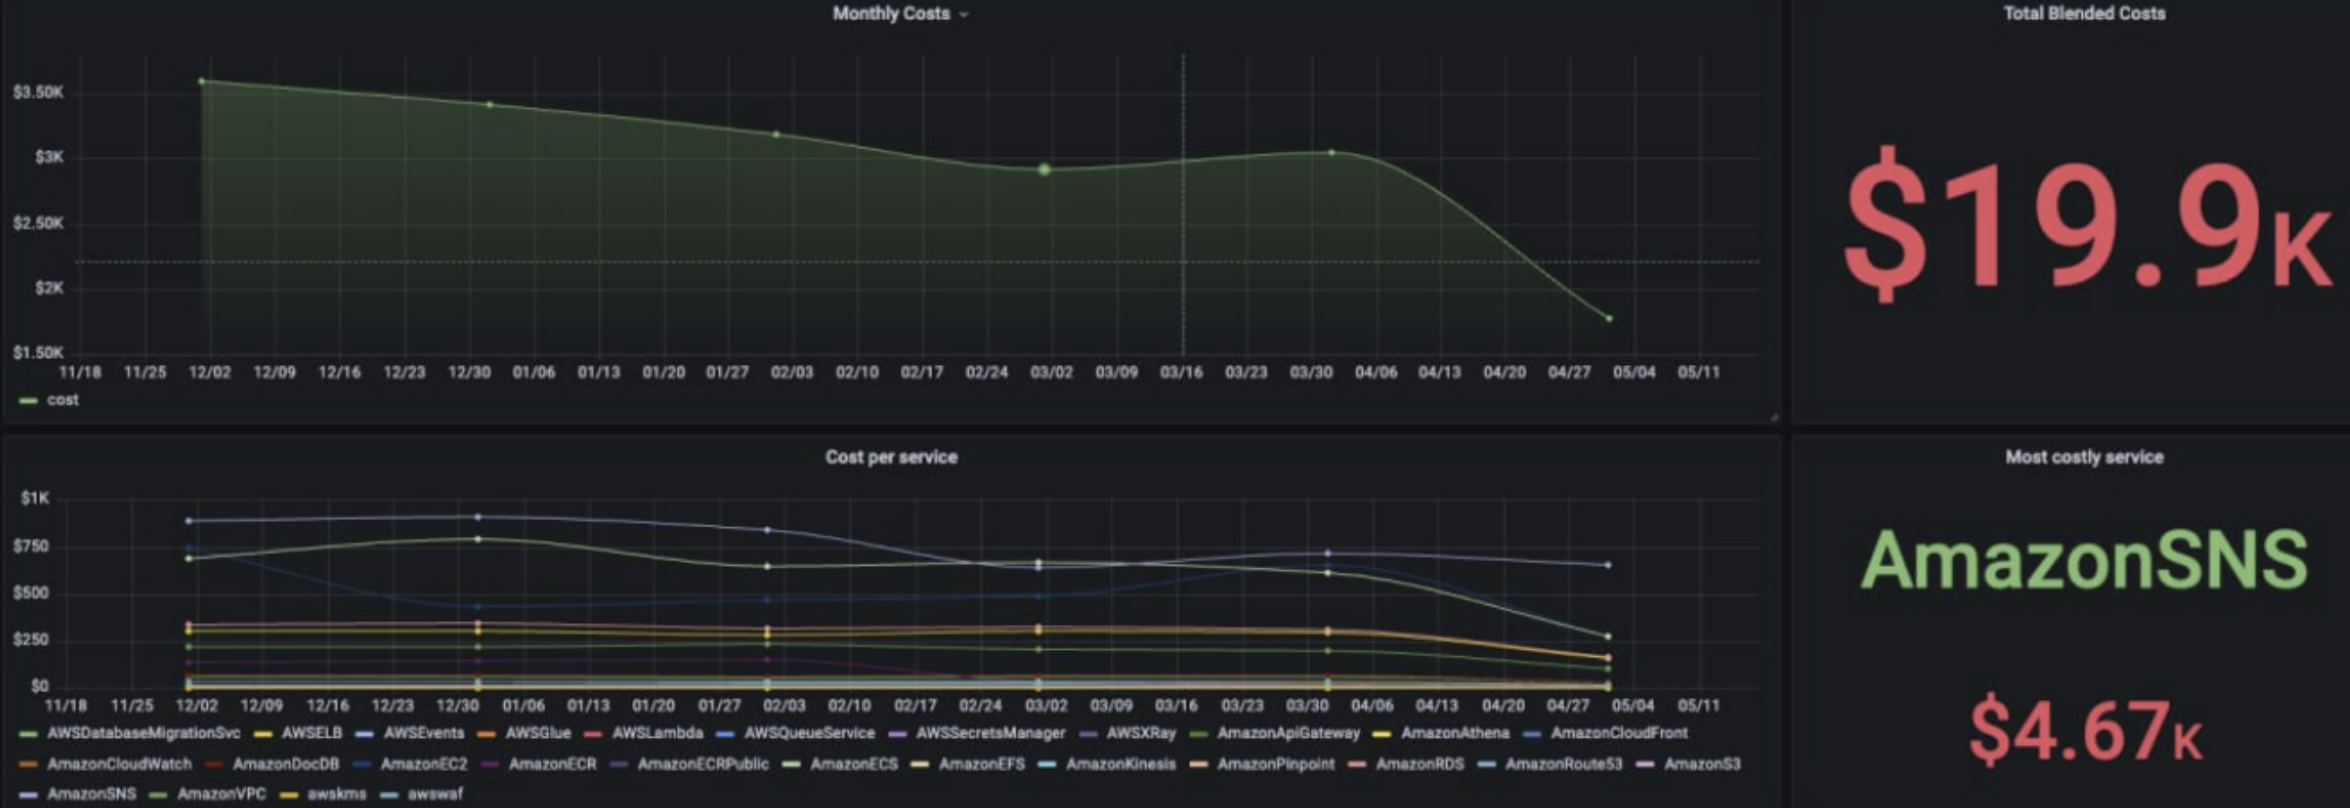
- Centralized Dashboards and Cost Monitoring: By integrating CloudWatch data into Grafana, we developed custom dashboards that provided clear, real-time cost monitoring, broken down by individual services. This enabled the client to track how resources were being used and make informed decisions to optimize cloud spending.

- Automated Alerts and Log Monitoring: We set up automated alerts for key performance indicators (KPIs) across both infrastructure and application layers, ensuring proactive monitoring. Additionally, log monitoring for each service was integrated into the dashboards, enabling developers to search, analyze, and debug issues more efficiently.
- Refactoring and Infrastructure Scaling: The monitoring system was designed to scale with the client’s evolving infrastructure. As new services and features were added, they were seamlessly integrated into the existing monitoring setup, maintaining continuous visibility into performance and costs.
Why Grafana Over AWS Dashboards?
Although AWS CloudWatch offers robust infrastructure monitoring features, Grafana was chosen for several reasons:
- User-Friendliness: Grafana’s intuitive interface allowed the client’s team to easily access and interpret monitoring data without requiring extensive AWS expertise.
- Customization: Grafana’s dashboards were highly customizable, enabling the creation of tailored views for different teams. This was particularly important for the development team, who needed custom dashboards for troubleshooting.
- Cost Transparency: Grafana provided greater control over how cost data was displayed, making it easier to identify inefficiencies, whereas AWS’s built-in dashboards often resulted in unclear billing metrics.
- Free and Open Source: Grafana’s open-source nature meant there were no additional licensing costs, aligning with the client’s cost-effectiveness goals.


