Short answer
Cloud unit economics measures what your cloud spend buys, per unit of business value. For most SaaS companies, that unit is a customer. To calculate cost per customer, take your production cloud cost (amortized, credits excluded), add each tenant's direct costs to a fair share of shared costs, and divide by active paying customers. Then compare the result with revenue per customer. The median private B2B SaaS company spends 5% of ARR on hosting. If you're well above that, the calculation shows you where the money goes.
Most SaaS teams can tell you their AWS bill to the dollar. Far fewer can tell you what it costs to serve one customer, or which pricing tier is quietly losing money on infrastructure. That second number is what cloud unit economics gives you. It's also what turns "the bill went up 30%" from bad news into a question you can answer: did customers grow faster than that, or not?
This guide shows how to calculate cost per customer step by step. It includes a worked example by pricing tier, benchmarks to judge the result against, and a calculator for your own numbers. It's based on the work our AWS cost optimization consulting team does with SaaS clients, including two projects where unit costs fell by roughly 80%.
5%
median hosting spend as a share of ARR at private B2B SaaS companies
SaaS Capital, 2026 survey
~50%
of cost of revenue went to committed cloud spend at public software companies
a16z, 2021 analysis
~78%
lower monthly infrastructure run-rate for FluentU
Gart case study
~80%
lower cost per video hour for Jewelry AI's vision pipeline
Gart case study
How to read the numbers in this article
Survey benchmarks come from SaaS Capital's 2026 survey of more than 1,000 private B2B SaaS companies and from a16z's 2021 analysis of public software companies. Both links are in the text.
The worked example uses a hypothetical company so that every step can be shown. Its numbers are illustrative.
Benchmark bands (under 3%, 3–7%, 7–12%, over 12%) are our own interpretation, built around the survey median. Gart results come from client billing data, as published on our case study pages. Last checked: October 2026.
In this article
What is cloud unit economics?
How to calculate cost per customer
Worked example
Benchmarks
Calculator
FluentU case
Jewelry AI case
Reduce your AWS bill
Maturity model
What is cloud unit economics?
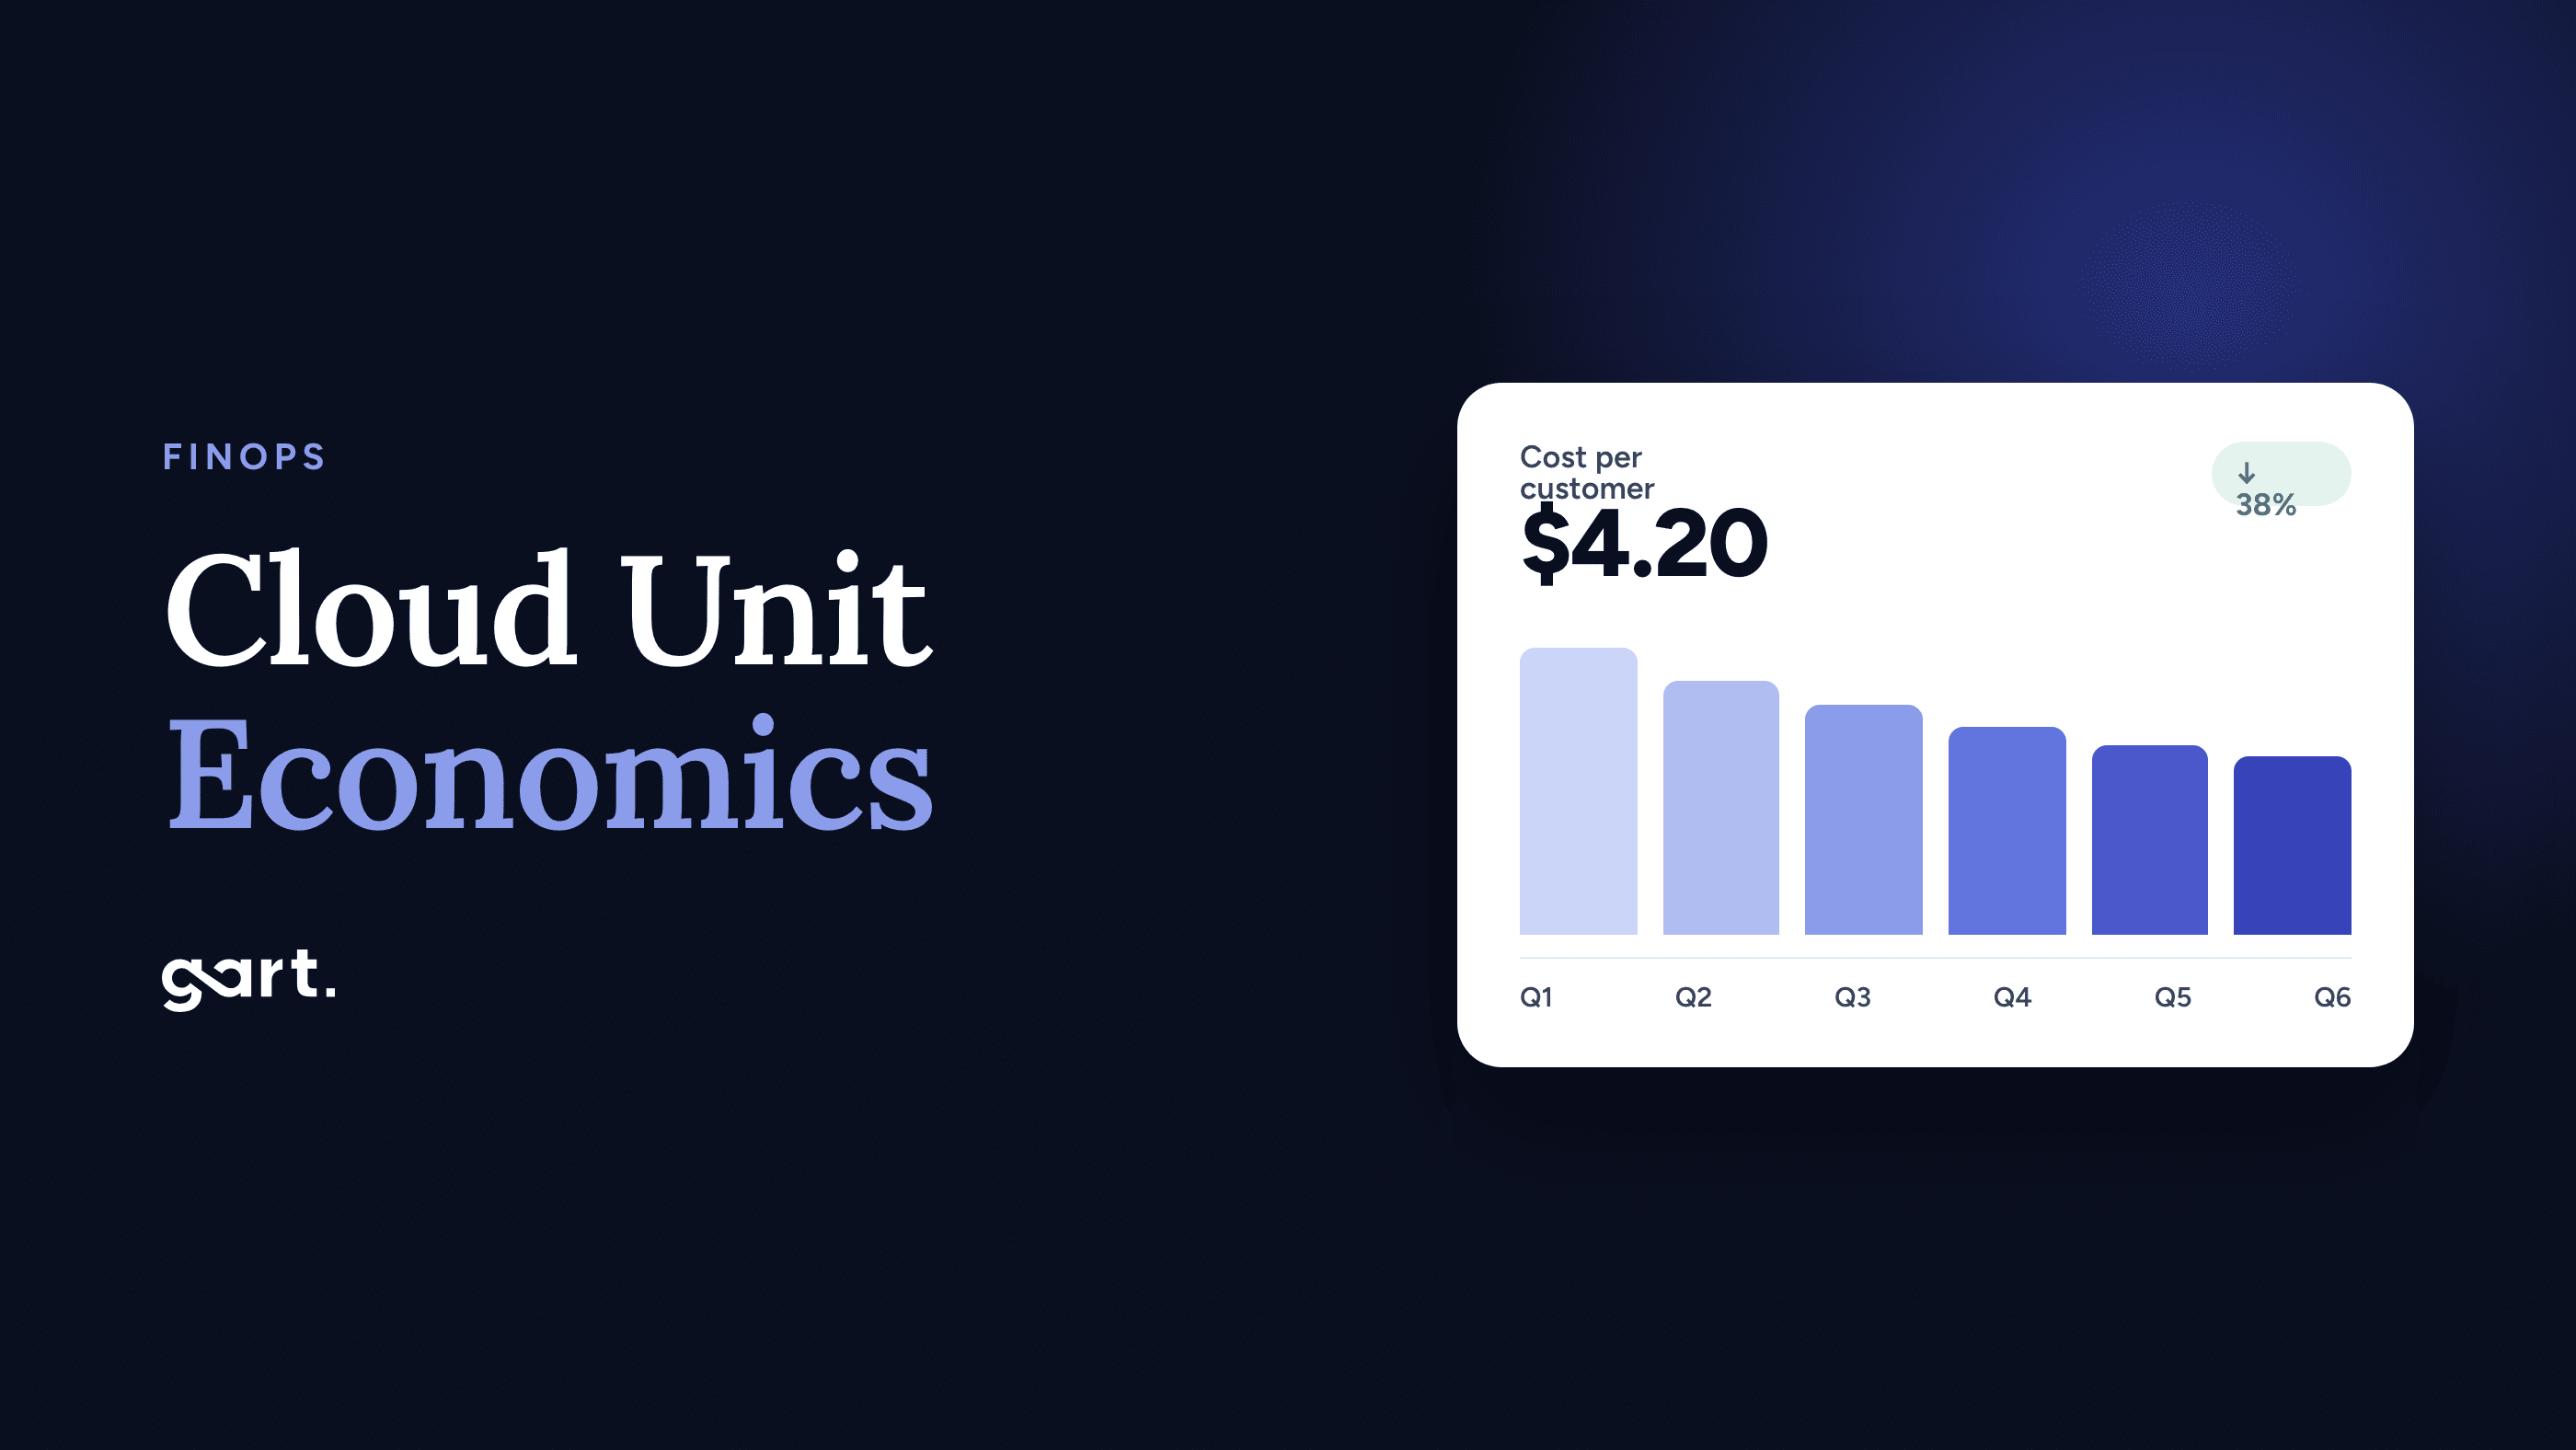
Cloud unit economics links cloud spend to the business output it produces. Instead of reporting "we spent $24,000 on AWS this month", you report "it cost $4.20 to serve a customer, against $170 of revenue from that customer". The FinOps Foundation treats this as a core capability. In its framework, unit economics is how organizations connect technology spend to the value of what they deliver.
Cost per customer = (direct costs + allocated shared costs) ÷ active paying customers
Unit margin = revenue per customer − cost per customer · Hosting % = cloud cost ÷ revenue
The total bill can't tell you whether you're getting more efficient, because it grows whenever the business grows. A unit cost can. If spend rises 30% and customers rise 60%, efficiency improved. If customers are flat and cost per customer keeps rising, something in the architecture is scaling the wrong way. That's usually an oversized database, logs with no retention, or a non-production estate as large as production.
Cost per customer is the right starting unit for most SaaS businesses. But if your customers vary a lot in size, add a unit of work next to it:
SaaS profileUsual top cost driver on AWSBest unit metricFirst lever
B2B workflow / CRUD appRDS or Aurora, often Multi-AZ with Provisioned IOPSCost per customerDatabase rightsizing, gp3 storage, Reserved Instances
Content and EdTech platformsDatabase plus storage and CDNCost per active learner or userData lifecycle, CDN caching, database design
Data and analytics SaaSPipeline compute, warehouse queries, S3Cost per GB processedSpot for batch, storage tiers, query tuning
Video and AI visionGPU or CPU compute for processingCost per video hour or per inferenceSpot capacity, batch scheduling, right GPU class
Multi-tenant on KubernetesNode overprovisioning, NAT and data transferCost per tenant (namespace)Bin-packing, autoscaling, VPC endpoints
How to calculate cost per customer in 6 steps
You can get a rough number from last month's invoice in five minutes: bill divided by customers. It's a useful first benchmark, but a poor basis for decisions, as the worked example below shows. These six steps turn it into a number you can price and plan with.
Step 1
Choose the right cost basis
The same bill can produce four different unit costs, depending on which view of it you use. Pick one basis and keep it consistent month to month:
ItemRecommendationWhy
Savings Plans and Reserved InstancesUse net amortized cost in Cost Explorer or the CURUnblended cost puts upfront fees into a single month, which makes your unit cost jump and then collapse.
Promotional creditsExclude themCredits expire. If your unit cost only looks healthy because of credits, the problem shows up later.
Support planInclude as a shared costBusiness or Enterprise Support scales with spend, so it's a real cost to serve.
Marketplace softwareInclude if the product depends on itA third-party database or security tool billed through AWS is part of what it costs to serve customers.
TaxExcludeKeeps comparisons clean across regions and entities.
Step 2
Separate production from non-production
Development, staging, CI and demo environments are an engineering cost, not a cost to serve. Keep them out of the production unit cost, and track them as their own ratio (non-production as a share of the total). Separate AWS accounts under AWS Organizations give you the cleanest split. If you can't use separate accounts, enforce an environment tag in Terraform. On bills that have never been split, non-production is often a bigger share than the team expects.
Step 3
Split direct costs from shared costs
A direct cost belongs to one tenant or one pricing tier, such as a dedicated database for an enterprise customer or a tenant-specific S3 bucket. Tag these with tenant_id or customer_tier and activate those tags as cost allocation tags. Everything else is shared: the main database, load balancers, observability, NAT gateways, support.
Shared Kubernetes and ECS clusters used to be a blind spot. On AWS, you can turn on split cost allocation data, which divides each instance's cost across the pods or tasks that ran on it, based on CPU and memory use. If you run one namespace per tenant, that makes container costs directly attributable.
Step 4
Allocate shared costs with a usage driver
Divide the shared pool in proportion to a driver that reflects actual consumption:
Tenant's shared cost = (tenant's driver usage ÷ total driver usage) × shared cost pool
Good drivers: API requests, compute seconds, GB stored, GB transferred. Weak drivers: seat count, revenue share.
Avoid allocating by revenue. It makes every customer look equally profitable, which is exactly what this exercise is meant to test. If one driver doesn't fit everything, split the pool: allocate database costs by queries or storage, and network costs by GB transferred. AWS Cost Categories can apply these split rules automatically.
Step 5
Divide by the right customer count
Use active paying customers in the same month as the cost data. Treat free-tier users as an acquisition cost: put their share of the infrastructure under marketing, or report "cost per free user" separately. Don't fold them into the paying-customer denominator. For usage-heavy products, divide the same cost pool by your unit of work as well, such as video hours or GB processed.
Step 6
Compare against revenue, and track it monthly
A unit cost only means something next to unit revenue. Calculate the margin per customer and hosting as a percentage of revenue, by pricing tier. Then put it on a monthly dashboard: query the Cost and Usage Report in Athena, join it with MRR and customer counts from your billing system, and alert on any month-over-month swing above about 15%. We describe how we run this rhythm with clients in our FinOps cloud cost management experience.
Worked example: cost per customer by pricing tier
Here's the full calculation for a hypothetical B2B SaaS company with three pricing tiers, 1,520 paying customers and $258,500 MRR. Its net amortized AWS bill is $24,000 a month. Non-production is $4,000, which leaves $20,000 in production. Of that, $8,000 is direct (dedicated databases and storage for Growth and Enterprise tenants) and $12,000 is shared, allocated by API request volume.
From total bill to cost per customer
Total bill
$24,000
Non-prod $4,000
Direct (tagged)
$8,000
Shared, by API calls
$12,000
Starter · 1,200 customers · $3,000
$2.50 per customer · 5.1% of revenue
Growth · 300 customers · $7,400
$24.67 per customer · 6.2% of revenue
Enterprise · 20 customers · $9,600
$480 per customer · 12.0% of revenue
Hypothetical example. Production cost $20,000 = $8,000 direct + $12,000 shared.
How the $24,000 bill flows down to cost per customer for each tier.
TierCustomers × priceDirectShared (API share)Total costCost per customer% of revenue
Starter1,200 × $49$0$3,000 (25%)$3,000$2.505.1%
Growth300 × $399$2,000$5,400 (45%)$7,400$24.676.2%
Enterprise20 × $4,000$6,000$3,600 (30%)$9,600$480.0012.0%
Total1,520 · $258,500 MRR$8,000$12,000$20,000$13.16 (blended)7.7%
Three things stand out, and none of them is visible from the total bill:
The naive number misleads. $24,000 ÷ 1,520 = $15.79 per customer. That's six times what a Starter customer actually costs, and a thirtieth of what an Enterprise customer costs. Any pricing decision based on it would be wrong for every tier.
The average hides the problem tier. Blended hosting is 7.7% of revenue in production (9.3% fully loaded), just above the median. But Enterprise sits at 12%, because its dedicated databases were sized for peak load and never reviewed. That's where the optimization work belongs. Starter, at 5.1%, is fine.
It changes the commercial conversation. With $480 a month in infrastructure per Enterprise customer, the company knows its floor price for discounts and can make dedicated infrastructure a paid add-on instead of a free default.
Cloud unit economics benchmarks for SaaS
There's no universal "good" cost per customer. A $20-a-month SMB tool and a $50,000-a-year enterprise platform will never have similar figures. What does carry across companies is the ratio of cloud spend to revenue. SaaS Capital's 2026 spending benchmarks for private B2B SaaS companies survey more than 1,000 companies and put median hosting at 5% of ARR, unchanged from the year before, with a further 4% for DevOps.
At scale, cloud becomes the largest item in COGS. In The Cost of Cloud, a Trillion Dollar Paradox, a16z estimated that committed cloud spend was about 50% of cost of revenue at public software companies that disclose it. That's 2021 data, but the conclusion still holds: every point of hosting spend is a point of gross margin.
Hosting as % of revenueWhat it usually meansWhat to do next
Under 3%Lean. Either the product is light, or FinOps is already mature.Protect it: budgets, anomaly alerts, monthly unit-cost review.
3–7%Around the median for B2B SaaS.Hygiene and commitment coverage. Expect 10–25% savings, not a redesign.
7–12%Above median. Common after fast growth, or with a database-heavy design.Find the one or two services driving the cost. Rightsizing plus Savings Plans or Spot usually closes most of the gap.
Over 12%A structural issue is likely, unless the product is video, AI or data processing at its core.Architecture review: database design, managed-service premiums, where workloads run.
The bands are Gart's interpretation, built around the SaaS Capital median. They are not survey results. Apply them per pricing tier as well as to the blended number.
Cost per customer calculator
Enter four numbers from last month's bill and your billing system. The calculator shows your cost per customer and hosting ratio against the 5% median. It then estimates what each type of fix would save, using savings rates from real Gart projects. For a per-tier view, run it once for each tier, using that tier's allocated cost.
Calculate your cost per customer
Everything is calculated in your browser. Nothing is sent anywhere.
Monthly cloud bill (USD)
Net amortized, credits excluded
Non-production share (%)
Staging, dev, CI, demo environments
Paying customers
Active accounts billed this month
Monthly recurring revenue (USD)
MRR, or ARR ÷ 12
Cost per customer–fully loaded, per month
Production only–per customer, per month
Hosting % of revenue–median B2B SaaS: 5%
Gap to median–per year
Enter your numbers to see where you stand.
What could each type of fix save?
Main lever
Hygiene and containerization (~12%, Entertainment SaaS case)
Commitments + Spot (~25%, Datamaran case)
Database and architecture redesign (~50%, estimate)
Structural fix incl. migration (~78%, FluentU case)
Custom percentage
Custom reduction (%)
New monthly bill–
New cost per customer–
New hosting %–
Annual savings––
Case percentages are what those specific clients achieved, not a promise for your bill. The 50% option is an illustrative middle scenario, not a case result. Savings from different levers don't simply add up, because each one applies to a smaller remaining bill.
Want your unit economics calculated for you?
Our engineers review your Cost Explorer and CUR data with read-only access. You get cost per customer by tier and the services driving it.
Request a cost review
Case 1 · EdTech SaaS
FluentU: how fixing the database cut cost per customer by about 78%
FluentU is a language-learning platform that teaches through authentic video content. It runs a web app, native mobile apps, a Chrome extension, a WordPress blog and a set of scheduled workers. After years of growth, its AWS footprint included multiple app servers behind load balancers, several RDS databases (main platform, blog and demo), ElastiCache, CloudFront, S3, NFS shares and SQS.
Verified Cost Explorer data put the baseline at $9,318.15 a month. The service breakdown was the real finding. RDS alone cost $6,071.87, or 65.16% of the bill. The main Multi-AZ database class accounted for $2,035.58, Provisioned IOPS for $1,400, a second Multi-AZ class for $1,100.73 and PIOPS storage for $625. In unit-economics terms, two-thirds of the cost of serving every learner was a database configuration. Rightsizing a few EC2 instances would never have fixed that.
StageMonthly run-rateChange in cost per customer*
AWS baseline$9,318–
First month after cutover (AWS only, cleanup in progress)$4,690−49.7% on AWS
Combined run-rate: optimized Hetzner (~$1,429) + AWS backups ($600–630)$2,029–2,059~−78%
After AWS backup retention expires$1,599–1,619~−83%
*With the same customer base, cost per customer falls by the same percentage as the run-rate. FluentU's customer count isn't public, so no dollar figure per customer is shown. Source: FluentU case study, AWS Cost Explorer and Hetzner billing. Annualized savings: about $87,100–87,500.
FluentU: monthly infrastructure spend (USD)
AWS baseline
RDS $6,072 (65%)
Other $3,246
$9,318
Combined today
~$2,044 (Hetzner ~$1,429 + AWS backups ~$615) −78%
After retention
~$1,609 −83%
Primary hosting
Remaining AWS (backups, legacy)
Source: Gart Solutions FluentU case study. "Combined today" uses the midpoint of $2,029–2,059.
The savings didn't come from one switch. Over six months, the team designed the target environment, rebuilt it after schema validation found 1,179 missing indexes across 1,474 tables, and ran AWS DMS with change data capture. They aborted the first cutover when CDC latency rose, then succeeded on the retry. After cutover, Hetzner itself was trimmed by another ~$601 a month (29.6%) through app, cron and cache rightsizing, plus orphan cleanup. Moving off AWS was right for this workload. It isn't right for everyone, and our Hetzner vs AWS comparison covers the trade-offs.
Unit-economics signal from this case: if one AWS service makes up more than half of your cost per customer, start with an architecture review, not a tactics checklist. In our experience, that service is usually the database.
Case 2 · AI vision
Jewelry AI: unit economics for AI workloads, measured per video hour
A Thai jewelry manufacturer wanted AI to analyze worker activity across 200–250 workstations, so it could find production bottlenecks. Each workstation records about 9 hours a day. That's around 1,800 hours and 2 TB of video every day, processed overnight with feature extraction and classification.
This project ran on Azure, not AWS. We include it because the cost lesson carries straight over to AWS. The first design, based on a network video recorder setup and on-demand pricing, was estimated at $5,363 a month. Our team redesigned the processing layer around Azure Spot VMs in scale sets, with pipelines built to absorb interruptions. On AWS, the same pattern is EC2 Spot in an Auto Scaling group, or AWS Batch on Spot. The estimated total fell to $1,100 a month, and the compute layer alone went from $4,700 to $430. The case reports that Spot interruptions had zero impact on the video processing workflows.
There's one customer here, so cost per customer tells you nothing. The useful metric is cost per unit of work:
Unit metricOn-demand designSpot designChange
Total per month$5,363$1,100−$4,263
Per workstation per month (200)$26.82$5.50−79.5%
Per video hour (~54,000 a month)~$0.099~$0.020−79.5%
Compute layer only$4,700$430−90.9%
Source: Jewelry AI Vision case study. Per-unit figures are our arithmetic: 200 workstations × 9 hours × 30 days. The case headline cites 81%; the published monthly figures give 79.5%.
For any SaaS company shipping AI or video features, the lesson is to calculate the unit cost while the architecture is still on paper. A per-video-hour cost of $0.099 versus $0.020 decides whether a feature is profitable at your planned price. That's much easier to fix before launch than after the bill arrives. The same applies to GPU and node costs on Kubernetes, where idle capacity hides easily.
How to reduce your AWS bill once you know your unit cost
Once you know your band, and which tier or service is pushing it up, the order of work is fairly predictable. This is how we sequence it in engagements:
Your bandWeeks 1–2Weeks 3–6Typical outcome
3–7%Orphaned resources, log retention, gp2 to gp3, scheduling non-productionSavings Plans and Reserved Instances on the cleaned-up baseline10–25% lower bill; cost per customer flat as you grow
7–12%Spend by service and by tier, top-two cost drivers, tag coverageDatabase and compute rightsizing, Spot for stateless and batch work, VPC endpoints25–40% lower; Datamaran reached 25% with Savings Plans plus Spot
Over 12%Architecture review: data model, managed-service premiums, data transferRedesign the dominant workload, or move it where it's cheaper to run50%+ is possible; FluentU reached ~78%
For individual tactics, with risks and validation steps for each, see our guide to lowering your AWS bill. For the strategic view, read AWS cost optimization strategies and best practices. If the waste is spread thinly across many services, the common cloud cost traps make a good checklist.
From crawl to run: maturing your cloud unit economics
Nobody gets to exact per-tenant costs in one sprint. The FinOps Framework's Crawl, Walk, Run stages are a useful way to plan the path:
StageWhat you measureWhat you needWho uses it
CrawlBlended cost per customer and hosting % of revenue, monthlyInvoice, customer count, MRR; production split from non-productionCFO, CTO
WalkCost per customer by pricing tier, with shared costs allocated by a usage driverTenant and tier tags, Cost Categories, split cost allocation for ECS/EKS, CUR in AthenaFinance, product, engineering leads
RunUnit cost per feature or unit of work, tracked against targetsUsage telemetry joined with cost data, alerts on unit-cost swings, cost checks in design reviewsEvery engineering team; showback or chargeback
At the Run stage, you also decide between showback and chargeback. Showback means teams see the unit costs they generate. Chargeback means those costs land in their budgets. Most SaaS companies under a few hundred engineers do well with showback, because it changes behavior without adding internal billing overhead.
When is AWS cost optimization consulting worth it?
Plenty of teams reach the Crawl stage on their own in a week. Outside help pays off when:
hosting is above 7–8% of revenue and the team can't name the cause;
one service, usually the database, takes more than half of the cost per customer;
the fix needs a migration or redesign you can't risk getting wrong in production;
you need defensible cost-per-customer figures by tier for pricing, fundraising or a board;
engineers are fully booked on product work and cost work keeps slipping.
A good engagement starts read-only, gives you numbers before recommendations, and puts every change into infrastructure as code so the savings hold. Our overview of a cloud cost optimization engagement covers the process. If a workload needs to move, our cloud migration services team handles the cutover.
Gart Solutions · Cloud consulting
Know your cost per customer. Then bring it down.
We build your cloud unit economics, from tagging and allocation to cost per customer by tier. Then we fix what's driving it, without putting production at risk. That covers everything from Savings Plans to a full database redesign or migration.
~78%lower run-rate for FluentU
$4,263saved per month for Jewelry AI
25%lower monthly AWS costs for Datamaran
Unit cost baselineCost per customer and per tier from your Cost and Usage Report
Tagging and allocationTenant tags, Cost Categories, ECS/EKS split cost allocation
Architecture fixesDatabase redesign, Spot-ready pipelines, Kubernetes bin-packing
Migration if it paysAWS, Azure, GCP or Hetzner, with tested cutover and rollback
Explore cloud consulting
Talk to an engineer →
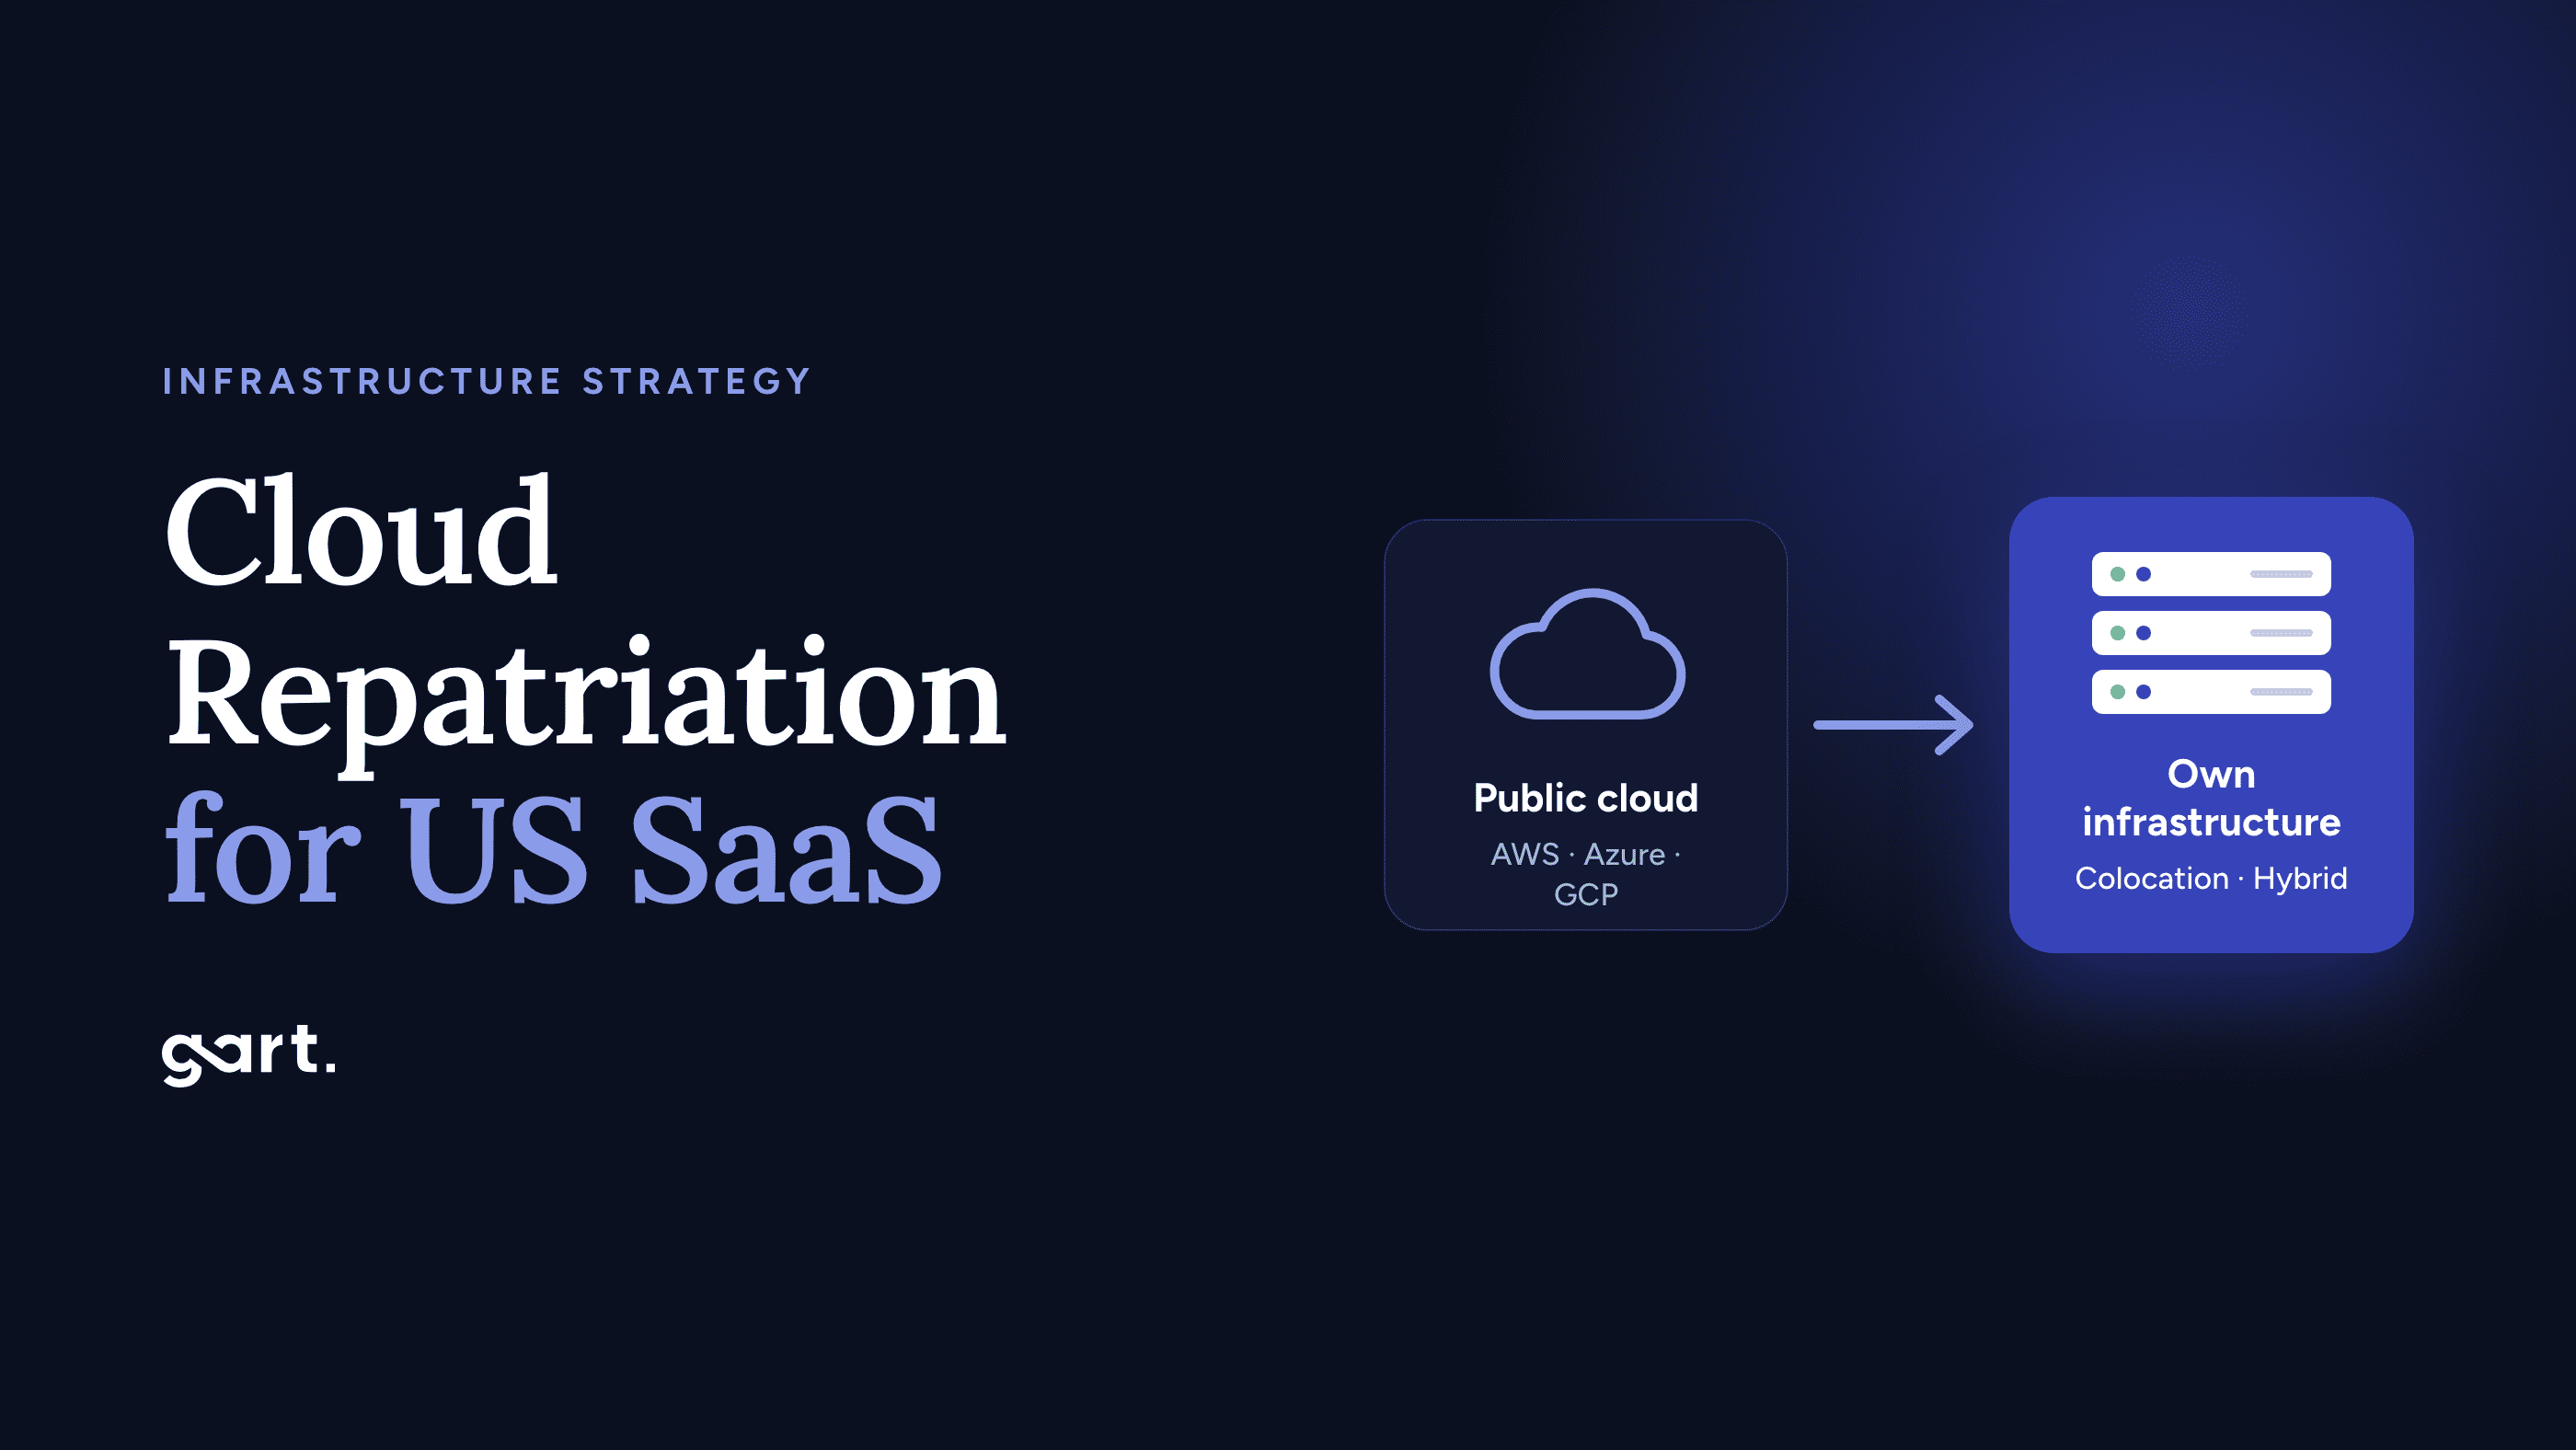
Most US SaaS teams that ask "should we leave AWS?" are really asking three smaller questions: is our bill high for structural reasons or just untidy, can our product live without the AWS services we depend on, and where would we actually go. This guide answers those questions with three real cloud repatriation cases, a weighted decision matrix you can score in 20 minutes, and an honest look at AWS to Hetzner economics after Hetzner's 2026 price increases.
If you need the background on why repatriation is happening at all, start with our explainer on cloud repatriation and the hidden cost of elasticity. This article is the next step: the decision for a US-based SaaS company.
Key takeaways
Leaving AWS pays off when spend is steady and concentrated in "premium" lines: managed databases, provisioned IOPS, egress, NAT. It rarely pays off for spiky, serverless-heavy products or bills under roughly $5K/month.
Real results vary widely by path. 37signals cut about $2M a year by moving compute to owned servers. Gart's US client FluentU reached a projected ~78% lower steady-state infrastructure cost moving from AWS to Hetzner.
Hetzner is not the same bargain it was in 2025. Its June 15, 2026 repricing raised CPX and CCX cloud lines by 113–175%. Dedicated servers and the CX/CAX lines are where the economics still hold.
US SaaS has extra constraints: Hetzner's US locations (Ashburn, Hillsboro) are cloud-only, with no dedicated servers or Object Storage, and Hetzner does not advertise SOC 2 reports or HIPAA BAAs.
Hybrid is the most common winning answer. Keep the edge, identity, and spiky services on AWS; move the steady core.
Why US SaaS repatriation is a different decision
Most cloud repatriation stories come from Europe, where data sovereignty and GDPR give teams a second reason to move. US SaaS companies usually have only one reason, gross margin, and several reasons to stay put:
Your customers are in North AmericaA server in Falkenstein or Helsinki adds a transatlantic round trip (typically around 80–100 ms to the US East Coast) to every uncached request. That is fine for async workloads and a problem for chatty APIs.
Your buyers send security questionnairesEnterprise procurement teams ask for SOC 2 Type II, and healthcare buyers ask for a HIPAA Business Associate Agreement. Your SOC 2 covers your controls, but you will need to explain your subprocessors, and AWS is the easy answer.
Your contracts may assume AWSSavings Plans, an Enterprise Discount Program, or AWS Marketplace co-sell revenue can make leaving expensive in ways your bill doesn't show.
Your team was hired for AWSRunning PostgreSQL replication, backups, and on-call for bare metal is a different skill set from clicking "Multi-AZ" in RDS.
None of these blocks repatriation. They change which version of it makes sense, and that is what the matrix below is for.
What changed in 2026
Two forces now pull in opposite directions.
Leaving AWS got cheaper: the egress waiver removed the "exit tax" that used to cost large data holders six figures (AWS waived roughly $250,000 in egress for 37signals alone).
Arriving at Hetzner got more expensive: after an across-the-board increase of roughly 30–37% on April 1, 2026, Hetzner repriced its cloud lines again on June 15, 2026, citing a "massive increase in procurement costs" for RAM, NVMe, and GPUs.
Hetzner cloud plan (DE/FI, €/month)Before June 15, 2026AfterChangeCCX23 (dedicated vCPU)31.4985.99+173%CCX33 (dedicated vCPU)62.49138.49+122%CPX42 (AMD shared)25.4969.49+173%CAX41 (ARM shared)31.4940.99+30%CX53 (Intel shared)22.4929.49+31%
What this means for an AWS to Hetzner business case: any model built before mid-2026 on CPX or CCX pricing is now wrong, often by more than 2x on compute. Existing instances keep their old price, but new orders and any resize pay the new rate. The economics still work, but they now depend on which Hetzner products you use. Dedicated root servers, ARM (CAX), and Intel shared (CX) lines carry much more of the savings than they did a year ago.
For US SaaS this matters twice over. Hetzner's US locations offer only its AMD shared and AMD dedicated-vCPU cloud types, which are the CPX and CCX families hit hardest in June. Hetzner prices its US locations separately from Europe, so check the current US price list before modeling a US-hosted footprint.
Three cloud repatriation cases, and what each one proves
Each case below took a different path, and each one teaches a different lesson.
Three cloud repatriation cases, and what each one proves
Each case below took a different path, and each one teaches a different lesson.
US SaaS · AWS → owned hardware in colocation
Case 1: 37signals (Basecamp, HEY), the large-scale full exit
Starting point: an AWS bill of more than $3.2M per year, including 18 PB in S3.
What they did: they bought about $700K of Dell servers for compute and moved off AWS compute first, which saved about $2M per year. They then spent $1.5M on Pure Storage arrays (operating cost under $200K per year) to bring the 18 PB home, with a further expected saving of about $1.3M per year. AWS waived about $250K in egress fees, and the company says it needed no extra staff.
What it proves: at multi-million-dollar scale with a steady, predictable workload, owning hardware beats renting it by a wide margin. What it doesn't prove: that a $40K/month SaaS can copy the playbook. 37signals had a seasoned ops team and a product built on a simple, portable Rails stack.
US public SaaS · AWS S3 → custom storage
Case 2: Dropbox, repatriating only the storage tier
Starting point: the bulk of user file storage on AWS S3.
What they did: built its own storage system, Magic Pocket, and moved most user data into its own data centers. Its 2018 S-1 filing attributed about $74.6M in savings over two years to this infrastructure optimization.
What it proves: you don't have to move everything. Repatriating the single most expensive, most predictable tier captures most of the value. Dropbox kept a portion of its storage on AWS rather than forcing a total exit.
US mid-market SaaS · AWS → Hetzner · Gart Solutions client
Case 3: FluentU, an AWS to Hetzner move at the scale most SaaS teams operate
Starting point: FluentU, a Maryland-based language-learning platform (web app, mobile apps, Chrome extension, blog), ran on EC2, RDS, ElastiCache, CloudFront, S3, NFS, and SQS. The verified AWS baseline was $9,318.15/month, and 65% of it ($6,071.87) was RDS, driven by Multi-AZ instance classes and provisioned IOPS.
What we did: moved application servers, self-managed database servers, and shared NFS storage to Hetzner, defined in Terraform, with data replicated through AWS DMS change data capture. CloudFront stayed in place and was re-pointed at the Hetzner origin, so the move was hybrid by design.
What went wrong (and why it matters): the first live cutover was aborted because CDC latency kept rising and table diffs remained. A schema comparison across 1,474 tables found 1,464 column-metadata differences and 1,179 missing target indexes. We rebuilt the target and added a hard schema gate before the next attempt. Core production went live on Hetzner on July 3, 2026. The final content sync ran about 2.5 hours behind a maintenance page.
Result: a combined AWS + Hetzner steady state of about $2,029–$2,059/month, roughly 78% below baseline (about $87K saved per year), projected to reach about 83% once old backup retention expires.
What it proves: a sub-$10K/month US SaaS can repatriate profitably when the bill is dominated by a managed-database premium. It also proves that the database cutover, not the servers, is where these projects succeed or fail. Read the full FluentU AWS to Hetzner case study[cite: 1].
Not sure if your AWS bill is structural or just untidy?
Gart's Cloud Exit Assessment maps every AWS line item to one of three paths: optimize in place, move to a hybrid setup, or repatriate. You get a cost model built on current 2026 pricing, not last year's.
Get a cloud exit assessment
The pattern across all three: none of them moved because "cloud is expensive." Each one found a specific, steady, oversized line item (compute at scale, object storage, managed databases) and moved that first. That is the logic the decision matrix encodes.
The "leave AWS" decision matrix
Score your company from 1 to 5 on each of the eight criteria below. A 5 means the criterion points toward leaving AWS, and a 1 means it points toward staying. Multiply each score by its weight, add the results, and divide by 5 to get an index between 20 and 100.
#CriterionWeightScore 5: favors leaving AWSScore 1: favors staying1Steady-state AWS spend15Over $50K/month (3 = $10–30K)Under $5K/month: engineering time will eat the savings2Workload predictability15Baseline load within ~30% of peak, year-roundLarge seasonal or event spikes you rely on autoscaling for3"Premium" share of the bill15Over 50% in managed DBs, provisioned IOPS, egress, NAT GatewayMostly right-sized EC2 already on Savings Plans4Portability of your stack15Containers, PostgreSQL/MySQL, Redis, S3-compatible APIsDeep use of Lambda, DynamoDB, Kinesis, Cognito, Step Functions5Compliance fit10SOC 2 on your own controls; no HIPAA, FedRAMP, or AWS-specific contract termsHIPAA BAA, FedRAMP, or enterprise contracts that name AWS6Latency and geography10Async or batch-heavy, CDN-cacheable, or customers outside North AmericaReal-time, chatty APIs serving US users with tight latency SLAs7Ops capability10In-house Linux, DB, and on-call skills, or a managed partnerNo one owns backups, patching, or 3 a.m. incidents today8Commitment exposure10Savings Plans or EDP expiring within 6–12 months; no Marketplace co-sellMulti-year EDP, fresh Savings Plans, or meaningful AWS Marketplace revenue
How to read your result:
Worked example (hypothetical): a Series B US B2B SaaS spending $28K/month (score 3), with steady load (4), 55% of spend in RDS and NAT (5), containers on PostgreSQL but Cognito for auth (3), SOC 2 only (4), US customers on a latency-sensitive dashboard (2), a three-person platform team (3), and a Savings Plan expiring in 8 months (4). The weighted index is (45 + 60 + 75 + 45 + 40 + 20 + 30 + 40) ÷ 5 = 71. That is borderline full exit, but the low latency score is a red flag. The sensible move is hybrid, with the core in a US region or with the latency-sensitive API kept on AWS.
Hard stops. Treat any of these as an automatic "not now," regardless of score: an unresolved HIPAA BAA requirement for production PHI, a FedRAMP obligation, an EDP with a large unmet spend commitment, or no one who can own database operations.
Where to go: destination fit for US SaaS
"Leave AWS" is not one destination. Here is how the realistic options compare for a company whose customers are mostly in the US.
FactorStay & optimize AWSHybrid: AWS edge + Hetzner coreHetzner EU (dedicated servers)Hetzner US (cloud only)US colocation / owned hardwareCost reduction potentialModerate (rightsizing, commitments)High on moved workloadsHighest per coreModerate after 2026 repricingHigh at scale, CapEx up frontLatency to US usersBestGood (edge stays local)Transatlantic hopGood (VA, OR)Best (you choose the site)Managed servicesFull catalogKeep what you needMinimal, you run itMinimal; no Object Storage in USNone, you run everythingOps burdenLowMediumHighMedium-highHighest (hardware lifecycle)Attestations for buyersSOC 2, HIPAA BAA, FedRAMPMixed: document bothISO 27001, BSI C5 Type 2Same company-level certificationsDepends on the facilitySpeed to add capacityMinutesMinutes (burst to AWS)Hours to daysMinutesWeeksBest fitSpiky, serverless, small billsMost US SaaS at $10K–$100K/monthBatch, async, data processing, EU customersUS-facing apps on CX/CAX-friendly workloads$1M+/year steady workloadswhere to migrate
Two Hetzner details catch US teams off guard. First, Ashburn and Hillsboro are cloud-only: you can't order dedicated root servers there, and Object Storage isn't offered in the US, so the cheapest Hetzner products are only available in Germany and Finland. Second, traffic between Hetzner's US and EU network zones is billed as regular internet traffic, so a split-region design needs its own bandwidth line in the model.
On compliance, Hetzner holds ISO/IEC 27001 and a BSI C5 Type 2 attestation, but it says it focuses on ISO 27001 instead of SOC 2 and does not mention HIPAA. For many B2B buyers an ISO 27001 subprocessor is fine. For healthcare PHI, plan to keep that workload on a provider that signs a BAA.
If the matrix and this table point you toward AWS to Hetzner, our step-by-step AWS to Hetzner migration guide covers the execution: service mapping, the parallel build, dual-writes, and cutover.
The costs that don't show up on the Hetzner price list
Most repatriation business cases that disappoint get the server price right and miss everything around it. Add these lines before you compare totals:
The double-run period. You pay for both environments for weeks or months. FluentU's AWS bill only fell 49.7% in the first post-cutover month because of cleanup and retained snapshots.
Database operations. Replacing RDS means owning replication, failover, point-in-time recovery, patching, and tested restores. This is the work the managed-DB premium was paying for.
Backups and disaster recovery off-provider. A single-provider setup without a second location is a regression from Multi-AZ. Budget for a second site or provider.
Observability and security tooling that CloudWatch, GuardDuty, and IAM gave you by default.
On-call and runbooks, either internal hours or a managed SRE contract.
Repricing risk. Hetzner changed prices four times in 2026. Model a 30% buffer on compute and recheck before every resize.
Remaining AWS commitments. Unused Savings Plans or EDP shortfalls are sunk costs you still pay.
A credible model shows three numbers: today's AWS cost, the target steady-state cost including the lines above, and the one-time migration cost. It then calculates payback in months. If payback runs past 18 months, optimize AWS first and revisit.
How to decide in 90 days without betting the company
This is a decision process, not a migration plan.
Days 1–20: Get the real baseline. Export 12 months of Cost and Usage Reports. Tag spend by workload, not by service. Identify the three biggest steady line items, as FluentU's RDS turned out to be.
Days 21–40: Score the matrix with the people who own each criterion: finance for commitments, security for compliance, engineering for portability. Disagreements are the useful output.
Days 41–70: Run a pilot on one non-critical, steady workload, such as a worker pool, a reporting database replica, or a blog. Measure actual cost, latency, and ops hours.
Days 71–90: Build the go/no-go model with current 2026 pricing, the hidden-cost lines, and payback. Decide between optimize, hybrid, and full exit. Only then plan the migration itself.
Repatriate with a team that has done it, including the aborted cutover
Gart Solutions plans and runs AWS exits for SaaS companies in the US and Europe, from the first cost audit to the final DNS switch and the on-call afterwards.
~78%
lower steady-state infrastructure cost for FluentU after moving from AWS to Hetzner
$87K/yr
projected savings on a $9.3K/month starting AWS bill
6 months
from first audit to production on Hetzner, with a schema-gated cutover and validated restores
We'll tell you if leaving AWS isn't worth it. Sometimes the right answer is a cleaner AWS bill.
Explore cloud migration services

You shipped an app with Lovable, Bolt, v0, Replit, Cursor or Claude Code. Real people are signing up. There's no dedicated engineer, the budget is close to zero, and a quiet question keeps coming back: is this thing actually safe to run?
This playbook answers that question in the order that matters for a tiny team. Most vibe-coded startups don't need a scalability audit — they need to know if they're one leaked API key away from a bad week. So we start with security exposure and data loss, then outage visibility, then a codebase someone else can pick up, and only after real traction do we get to scalability and investor readiness.
TL;DR
Check risks in this order: exposed secrets & auth → backups → monitoring → documentation → cost → privacy → scalability → investor readiness.
Six fixes cost nothing: rotate exposed keys, turn on host backups, add an uptime monitor, add an error tracker, enable 2FA everywhere, publish a privacy policy and terms.
Don't pay for scale before traction. Pay for a risk scan before you call the app "production-ready" to an investor, a hire or a paying customer.
Get the free playbook (Excel) with the full risk matrix and decision table below.
What is a vibe-coded app — and why is it risky?
A vibe-coded app is software built mostly by describing what you want to an AI coding tool and accepting what it generates, without a developer reviewing every line. It's fast and cheap to build — but it often ships with insecure defaults, exposed credentials, no backups and no monitoring, because the AI optimises for "it works", not "it's safe to run in production".
The term was coined by Andrej Karpathy in early 2025 and the practice has gone mainstream since. That's a good thing: founders who couldn't afford an engineering team can now validate ideas in days. The problem isn't the code quality of any single feature. It's what's missing around the features — the operational and security layer a senior engineer would add by habit:
Database rules that stop one user from reading another user's data
Secrets kept on the server, out of the browser and out of git history
Backups that have actually been restored at least once
Alerts that fire before a customer emails support
Someone — anyone — who can explain how the app works
The numbers behind vibe coding security risks
These aren't hypothetical. The most common incidents in AI-built apps are mundane, cheap to prevent and expensive to clean up:
And then there's data loss. In July 2025, an AI coding agent deleted a live production database during an explicit code freeze on a high-profile founder's project. Backups are the one control that turns that from a company-ending event into an annoying afternoon.
"When founders ask us whether their vibe-coded app will scale, the honest answer is usually: that's not your problem yet. Your problem is the Supabase key sitting in the browser bundle."— Roman Burdiuzha, CTO, Gart Solutions
6 things to fix yourself today, for free
Before you spend anything, do these. Together they take an afternoon and remove most of the "bad week" scenarios for a 1-5 person team.
1
Rotate any API keys or credentials that might be exposed.
If a key has ever touched client-side code, a public repo, or an AI chat log, treat it as burned. Free and about 30 minutes — if you know where to look. If you don't, that's what a risk scan is for.
2
Turn on your host's one-click backups.
Supabase, Railway, Render, Neon and most other platforms have this built in, often free or a few dollars a month. If you've never checked, assume it's off.
3
Set up a free uptime monitor.
UptimeRobot or Better Stack's free tier will tell you the app is down before a user does.
4
Add a free error tracker.
Sentry's free tier catches the bugs that would otherwise pile up invisibly.
5
Turn on 2FA everywhere.
Hosting, domain registrar, payment processor, GitHub — every account that could sink the company if it were taken over.
6
Put a basic privacy policy and terms of service in place.
Free templates exist. Don't skip this even pre-revenue if you collect any user data at all.
The risk priority list: what to check, in order
Not every risk deserves your attention today. We rank them by likelihood × impact for a 1–5 person team, and by whether you can realistically fix them yourself.
#
Risk area
Likelihood × impact
Fix it yourself for free?
1
Exposed secrets & broken auth
High × High
The most common real-world incident in AI-built apps
Partially — you can rotate keys, but you won't see everything that's exposed without a real scan
2
No backups / data-loss risk
Med-high × Catastrophic
The one mistake with no undo
Mostly — most hosts have a one-click toggle
3
No monitoring
High × Medium
Cheap to prevent, expensive in lost trust
Yes — free tools exist
4
Fragile, undocumented codebase
Medium
Blocks hiring, fundraising or handoff
Partially — founders rarely see their own blind spots
5
Cost & performance landmines
Low now
Rises fast with real growth
Rarely — invisible until the bill arrives
6
Data privacy / compliance blind spots
Situational
High, fast, in health, finance or with EU users
Mostly, with a template — not if you handle sensitive data
7
Scalability architecture
Low pre-traction
Don't solve a problem you don't have yet
N/A — not worth fixing until you need it
8
Investor / acquisition readiness
Situational
Only matters if you're raising — then it matters fast
No — build it ahead of the ask, not during it
Each risk explained (and what "self-fixable" really means)
1. Exposed secrets and broken authentication
What goes wrong: API keys, database credentials or admin routes end up in client-side code, git history or default platform settings. This is the number-one way vibe-coded apps get hacked — or hit with a surprise five-figure bill from someone using your OpenAI or cloud key.
Why AI tools cause it: asked to "make the feature work", an AI assistant will happily put a key where the browser can read it, or leave database row-level security off because the demo works without it.
What you can do: rotate every key you suspect, move secrets to server-side environment variables, and check that your database denies access by default. What you can't easily do alone: know you found everything — old commits, forgotten preview deployments and unprotected API routes are where exposures hide.
2. No backups — the mistake with no undo
What goes wrong: one bad migration, a dropped table or a bug that overwrites data — and there's nothing to restore from. Switching backups on is easy. Knowing they restore is not: a backup you've never tested is a hope, not a plan. Do one test restore into a separate project and time it.
3. No monitoring — you find out from angry users
What goes wrong: the app goes down, a third-party API starts failing, or a bug ships, and the founder finds out hours later from a support email. This is the most self-fixable risk on the list — an uptime monitor plus an error tracker covers 80% of it — but alerts need to reach a phone someone actually looks at.
4. A fragile, undocumented codebase
What goes wrong: the AI wrote the code, and no one — including the founder — can confidently explain how half of it works. Every fix gets riskier over time, and the knowledge lives in old chat histories. It's rarely urgent on day one, but it blocks every next step: hiring your first engineer, raising a round, or handing the product to an agency.
5. Cost and performance landmines
What goes wrong: inefficient queries, no caching, or a generous free tier that turns into a real bill the moment usage grows 10x. AI-generated code commonly fetches whole tables when it needs one row, or calls a paid API inside a loop. Low likelihood today; check it before any launch, PR push or paid campaign.
6. Data privacy and compliance blind spots
What goes wrong: collecting emails, payment details or any personal data without a privacy policy, consent flow, or a basic sense of what GDPR or CCPA requires. For a generic SaaS, a template mostly covers it. In health, fintech or with EU users, the impact gets high very fast — and this is where we see founders underestimate exposure most often.
7. Scalability architecture
What goes wrong: the app is built the way vibe-coding tools default to, not how it needs to work at 100x today's traffic. Our advice: don't pay to solve this before you have traction. Revisit when traffic or infrastructure costs climb month over month.
8. Investor and acquisition readiness
What goes wrong: a term sheet or acquisition conversation suddenly requires technical answers nobody prepared — security posture, architecture, who owns the code, how data is handled. Technical due diligence is not something you can assemble in the week before it starts.
What to do in your situation
Find the row that sounds most like you. This is the fastest way to decide your next step.
Your situationWhat to do about itNon-technical founder, MVP built with Lovable, v0 or Replit, real users nowRun the free self-check, then a Risk Scan before telling anyone it's "production-ready".Technical co-founder used Cursor or Claude Code heavily and isn't sure what's in the codebase anymoreCodebase Handoff Docs — turn chat-history knowledge into something the team can rely on.A user reported a bug that looks like it exposed someone else's dataThat's not a scan anymore. That's emergency stabilisation — today.The app is about to process real payments for the first timeSecure Secrets & Auth first, a privacy/compliance screen right behind it.About to raise a pre-seed or seed roundRisk Scan now so there are no surprises in diligence; full investor readiness once the raise is real.About to hire the first engineerCodebase Handoff Docs — a new hire's first week goes very differently with or without them.Usage just jumped — a launch, a PR mention, a viral postCost & Query Sanity Check before the next invoice; Scale-Readiness if growth keeps climbing.Something broke in production and no one knows whyEmergency stabilisation — the point is not having to figure it out alone.You heard a vibe-coding horror story and want peace of mind, cheaplyA one-day Risk Scan exists for exactly this.
When it's worth bringing in help
The rule of thumb: do it yourself when the fix is a toggle; get help when the problem is "I don't know what I don't know". Here's how Gart's IT audit team packages that for small, AI-built products — each scoped in days, not months.
OfferWhat it solvesTimelineBest forFree Self-Check GuideThe six free fixes above as a checklistTodayEvery vibe-coded startup, day oneVibe Code Risk ScanAn evidence-based answer to "how much risk is hiding in here?" — exposure, backups, monitoring gaps1 day, remoteBefore you call it "production-ready" to an investor or hireSecure Secrets & Auth SprintFinds and fixes exposed keys, missing auth checks, insecure defaults1 dayAfter a scan flags it, or if you suspect exposureBackup & DR SetupTurns on and tests backups so "restore" is a real buttonHalf a dayIf you've never tested a restoreMonitoring & Alerting SetupUptime and error monitoring configured right the first timeHalf a dayTeams learning about outages from support emailsCodebase Handoff DocsA plain-language map of how the app works1 dayBefore your first engineering hire or a handoffCost & Query Sanity CheckCatches AI-generated queries and configs that get expensive at scaleHalf a dayBefore a launch, PR push or ad campaignCompliance/Privacy Quick ScreenWhether your data collection needs a policy, consent flow or moreHalf a dayPayments, health data or EU usersStartup Starter BundleRisk Scan + Secrets & Auth + Backup & DR, cheaper together2–3 days"Where do I even start?"Vibe Code Co-PilotA few hours a month of code review and questionsMonthlyTeams shipping fast with AI who want a second pair of eyesVibe Code RescuePriority crisis response when something is broken, breached or blocking a launch48–72 hoursProduction down, data possibly exposed, or a round blocked
The growth bridge: when you outgrow the 1–5 person stage
Once there's real traffic, a funded round or an acquisition conversation, the needs change. These engagements go deeper and are scoped individually:
Scale-Readiness Package — infrastructure, DevOps and cost review sized for real growth. Time for it when: traffic or infrastructure costs climb month over month.
Investor / Acquisition Readiness Package — codebase, security and documentation packaged for technical due diligence. Time for it when: a raise or acquisition is real and diligence is coming.
Full Compliance Audit & Consulting — SOC 2, GDPR, HIPAA, PCI DSS and more. Time for it when: you handle regulated data or enterprise customers ask for SOC 2.
Full Technical Audit — architecture, security, infrastructure and code quality end to end. Time for it when: the codebase has outgrown a lightweight review.
If reliability is becoming the bottleneck, our guide to software reliability is the natural next read.
Not sure how much risk is hiding in your app?
Start with the free checklist. When you want a clear, evidence-based answer, a one-day Vibe Code Risk Scan tells you exactly what's exposed and what to fix first.
Book a Risk Scan →
Download a Vide-Coded App Checklist
Vibe-Coded-Whats-Next-Risk-First-Playbook-Gart-SolutionsDownload