DevOps monitoring is the continuous practice of collecting, analyzing, and acting on telemetry data from every layer of your software delivery system — infrastructure, applications, pipelines, and user experience. It is the operational nervous system that connects what your team ships with how that software actually behaves in production.
Without effective DevOps monitoring, you are flying blind. You ship code and hope it works. You hear about incidents from users, not dashboards. You spend hours — not minutes — isolating root causes. In a CI/CD world, where releases happen daily or even hourly, that is simply not a viable operating model.
At Gart, we have designed and audited monitoring stacks for SaaS platforms, healthcare systems, fintech products, and Kubernetes-native environments across AWS, Azure, and GCP. This guide distills those lessons into a practical reference: what to monitor, which frameworks to apply, which tools to choose, and what patterns to avoid.
If you are assessing your entire infrastructure health, not just monitoring, see our IT Audit Services — the starting point for many of our cloud optimization engagements.
What is DevOps Monitoring?
DevOps monitoring is the ongoing process of tracking the health, performance, and behavior of systems and software across the full DevOps lifecycle — from code commit and CI/CD pipeline to production infrastructure and end-user experience — to enable rapid detection, diagnosis, and resolution of issues.
It covers the entire technology stack: cloud resources, servers, containers, microservices, databases, networks, application code, and deployment pipelines. The goal is always the same — turn raw system data into actionable insight before a problem reaches your users.
DevOps monitoring is not a passive activity. It drives decisions: when to scale, when to roll back a deployment, when to page an engineer, and when to invest in architecture changes. In mature teams, monitoring outputs feed directly into planning — influencing sprint priorities and capacity forecasts.
DevOps Monitoring vs Observability vs SRE
These three terms are often used interchangeably, but they describe distinct — and complementary — disciplines.
ConceptCore QuestionPrimary OutputsWho Owns ItDevOps MonitoringIs the system healthy right now?Dashboards, alerts, uptime metricsDevOps / Platform teamsObservabilityWhy is the system behaving this way?Distributed traces, structured logs, high-cardinality metricsEngineering teams broadlySRE (Site Reliability Engineering)What is our acceptable risk level, and are we within it?SLOs, error budgets, runbooks, postmortemsSRE / Reliability teams
Monitoring tells you what is happening. Observability helps you understand why it is happening. SRE defines how much failure is acceptable. A mature DevOps organization needs all three working in concert. The Cloud Native Computing Foundation (CNCF) provides a useful open-source landscape for understanding how these disciplines intersect with tooling choices.
Why Monitoring Matters in a DevOps Lifecycle
The DevOps philosophy — ship fast, iterate continuously, fail safely — only holds up when you can see what is happening in production. Here is the business case, without the fluff.
Reduced MTTD and MTTR. Mean time to detect (MTTD) and mean time to resolve (MTTR) are the two most important incident metrics. Centralized monitoring with clear alerting cuts both, often dramatically. In a recent Gart engagement with a cloud-native SaaS platform, migrating from siloed per-service alerts to a unified observability stack reduced MTTD from 22 minutes to under 4.
Deployment confidence. With solid monitoring in place, teams can deploy more frequently because they know they will catch regressions immediately — before users do.
Proactive capacity planning. Trend analysis on CPU, memory, and request volume lets you scale ahead of demand rather than reacting to overloaded nodes.
Compliance and auditability. Regulatory frameworks — including HIPAA, PCI-DSS, and SOC 2 — require detailed audit logs. Monitoring infrastructure naturally produces these artefacts.
Cost control. Visibility into resource utilization reveals waste: idle EC2 instances, over-provisioned RDS clusters, log storage costs that crept up unnoticed.
Key Takeaway: DevOps monitoring is not a cost centre — it is the mechanism by which engineering teams maintain delivery speed without sacrificing reliability.
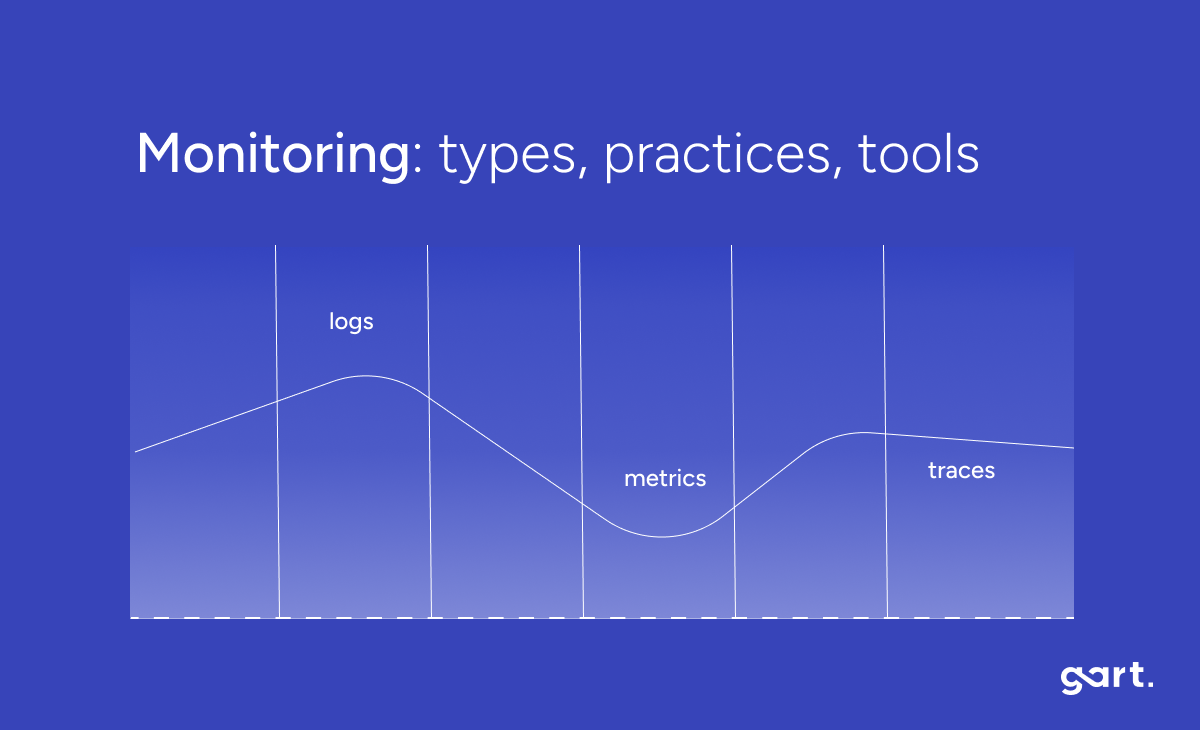
The Three Pillars: Metrics, Logs & Traces
All DevOps monitoring telemetry ultimately maps to three signal types. Understanding them is the foundation for designing any monitoring architecture. The OpenTelemetry project has made significant progress in standardizing how all three are collected and correlated.
📊
Metrics
Numerical data points sampled over time. CPU at 78%, p95 API latency at 320ms, request rate at 1,400 RPS. Ideal for alerting and trend visualization. Cheap to store and fast to query.
📄
Logs
Timestamped records of events. Application errors, user actions, deployment events. Rich in context but expensive at scale. Structured logs (JSON) are far easier to query than unstructured text.
🔗
Traces
End-to-end records of a request as it flows through distributed services. Essential for diagnosing latency in microservices where a single user action touches ten or more services.
The goal is correlation: when an alert fires, you should be able to jump from the metric spike to the relevant logs and the distributed trace for the same time window. Tools like Grafana, Datadog, and Dynatrace increasingly make this three-way correlation a single click.
Best Practices for Each Pillar
Metrics: Define which metrics map to business outcomes before wiring up dashboards. Avoid cardinality explosions — labels with unbounded values (user IDs, request IDs) can cripple Prometheus at scale.
Logs: Use structured logging (JSON) from day one. Centralize with ELK Stack(Elasticsearch, Logstash, Kibana) or Grafana Loki. Never log sensitive PII — build a scrubbing layer into your log pipeline.
Traces: Instrument with OpenTelemetry from the start — it gives you vendor-neutral traces exportable to Jaeger, Zipkin, Tempo, Datadog, or any other backend. Sample intelligently: 100% trace volume is rarely justified and gets expensive fast.
Golden Signals, RED & USE Methods
Rather than monitoring everything, mature DevOps teams use structured frameworks to pick the right metrics. These are the three most widely adopted.
FrameworkMetricsBest Applied ToGolden Signals(Google SRE Book)Latency, Traffic, Errors, SaturationUser-facing services, APIs, external endpointsRED MethodRate, Errors, DurationMicroservices, request-driven workloadsUSE MethodUtilization, Saturation, ErrorsInfrastructure resources (CPU, memory, disk, network)
In practice, most teams combine all three. Use the USE method to watch your nodes and pods, the RED method to watch your microservices, and Golden Signals to define the SLIs you report to the business.
Types of DevOps Monitoring
Effective monitoring spans every layer of the technology stack. Missing any layer creates blind spots that will eventually surface as incidents.
Cloud Level Monitoring
Tracks the health, cost, and compliance of cloud provider resources. Each major cloud offers native tooling as a baseline.
AWS: CloudWatch (metrics, logs, alarms, dashboards), X-Ray (tracing), Config (compliance), Cost Explorer (spend).
Azure: Azure Monitor (metrics + logs), Application Insights (APM), Sentinel (security), Cost Management.
GCP: Cloud Monitoring + Cloud Logging (formerly Stackdriver), Error Reporting, Cloud Trace. Detailed documentation is available in the Google Cloud Operations Suite.
Native cloud monitoring is a solid starting point, but it rarely provides a unified view across multi-cloud environments or integrates well with application-layer telemetry. Most mature teams complement it with an independent observability platform.
Infrastructure Level Monitoring
Covers physical and virtual servers, databases, networking equipment, and storage. Key metrics to track at this layer: CPU utilization, memory usage, disk I/O and capacity, network throughput and packet loss, process health, and database connection pool exhaustion. Tools like Prometheus with node_exporter are the open-source default for this layer.
Container & Orchestration Monitoring (Kubernetes)
Kubernetes environments require monitoring at multiple sub-layers simultaneously: cluster nodes, individual pods, deployments, services, and the control plane itself.
Pod restarts and OOMKill events
Node resource pressure and evictions
Deployment rollout status and error rates
Horizontal Pod Autoscaler (HPA) scaling events
Persistent volume claims and storage usage
Ingress request rates and error rates
The standard open-source stack here is kube-state-metrics + Prometheus + Grafana, often deployed via the kube-prometheus-stack Helm chart. For managed Kubernetes, native integrations (AWS EKS Container Insights, GKE Managed Prometheus) reduce the operational overhead.
Application Performance Monitoring (APM)
APM focuses on how your code behaves at runtime: response times, error rates, database query performance, external API latency, memory leaks, and thread deadlocks. It provides the application-level context that infrastructure metrics alone cannot give you. Popular APM platforms include New Relic, Datadog APM, Dynatrace, and the open-source Elastic APM.
Security Monitoring
Often treated separately, security monitoring should be an integrated layer: anomaly detection on authentication events, network traffic analysis, dependency vulnerability scanning in CI/CD, and runtime threat detection in containers (Falco is the open-source leader here).
User Experience & Synthetic Monitoring
Backend health does not guarantee good user experience. Synthetic monitoring runs scripted user journeys against your application from multiple geographic locations to measure availability and performance as users actually experience it. Combine this with Real User Monitoring (RUM) to capture field data from actual browser and mobile sessions.
How to Monitor CI/CD Pipelines
This is one of the most underserved areas in typical DevOps monitoring setups. Teams instrument their production systems carefully but leave their delivery pipelines nearly opaque. If you cannot see what is happening in your CI/CD pipelines, you cannot improve deployment velocity or catch quality regressions early.
Key CI/CD Metrics to Track
Deployment frequency: how often you successfully ship to production.
Lead time for changes: time from code commit to production deployment.
Change failure rate: percentage of deployments causing a production incident or rollback.
MTTR (Mean Time to Restore): how long it takes to recover from a production failure.
Build duration trends: slow CI is a developer experience and productivity problem.
Test flakiness rate: unreliable tests erode trust in the pipeline and get ignored.
These four metrics — frequency, lead time, failure rate, MTTR — are the DORA metrics established by the research community via the Linux Foundation and DevOps Research & Assessment group. They are the industry standard for measuring DevOps performance.
How to Implement It
Most CI platforms (GitHub Actions, GitLab CI, Jenkins, CircleCI) can export pipeline events and durations to Prometheus via exporters or webhooks. From there, Grafana dashboards surface the DORA metrics in near-real-time. If you use Datadog or New Relic, both have native CI visibility integrations.
SLIs, SLOs & Error Budgets
Without SLOs, monitoring produces data without direction. SLOs (Service Level Objectives) are the mechanism that connects your monitoring to business outcomes.
SLI (Service Level Indicator): a specific metric used to measure service health. Example: "the proportion of API requests completed in under 500ms."
SLO (Service Level Objective): the target for that metric. Example: "99.5% of API requests must complete in under 500ms, measured over a rolling 28-day window."
Error Budget: the allowable failure rate implied by the SLO. A 99.5% SLO means you have a 0.5% error budget — approximately 3.6 hours of downtime per month. When the budget is exhausted, reliability work takes priority over feature development.
SLO-based alerting is far more actionable than threshold alerting. Instead of alerting when CPU exceeds 80%, you alert when your error budget burn rate is high enough to exhaust the monthly budget within 24 hours — giving your team time to act before users are significantly impacted.
What to Monitor by Team Stage
Monitoring needs differ significantly depending on where your organization is in its DevOps maturity journey. This practical framework — based on patterns we observe in client engagements — helps teams prioritize correctly rather than trying to build enterprise-grade observability on day one.
Stage 1
Startup / Early Stage
Basic uptime checks (Uptime Robot, Freshping)
Error rate from application logs
CPU & memory per server/container
Deployment success / failure
On-call via simple alerting (Slack / PagerDuty)
Stage 2
Scale-Up
Prometheus + Grafana for metrics
Centralized log aggregation (Loki or ELK)
APM on all user-facing services
Basic SLOs defined for critical paths
CI/CD pipeline metrics & failure rates
Database slow-query monitoring
Stage 3
Enterprise / Mature
Full distributed tracing (OpenTelemetry)
SLO-based alerting with error budgets
Synthetic monitoring + RUM
Security monitoring (Falco, SIEM integration)
FinOps dashboards (cost per service)
Chaos engineering with observability validation
DevOps Monitoring Tools Compared
This guide is based on Gart's experience designing monitoring stacks for cloud and Kubernetes environments, combined with vendor documentation and public best practices. Tool selection should reflect your team's maturity, budget, and cloud footprint — there is no universally correct choice.
ToolBest ForPricing ModelStrengthsLimitationsPrometheusMetrics collection, KubernetesFREE / OSSPull-based, powerful query language (PromQL), huge ecosystemNo long-term storage natively; high cardinality causes performance issuesGrafanaVisualization & dashboardsFREE OSS + SAASMulti-source dashboards, plugins, alerting, Grafana CloudDashboard sprawl without governance; alerting UX not always intuitiveGrafana LokiLog aggregationFREE OSS + SAASCost-efficient (indexes labels, not content), Grafana-nativeFull-text search slower than Elasticsearch; less mature than ELKELK StackLog search & analyticsFREE OSS + SAASPowerful full-text search, Kibana analytics, mature ecosystemResource-heavy, operationally complex, storage costs grow fastDatadogFull-stack observabilityPER HOST / GBBest-in-class UX, unified metrics/logs/traces/APM, AI featuresExpensive at scale; vendor lock-in risk; bill shock without governanceNew RelicAPM & user monitoringPER USER / USAGEDeep transaction tracing, browser/mobile RUM, syntheticsPricing model changed significantly; can be costly for large teamsDynatraceEnterprise AI-driven monitoringPER HOST / DEM UNITAI-powered root cause analysis (Davis), auto-discovery, full-stackPremium pricing, complex licensing, steep learning curveJaeger / TempoDistributed tracingFREE / OSSOpenTelemetry-native, vendor-neutral, Grafana Tempo integrates seamlesslyJaeger: operational complexity; Tempo: queries slower without search indexOpenTelemetryInstrumentation standardFREE / OSSVendor-neutral, covers metrics/logs/traces, growing communityInstrumentation effort upfront; some language SDKs still maturingDevOps Monitoring Tools Compared
For most cloud-native teams starting out, a Prometheus + Grafana + Loki + Tempo stack provides comprehensive coverage at near-zero licensing cost. As you scale or need enterprise support, Datadog or Dynatrace become serious options — but budget accordingly.
Sample Monitoring Architecture for Kubernetes
For a production Kubernetes-based SaaS stack, this is the monitoring baseline we recommend and implement at Gart.
In practice: For a Kubernetes-based SaaS stack, the 12 signals we track in every production environment are pod restarts, OOMKill events, p95 API latency, queue depth, DB slow queries, deployment failure rate, HPA scaling events, node disk pressure, ingress error rate (5xx), trace error rate per service, log error volume, and customer-facing uptime. These map directly to the Four Golden Signals and cover the most common failure modes.
Architecture Overview
Collection layer: kube-state-metrics, node_exporter, cAdvisor → Prometheus; application logs → Promtail → Loki; traces via OpenTelemetry Collector → Grafana Tempo.
Storage layer: Prometheus with Thanos or VictoriaMetrics for long-term metrics retention; Loki for logs; S3-backed object storage for traces.
Visualization layer: Grafana with pre-built Kubernetes dashboards (Node Exporter Full, Kubernetes Cluster, per-service RED dashboards).
Alerting layer: Prometheus Alertmanager → PagerDuty / OpsGenie for on-call routing; Slack for informational alerts. Alert rules follow SLO burn rate logic, not simple thresholds.
Security layer: Falco for runtime threat detection; OPA/Kyverno for policy enforcement; audit logs shipped to the central log platform.
Common Monitoring Mistakes We See in Audits
These are the patterns that appear repeatedly in our infrastructure audits — across teams of all sizes and at all cloud maturity levels.
Monitoring only what is easy to collect, not what matters. CPU and memory metrics are collected everywhere, but deployment failure rates and user-facing latency are often absent. Start from the user and work inward.
Alert fatigue from threshold-only alerting. Setting a static alert at "CPU > 80%" generates noise during normal traffic spikes. SLO-based and anomaly-based alerting dramatically reduces false-positive rates.
No ownership of alerts. Alerts fire into a shared Slack channel with no assigned responder. Every alert needs an owner and a runbook — otherwise the team learns to ignore them.
Log volume without log value. Teams log everything at DEBUG level in production, generating gigabytes per hour of data that is never queried. Define what you actually need to debug incidents and log that, structured.
Treating monitoring as a set-and-forget task. Systems change. Deployments change the cardinality of your metrics. New services appear. Monitoring configurations need a regular review cycle — quarterly at minimum.
Cardinality explosions in Prometheus. Adding high-cardinality labels (user IDs, request IDs, session tokens) to Prometheus metrics is one of the fastest ways to crash a Prometheus instance. Label design matters as much as metric selection.
Ignoring monitoring costs. Log ingestion and storage in SaaS platforms (Datadog, Splunk) can become a significant budget item. Implement log sampling, retention policies, and cost dashboards alongside your observability stack.
Best Practices for DevOps Monitoring
Define monitoring requirements during sprint planning — not after deployment. Observability is a feature, not an afterthought.
Use the RED method for every new microservice from day one: instrument Rate, Errors, and Duration before the service goes to production.
Write runbooks for every alert that fires. If your team cannot describe what to do when an alert fires, the alert is not ready to go live.
Test your monitoring. Chaos engineering experiments (Chaos Monkey, Chaos Mesh) validate that your dashboards and alerts actually fire when something breaks.
Use OpenTelemetry for instrumentation from the start. It prevents vendor lock-in and gives you flexibility to swap backends as your needs evolve.
Implement log sampling in high-volume services. 100% log capture at 100,000 RPS is rarely necessary and is always expensive.
Review and prune dashboards regularly. A dashboard no one opens is a maintenance cost with no return.
Correlate monitoring data with deployment events. A spike in errors 3 minutes after a deployment is almost certainly caused by that deployment — your tools should surface this automatically.
Real-World Monitoring Use Cases
Music SaaS Platform: Centralized Monitoring at Scale
A B2C SaaS music platform serving millions of concurrent global users needed real-time visibility across a geographically distributed infrastructure. Gart integrated AWS CloudWatch and Grafana to deliver dashboards covering regional server performance, database query times, API error rates, and streaming latency per region. The result: proactive alerts eliminated operational interruptions during global release events, and the team gained the visibility needed to scale confidently. Read the full case study here.
Digital Landfill Platform: IoT-Scale Environmental Monitoring
The elandfill.io platform required monitoring of methane emission sensors across multiple countries, with strict regulatory compliance requirements. Gart designed a cloud-agnostic architecture using Prometheus for metrics, Grafana for per-country dashboards, and custom exporters to ingest IoT sensor data. Beyond improving emission forecasting accuracy, the monitoring infrastructure simplified regulatory compliance reporting — turning what was previously a manual audit process into an automated, continuous data stream. Read the full case study here.
Future of DevOps Monitoring
The trajectory of DevOps monitoring is moving in two parallel directions: greater automation and greater standardization.
AI-assisted anomaly detection is already commercially available in platforms like Dynatrace (Davis AI), Datadog (Watchdog), and New Relic (applied intelligence). These systems learn baseline behavior for every service and surface deviations before they breach human-defined thresholds — reducing both MTTD and alert fatigue simultaneously.
OpenTelemetry as a universal standard is accelerating. Within the next few years, proprietary instrumentation agents will likely become optional for most teams — replaced by a single OpenTelemetry SDK that exports to any backend. This fundamentally changes the vendor dynamics of the observability market.
FinOps integration is the emerging frontier: teams increasingly want to see cost data as a monitoring signal — cost per request, cost per deployment, cost per team — sitting alongside performance and reliability data in the same observability platform.
Platform Engineering is changing who owns monitoring. As internal developer platforms mature, observability is becoming a platform capability delivered to product teams — rather than something each team configures independently.
Watch the webinar about Monitoring DevOps
Gart Solutions · DevOps & Cloud Engineering
Is Your Monitoring Stack Actually Working When It Matters?
Most teams discover monitoring gaps during an incident — not before. Gart's monitoring assessment identifies blind spots, alert fatigue, and missing SLOs across your cloud environment, then delivers a concrete roadmap.
🔍
Infrastructure & observability audit across AWS, Azure, and GCP
📐
Custom monitoring architecture design for your specific stack
🛠️
Implementation: Prometheus, Grafana, Loki, OpenTelemetry
📊
SLO definition, error budget alerting, and DORA metrics
☸️
Kubernetes-native monitoring for EKS, GKE, and AKS
⚡
Incident response runbooks and on-call process design
Book a Monitoring Assessment
Explore DevOps Services →
No commitment required — we start with a free 30-minute discovery call to understand your environment.
Roman Burdiuzha
Co-founder & CTO, Gart Solutions · Cloud Architecture Expert
Roman has 15+ years of experience in DevOps and cloud architecture, with prior leadership roles at SoftServe and lifecell Ukraine. He co-founded Gart Solutions, where he leads cloud transformation and infrastructure modernization engagements across Europe and North America. In one recent client engagement, Gart reduced infrastructure waste by 38% through consolidating idle resources and introducing usage-aware automation. Read more on Startup Weekly.

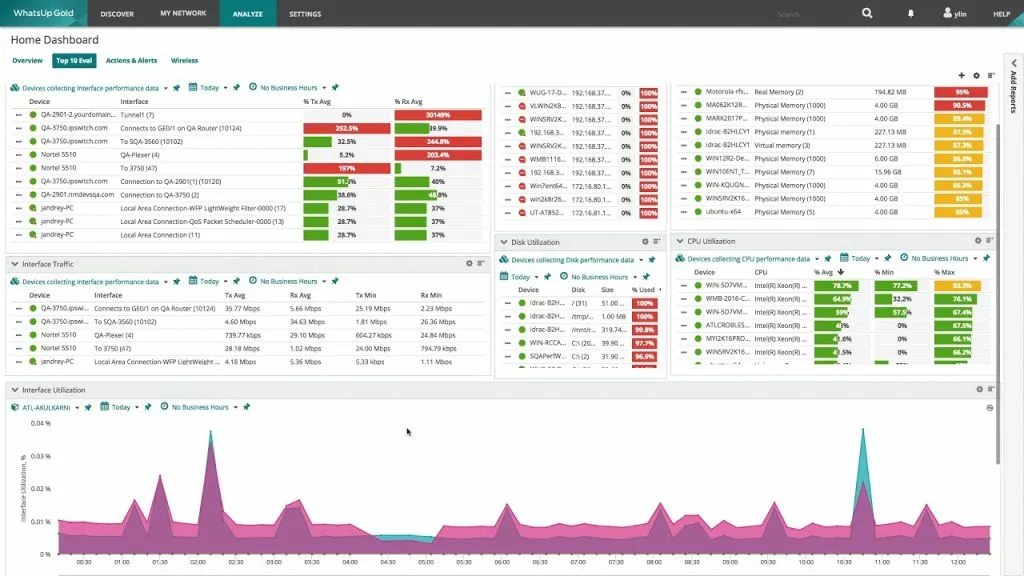
Ready to take your IT infrastructure to the next level? Discover the ultimate arsenal of monitoring tools and software in this blog post. From real-time insights to proactive alerts, we unveil the best IT infrastructure monitoring solutions that will empower your business operations and supercharge your success. Get ready to elevate your monitoring game and unlock the full potential of your infrastructure in today's digital landscape.
At Gart Solutions, our engineers have deployed, tuned, and compared monitoring stacks across dozens of enterprise clients — from healthcare providers to FinTech scale-ups. This guide is the result of that hands-on experience: an honest, detailed breakdown of the top 15 best IT infrastructure monitoring software tools available in 2026, including who each tool is really built for.
Quick summary: The best IT infrastructure monitoring software depends on your stack.
Datadog and Dynatrace lead for cloud-native enterprises;
Zabbix and Prometheus win on open-source flexibility;
PRTG and WhatsUp Gold suit SMBs needing simplicity. Jump to the Best Tools by Use Case section to find your match instantly.
How We Selected These IT Monitoring Tools
Transparency matters. Our editorial team evaluated each tool against a consistent rubric — not vendor marketing. Here's exactly how we scored them:
1. Hands-on deployment testingWe deployed or worked with each tool in real client or lab environments, assessing setup complexity, agent behavior, and alerting accuracy.
2. Feature depth auditWe scored each tool on: metrics coverage, log ingestion, distributed tracing, AIOps capabilities, alerting flexibility, and dashboard quality.
3. Pricing transparency checkWe contacted vendors and consulted G2, Gartner Peer Insights, and public pricing pages to provide the most accurate cost picture.
4. Community and ecosystem strengthWe assessed plugin libraries, integration counts, GitHub activity (for open-source tools), and support responsiveness.
5. Scalability under loadWe reviewed published benchmarks and client case studies to understand how each tool performs at 500+ nodes, high-cardinality metrics, and multi-region deployments.
Last reviewed and updated: April 2026. We update this article quarterly as tools release major features.
Key Features to Look For in IT Infrastructure Monitoring Software
Before diving into the tool list, understand what separates adequate monitoring from truly effective observability. According to the Cloud Native Computing Foundation, modern infrastructure observability rests on three pillars — metrics, logs, and traces — and the best platforms unify all three.
Unified observability (metrics + logs + traces): Siloed tools create blind spots. Look for platforms that correlate all three signal types natively.
Auto-discovery and topology mapping: In dynamic environments (Kubernetes, auto-scaling groups), manual host registration doesn't scale. Auto-discovery is non-negotiable.
AIOps and anomaly detection: Rule-based alerting produces alert fatigue. AI-driven baselines surface real anomalies and reduce noise by 60–80% in our experience.
Cloud-native and hybrid support: Your monitoring tool must work seamlessly across AWS, Azure, GCP, and on-prem — without separate agents per environment.
SNMP, WMI, and agent-based monitoring: Legacy infrastructure isn't going anywhere. Ensure the tool covers network devices, Windows environments, and bare-metal servers.
Customizable alerting with escalation policies: Multi-channel alerts (Slack, PagerDuty, email, SMS) with on-call routing are essential for 24/7 operations teams.
Pricing model fit: Per-host, per-metric, or per-sensor models affect total cost dramatically at scale. Model your expected usage before committing.
IT Infrastructure Monitoring Software Comparison Table 2026
ToolBest ForDeploymentOpen SourcePricing (Starting)AIOpsDatadogCloud-native teamsSaaSNo~$15/host/mo✅ AdvancedDynatraceEnterprise full-stackSaaS / On-premNo~$21/host/mo✅ Davis AIPrometheus + GrafanaDevOps / KubernetesSelf-hostedYesFree⚙️ Via pluginsZabbixMixed enterprise infraSelf-hostedYesFree⚙️ PartialNew RelicFull-stack APM + InfraSaaSNoFree tier / Usage-based✅ Applied IntelligenceElastic Stack (ELK)Log-heavy environmentsSaaS / Self-hostedCore open-sourceFree / from $95/mo⚙️ ML features (paid)SematextSMB / mid-marketSaaS / On-premPartialFrom $3.6/host/moNoPRTG Network MonitorSMB network monitoringOn-premNoFreemium / ~$1,750/yrNoSolarWinds SAMWindows-heavy infraOn-premNoQuote-based⚙️ PartialNagios XICustomizable alertingOn-premCore open-sourceFrom $1,995 perpetualNoManageEngine OpManagerNetwork + server opsOn-prem / SaaSNoFrom $245/yr⚙️ PartialN-able RMMMSP / multi-tenantSaaSNoPer-device (quote)NoAppDynamicsEnterprise APMSaaS / On-premNo~$6/CPU core/mo✅ Cognition EngineWhatsUp GoldSMB / mid-marketOn-premNoFrom $1,795/yrNoGart RMFCustom enterprise / IoTCloud-agnosticCustomEngagement-based✅ CustomIT Infrastructure Monitoring Software Comparison Table 2026
The 15 Best IT Infrastructure Monitoring Software Tools (2026)
⭐ OUR BUILD — BEST FOR CUSTOM ENTERPRISE USE CASES
1. Gart Resource Management Framework (RMF)
When off-the-shelf monitoring tools couldn't meet the requirements of a large-scale digital landfill management operation, our team engineered the Resource Management Framework (RMF) — a cloud-agnostic, fully customizable monitoring solution. RMF proves that the best IT infrastructure monitoring software is sometimes the one built for your exact operational constraints.
What makes RMF unique: Unlike SaaS platforms that force you into their data models, RMF adapts to your asset hierarchy, alerting logic, and reporting workflows. It integrates natively with Microsoft Teams, scales across cloud providers, and includes a purpose-built environmental operations dashboard.
✅ PROS
Fully tailored to business requirements. Cloud-agnostic architecture. Seamless Teams integration. Built-in environmental and IoT sensor support. No vendor lock-in.
❌ CONS
Requires engagement with Gart engineering team. Not a self-serve SaaS product. Build timeline varies by complexity.
💻 Deployment: Cloud-agnostic
💰 Pricing: Engagement-based
🎯 Best for: Unique operational environments, IoT + cloud hybrid
🏆 BEST OVERALL SAAS PLATFORM
2. Datadog Infrastructure Monitoring
Datadog has become the de-facto standard for cloud-native infrastructure monitoring. Its unified platform spans metrics, logs, APM, network monitoring, security, and synthetic testing — all under one pane of glass. For teams running containerized workloads at scale, Datadog's 700+ native integrations and seamless Kubernetes visibility make it the strongest all-rounder in this list.
Our take from the field: Datadog's alerting composer and anomaly detection dramatically reduce MTTR (Mean Time to Resolve) for engineering teams. However, costs can escalate quickly as you add hosts and enable premium features like Log Management at high volume.
✅ PROS
Unified metrics, logs, traces, and RUM. 700+ integrations. Excellent Kubernetes and container monitoring. Strong AIOps and Watchdog AI. Intuitive dashboards. SOC 2, PCI DSS, HIPAA compliant.
❌ CONS
Costs grow rapidly at scale. Per-host model can surprise at 500+ nodes. Advanced APM features require separate SKUs. Data retention limits on lower plans.
💻 Deployment: SaaS
💰 Pricing: ~$15/host/mo (Infra Pro)
🎯 Best for: Cloud-native teams, DevOps, enterprise
🤖 BEST AIOPS & AUTO-DISCOVERY
3. Dynatrace
Dynatrace stands apart through its Davis AI engine, which goes beyond anomaly detection to perform automatic root-cause analysis. While other tools tell you that something is broken, Dynatrace tells you why — automatically correlating a spike in response time to a specific container restart triggered by a bad deployment 12 minutes ago. For large enterprises with complex microservice architectures, this is transformational.
Key differentiator: OneAgent auto-instruments your entire stack — applications, containers, hosts, network — without manual configuration. This dramatically reduces onboarding time from weeks to hours.
✅ PROS
Best-in-class AIOps with Davis AI. OneAgent auto-discovery and instrumentation. Full-stack topology mapping. Real User Monitoring (RUM) built-in. Strong compliance and enterprise security posture.
❌ CONS
Premium pricing — among the most expensive in the category. Complex licensing structure. Can feel like overkill for smaller teams. Customization sometimes requires DQL query knowledge.
💻 SaaS + Managed
💰 ~$21/host/mo
🎯 Large enterprises, complex microservices
🔧 BEST OPEN-SOURCE FOR KUBERNETES
4. Prometheus + Grafana
Prometheus, now a graduated CNCF project, is the gold standard for Kubernetes and container metrics collection. Paired with Grafana for visualization and Alertmanager for routing, the Prometheus stack offers unparalleled flexibility at zero licensing cost. If you have the engineering capacity to operate it, this combination beats most commercial tools on customization.
Reality check: Prometheus is pull-based and time-series only. For logs, you'll need Loki; for traces, Tempo or Jaeger. Managing the full stack requires dedicated platform engineering effort — it's not plug-and-play.
✅ PROS
Completely free and open-source. PromQL is extremely powerful for complex queries. Native Kubernetes service discovery. Huge ecosystem of exporters. CNCF backing ensures longevity.
❌ CONS
No built-in long-term storage (requires Thanos or Cortex). No logs or traces natively. Steep PromQL learning curve. High operational overhead at scale. No enterprise support.
💻 Self-hosted
💰 Free (infrastructure costs apply)
🎯 DevOps teams, Kubernetes-native
📋 BEST FOR LOG-HEAVY ENVIRONMENTS
5. The Elastic Stack (ELK)
The Elastic Stack — Elasticsearch, Logstash, Kibana, and Beats — is the dominant platform for log management, search, and analytics. For organizations generating massive log volumes from distributed systems, ELK provides search performance and query flexibility that purpose-built monitoring tools simply can't match.
2026 update: Elastic's Serverless offering now allows per-query pricing that makes ELK accessible to teams without dedicated cluster management resources. The integration with Elastic's security and APM modules also makes it a viable unified observability platform.
✅ PROS
Best-in-class full-text log search. Kibana dashboards are highly flexible. Open-source core is free. Scales to petabyte-level data. Strong ML anomaly detection (paid). Active community.
❌ CONS
Resource-intensive — requires significant infrastructure to self-host. Complex tuning for performance at scale. Licensing changes have created confusion. Cost can escalate with volume.
💻 SaaS / Self-hosted
💰 Free core / Cloud from $95/mo
🎯 Security, log-heavy environments
🏛️ BEST OPEN-SOURCE FOR MIXED ENTERPRISE INFRASTRUCTURE
6. Zabbix
Zabbix has powered enterprise infrastructure monitoring for over 20 years. Version 7.x introduces significant UI overhauls, improved Kubernetes monitoring, and enhanced business service monitoring views. For organizations with diverse infrastructure — legacy servers, network devices, VMs, and modern cloud — Zabbix remains the most comprehensive free option available.
Field insight: Zabbix's SNMP trap processing and network device monitoring capabilities are exceptionally strong — areas where cloud-native SaaS tools often underperform. We frequently recommend it as the primary monitoring layer for network operations centers.
✅ PROS
Completely free and open-source. Excellent SNMP, IPMI, JMX support. Scales to 100,000+ items. Strong built-in alerting (email, SMS, Slack). No per-host or per-metric fees.
❌ CONS
UI still lags behind commercial tools. Configuration complexity is high for advanced setups. Limited native cloud monitoring. Requires dedicated ops expertise.
💻 Self-hosted
💰 Free
🎯 Enterprise NOC, mixed infra, cost-sensitive orgs
📊 BEST FOR FULL-STACK OBSERVABILITY + GENEROUS FREE TIER
7. New Relic
New Relic overhauled its pricing model in 2023–2024 to a consumption-based approach with 100GB of free data per month — a genuine game-changer for smaller engineering teams. The platform covers the full observability spectrum: APM, infrastructure, logs, browser, mobile, synthetic monitoring, and distributed tracing, all accessible through a single account.
✅ PROS
Generous free tier (100GB/mo). Unified APM + infrastructure + logs. Strong distributed tracing. Applied Intelligence AI for alert correlation. Usage-based pricing scales with growth.
❌ CONS
Costs can escalate with high data ingest volumes. Agent-based approach can add overhead. Some features gated behind paid tiers. Custom dashboards have a learning curve.
💻 SaaS
💰 Free tier / $0.30 per GB ingest
🎯 Startups to mid-market, full-stack teams
💡 BEST VALUE FOR SMB / MID-MARKET
8. Sematext Monitoring
Sematext is a strong competitor to Datadog and New Relic for teams that don't need the full enterprise feature suite but want polished, integrated monitoring. It covers infrastructure metrics, log management, and real user monitoring at a price point that's 3–5x lower than the market leaders.
✅ PROS
Very competitive pricing. Covers metrics, logs, and RUM. Clean, intuitive UI. On-premises deployment option available. Good Docker and Kubernetes support.
❌ CONS
Smaller ecosystem vs. Datadog/New Relic. Limited AIOps features. Less community content and third-party tutorials. Some features available only on higher tiers.
💻 SaaS / On-prem
💰 From $3.6/host/mo
🎯 SMB and mid-market, cost-conscious teams
🏢 BEST FOR SMB NETWORK MONITORING
9. PRTG Network Monitor
PRTG by Paessler is the go-to choice for IT teams that need comprehensive network and infrastructure monitoring without the operational complexity of open-source tools. Its sensor-based model — where each monitored metric is a "sensor" — provides granular control over what you monitor and what you pay for.
✅ PROS
Excellent out-of-the-box setup. 2,500+ sensor types. Strong SNMP support. Freemium plan (100 sensors). Mobile app included. Active user community.
❌ CONS
Windows-only server installation. Sensor costs add up quickly. Not designed for cloud-native/Kubernetes. Limited log management.
💻 On-premises (Windows)
💰 Freemium / ~$1,750/yr (500 sensors)
🎯 SMB IT teams, network admins
🪟 BEST FOR WINDOWS-HEAVY INFRASTRUCTURE
10. SolarWinds Server & Application Monitor (SAM)
SolarWinds SAM excels in environments where Windows Server, SQL Server, and Microsoft application stacks dominate. Its automated discovery, deep WMI integration, and tight coupling with other SolarWinds products make it a powerful choice for organizations already in the ecosystem.
✅ PROS
Deep Windows/Microsoft app monitoring. Strong SAP and VMware coverage. Excellent automated discovery. Tight ecosystem integration. Comprehensive reporting.
❌ CONS
Quote-based pricing. Steeper learning curve for complex configs. Less suited for cloud-native workloads. 2020 security incident concerns.
💻 On-premises
💰 Quote-based
🎯 Windows-centric enterprise IT
🔌 BEST FOR HIGHLY CUSTOMIZED ALERTING
11. Nagios XI
Nagios is the grandfather of infrastructure monitoring — its plugin architecture spawned an entire ecosystem that still powers thousands of monitoring configurations today. While Nagios XI modernized the UI significantly, its real power lies in the depth of its plugin library and community knowledge base for custom checks.
✅ PROS
Massive plugin ecosystem (5,000+). Highly customizable alerting and escalation logic. Long track record and stability. Open-source Nagios Core is free.
❌ CONS
Configuration is file-based and verbose. UI is dated even in XI version. Not cloud-native. Scaling requires significant manual effort.
💻 On-premises
💰 Nagios Core: Free / XI from $1,995
🎯 Maximum alerting flexibility, traditional IT ops
🗺️ BEST NETWORK + SERVER UNIFIED VIEW
12. ManageEngine OpManager
ManageEngine OpManager provides an excellent unified view of network topology and server performance. Its automatic network discovery and mapping capabilities are among the best in the market, making it easy to visualize infrastructure dependencies and identify where failures cascade.
✅ PROS
Excellent network topology auto-discovery. Strong SNMP device support. Good performance analytics. Competitive pricing for SMB to mid-enterprise.
❌ CONS
Limited cloud-native support vs SaaS leaders. Advanced features require add-ons. UI can feel busy for new users. Limited open-source community.
💻 On-prem / SaaS
💰 From $245/yr (Essential)
🎯 Mid-enterprise IT ops, network-heavy environments
🤝 BEST FOR MSPS AND MULTI-TENANT MANAGEMENT
13. N-able RMM
N-able RMM is purpose-built for Managed Service Providers (MSPs) managing multiple client environments from a single platform. Its multi-tenant architecture, patch management automation, and remote control capabilities make it the tool of choice for service providers rather than in-house IT departments.
✅ PROS
Purpose-built multi-tenant architecture. Strong patch management. Built-in remote access tools. PSA integrations. Proactive alerting across devices.
❌ CONS
Not suitable for single-company IT. Opaque per-device pricing. Less depth for cloud-native stacks. Requires MSP-style workflows.
💻 SaaS
💰 Per-device (Contact sales)
🎯 MSPs and IT service providers
💼 BEST ENTERPRISE APM + BUSINESS CORRELATION
14. AppDynamics (Cisco)
AppDynamics bridges the gap between application performance and business outcomes. Its Business Transaction monitoring maps app performance directly to revenue impact — a capability that resonates with CTOs who need to communicate infrastructure health in business terms.
✅ PROS
Best-in-class business correlation. Strong SAP/enterprise app coverage. Cisco full-stack integration. AI-driven intelligent alerting. Mature platform.
❌ CONS
Premium pricing. Slower innovation post-acquisition. Complex licensing. Steeper deployment complexity.
💻 SaaS / On-prem
💰 ~$6/CPU core/mo (APM)
🎯 Large enterprises, business-critical apps
🟡 BEST STRAIGHTFORWARD ON-PREM FOR SMB
15. WhatsUp Gold
WhatsUp Gold by Progress delivers a clean, accessible solution for organizations that want proven on-premises monitoring without the complexity of open-source. Its Layer 2/3 network mapping and intuitive alerting make it a favorite for traditional IT admins.
✅ PROS
Intuitive interface and fast setup. Strong Layer 2/3 network mapping. Solid server health tracking. Customizable alerting thresholds. Regular updates.
❌ CONS
Limited cloud-native/container monitoring. Modules required for advanced features. Pricing scales up quickly for large deployments.
💻 On-premises
💰 From $1,795/yr
🎯 SMB to mid-market, traditional network admins
Best IT Infrastructure Monitoring Software by Use Case
Not every team needs the same tool. Use this framework to match your situation:
Use Case / Team ProfileRecommended Tool(s)WhyCloud-native DevOps team (Kubernetes-first)Prometheus + Grafana, DatadogNative Kubernetes service discovery, PromQL for custom metricsLarge enterprise, full-stack observabilityDynatrace, AppDynamicsAIOps root-cause analysis, automatic discovery, business correlationSMB with limited budgetZabbix, PRTG (free tier), New Relic (free tier)Zero or very low licensing cost, reasonable setup complexityMSP managing multiple clientsN-able RMMMulti-tenant architecture, remote management, PSA integrationsWindows-heavy on-prem enterpriseSolarWinds SAM, ManageEngine OpManagerDeep WMI, Windows app, and network device monitoringHigh log-volume / security-focusedElastic Stack (ELK)Best-in-class log search, SIEM integrations, ML anomaly detectionRegulated industry (healthcare, finance)Datadog, DynatraceSOC 2, HIPAA, PCI DSS compliance built-in; audit loggingCustom / unique infrastructure (IoT, hybrid)Gart RMF, ZabbixMaximum flexibility, custom data models, no vendor constraintsStartup needing fast time-to-valueNew Relic, SematextQuick setup, free or low-cost entry, covers full observability stackBest IT Infrastructure Monitoring Software by Use Case
How to Choose the Right IT Infrastructure Monitoring Software
With 15 strong options on this list, narrowing down your selection requires a structured decision process. Here's the framework our DevOps consulting team uses with clients:
🏗️
1. Map Your Stack
List every layer: network devices, bare-metal, VMs, containers, cloud services, SaaS apps. The tool must have native support (not just "possible") for your primary infrastructure type.
👥
2. Assess Team Capacity
Open-source tools (Prometheus, Zabbix) are powerful but require dedicated ops effort. If your team is already stretched, a managed SaaS platform pays for itself in engineering hours.
💰
3. Model Total Cost of Ownership
Per-host, per-metric, and per-sensor pricing models behave very differently at scale. Simulate 12–24 month costs at your expected growth rate before signing a contract.
📈
4. Define Your SLA Requirements
99.9% uptime SLAs require alerting that fires within 1–2 minutes of an issue. Test the alerting pipeline — not just the dashboard — during your evaluation.
🔒
5. Validate Compliance Fit
Healthcare, finance, and government environments have strict data residency and audit requirements. Confirm data processing locations and compliance certifications before shortlisting.
🔗
6. Check Integration Depth
The monitoring tool lives within an ecosystem: CI/CD, incident management (PagerDuty, OpsGenie), ITSM (ServiceNow, Jira), and communication (Slack, Teams). Shallow integrations create manual toil.
Expert Insight
Common mistake we see: Teams choose monitoring tools based on dashboard aesthetics during a demo. The real test is the alerting pipeline, the query language performance at scale, and the quality of documentation when something goes wrong at 2 AM. Always run a 30-day proof-of-concept with real traffic before committing.
Top 5 Mistakes When Choosing IT Infrastructure Monitoring Software
Based on our consulting engagements, these are the most costly errors engineering leaders make:
Monitoring everything by default: Collecting all metrics from all systems creates cardinality explosions that slow query performance and inflate costs. Start with SLI/SLO-aligned metrics.
Underestimating agent overhead: Heavyweight monitoring agents can consume 5–15% of host CPU on busy servers. Test agent resource consumption in your actual production environment.
Alert quantity over quality: Teams with 500+ active alerts respond to none of them. Audit and prune alert rules quarterly — aim for fewer than 20 actionable alerts per on-call shift.
Ignoring data retention costs: 13-month retention for compliance is standard, but storing high-resolution metrics for a year at scale can cost more than your monitoring platform license.
No ownership of dashboards: Beautiful dashboards that no one maintains become misleading over time. Assign dashboard owners and conduct quarterly reviews.
Gart Solutions — Infrastructure & DevOps Experts
Not Sure Which Monitoring Stack Is Right for You?
Our engineering team has designed, deployed, and optimized monitoring infrastructure for companies across healthcare, FinTech, and cloud-native startups.
🔍 Infrastructure Audit
⚙️ DevOps & SRE Services
☁️ Cloud Monitoring Setup
📊 Custom Observability Stacks
🚀 Kubernetes Monitoring
Get a Free Consultation →
See Our Monitoring Services
50+
Enterprise clients served
15+
Monitoring stacks deployed
99.9%
Avg. uptime achieved
3×
Faster MTTR after optimization
Fedir Kompaniiets
Co-founder & CEO, Gart Solutions · Cloud Architect & DevOps Consultant
Fedir is a technology enthusiast with over a decade of diverse industry experience. He co-founded Gart Solutions to address complex tech challenges related to Digital Transformation, helping businesses focus on what matters most — scaling. Fedir is committed to driving sustainable IT transformation, helping SMBs innovate, plan future growth, and navigate the "tech madness" through expert DevOps and Cloud managed services. Connect on LinkedIn.
In Closing: Building the Right Monitoring Foundation
The best IT infrastructure monitoring software is the one your team will actually use, trust, and act on. A perfectly configured open-source Prometheus stack that surfaces actionable SLO-aligned alerts will outperform an enterprise SaaS platform drowning your on-call rotation in noise.
The tools in this guide — from Datadog's cloud-native polish to Zabbix's battle-tested enterprise reliability — each represent a valid choice for a specific set of requirements. Use the comparison table, use-case framework, and decision criteria in this guide to build your shortlist, then validate with a real proof-of-concept.
If you want an expert perspective tailored to your infrastructure, our team at Gart Solutions is happy to help you navigate the options.
Reach out for a free consultation →
Revolutionize your IT infrastructure with our expert consulting! From seamless optimizations to robust security measures, we tailor solutions to elevate your technology backbone. Ready to transform?

In the relentless pursuit of success, businesses often find themselves caught in the whirlwind of IT infrastructure management. The demands of keeping up with ever-evolving technologies, maintaining robust security, and optimizing operations can feel like an uphill battle.
What is IT Infrastructure Outsourcing?
Imagine you’re running a marathon, but you’re also carrying your heavy backpack. That’s what managing IT infrastructure in-house often feels like for many companies. You’re trying to focus on winning the race (your business goals), but the weight of maintaining servers, networks, data centers, and security is slowing you down.
IT infrastructure outsourcing is like handing over that backpack to a professional support team running beside you. They carry it efficiently, ensuring everything inside remains organized, protected, and accessible, allowing you to focus solely on your pace and strategy.
At its core, IT infrastructure outsourcing means entrusting a specialized external provider with the management, maintenance, and optimization of your IT systems and hardware, including:
Servers and storage
Networks and connectivity
Data centers and cloud infrastructure
Security protocols and compliance requirements
Instead of managing all these internally, you leverage the expertise and resources of professionals dedicated solely to this domain.
Why is IT Infrastructure Outsourcing Becoming Essential Today?
Today’s business landscape demands agility, security, and innovation – all while keeping costs under control. Here’s why outsourcing IT infrastructure has shifted from being a strategic option to a critical necessity:
Rapid Technological AdvancementsIT evolves so fast that in-house teams struggle to keep up with emerging tools, frameworks, and security protocols. Outsourcing partners invest heavily in continuous skill upgrades, ensuring your business benefits from the latest advancements without the learning curve.
Cybersecurity Threats Are RisingThe sophistication of cyberattacks increases daily. Outsourcing ensures your infrastructure is protected by advanced threat detection systems and experts monitoring for vulnerabilities 24/7.
Need for Scalability and FlexibilityWhether it’s Black Friday traffic spikes or sudden global expansions, businesses must scale their IT resources seamlessly. Outsourcing provides elasticity without the delays and overhead of in-house provisioning.
Pressure to Focus on Core BusinessEvery hour spent fixing servers is an hour not spent innovating or delighting customers. Outsourcing allows businesses to focus on strategic initiatives while leaving technical operations to experts.
In essence, IT infrastructure outsourcing is not about relinquishing control – it’s about gaining freedom to drive your business forward faster.
Breaking Down IT Infrastructure Outsourcing
At its simplest, IT infrastructure outsourcing is the strategic delegation of your company’s IT infrastructure management to a trusted external provider. This includes:
Hardware management: Procuring, installing, configuring, and maintaining servers, storage devices, and network hardware.
Software management: Managing operating systems, infrastructure software, and middleware.
Network management: Ensuring secure, reliable, and optimized connectivity within and beyond your organization.
Security management: Implementing and maintaining cybersecurity measures to protect systems and data.
Cloud infrastructure management: Designing, deploying, and maintaining cloud resources in platforms like AWS, Azure, or Google Cloud.
It’s like hiring a specialized external team to maintain, upgrade, and optimize the entire “engine room” of your business so your internal teams can steer the ship confidently towards strategic goals.
Components Included in IT Infrastructure Outsourcing
Here’s a breakdown of what infrastructure outsourcing usually covers:
Servers:Physical and virtual servers host your applications, databases, and services.
Networks:LAN, WAN, VPNs, and connectivity solutions ensure data flows securely and efficiently.
Storage Systems:Data storage solutions, backup infrastructure, and disaster recovery planning.
Data Centers:Management of on-premises data centers or leveraging third-party colocation and cloud facilities.
Security Systems:Firewalls, intrusion detection and prevention, endpoint security, and compliance management.
Cloud Infrastructure:Public, private, or hybrid cloud management, including architecture design, resource provisioning, monitoring, and cost optimization.
By outsourcing these components, companies gain access to specialized expertise, advanced technologies, and robust security protocols without the overhead of building these capabilities internally.
Benefits of IT Infrastructure Outsourcing
Outsourcing IT infrastructure brings numerous benefits that contribute to business growth and success.
Manage Cloud Complexity
Over the past two years, there’s been a surge in cloud commitment, with more than 86% of companies reporting an increase in cloud initiatives.
Implementing cloud initiatives requires specialized skill sets and a fresh approach to achieve comprehensive transformation. Often, IT departments face skill gaps on the technical front, lacking experience with the specific tools employed by their chosen cloud provider.
Cloud migration and management aren’t as simple as clicking “deploy.” Each cloud provider (AWS, Azure, GCP) has unique architectures, tools, and services requiring specialized skills and certifications.
Many organizations lack the expertise needed to develop a cloud strategy that fully harnesses the potential of leading platforms such as AWS or Microsoft Azure, utilizing their native tools and services.
For instance:
AWS requires expertise in services like EC2, S3, RDS, Lambda, and VPC configurations.
Azure demands proficiency in Resource Groups, Virtual Networks, Azure AD, and cost management tools.
GCP needs knowledge of Compute Engine, Kubernetes Engine, Cloud Functions, and BigQuery integrations.
Without this expertise, companies risk:
Cost overruns due to improper provisioning
Security misconfigurations exposing critical data
Failed migrations disrupting business operations
Outsourcing to experienced infrastructure providers ensures cloud initiatives are implemented efficiently, securely, and cost-effectively.
Access to Specialized Expertise
Outsourcing IT infrastructure allows businesses to tap into the expertise of professionals who specialize in managing complex IT environments.
As a CTO, I understand the importance of having a skilled team that can handle diverse technology domains, from network management and system administration to cybersecurity and cloud computing.
Outsourcing partners bring in strategic cloud architecture design that aligns with your business goals:
Hybrid or multi-cloud setups for redundancy and compliance
Auto-scaling and elasticity to handle traffic spikes seamlessly
Disaster recovery and high availability architectures to minimize downtime risks
Cost optimization strategies like reserved instances, spot instances, and resource right-sizing
These capabilities are critical as over 86% of companies have increased their cloud initiatives in the last two years, according to Gartner, but lack in-house expertise to fully leverage them.
"Gart finished migration according to schedule, made automation for infrastructure provisioning, and set up governance for new infrastructure. They continue to support us with Azure. They are professional and have a very good technical experience"
Under NDA, Software Development Company
Enhanced Focus on Core Competencies
Outsourcing IT infrastructure liberates businesses from the burden of managing complex technical operations, allowing them to focus on their core competencies. I firmly believe that organizations thrive when they can allocate their resources towards activities that directly contribute to their strategic goals.
By entrusting the management and maintenance of IT infrastructure to a trusted partner like Gart, businesses can redirect their internal talent and expertise towards innovation, product development, and customer-centric initiatives.
For example, SoundCampaign, a company focused on their core business in the music industry, entrusted Gart with their infrastructure needs.
We upgraded the product infrastructure, ensuring that it was scalable, reliable, and aligned with industry best practices. Gart also assisted in migrating the compute operations to the cloud, leveraging its expertise to optimize performance and cost-efficiency.
One key initiative undertaken by Gart was the implementation of an automated CI/CD (Continuous Integration/Continuous Deployment) pipeline using GitHub. This automation streamlined the software development and deployment processes for SoundCampaign, reducing manual effort and improving efficiency. It allowed the SoundCampaign team to focus on their core competencies of building and enhancing their social networking platform, while Gart handled the intricacies of the infrastructure and DevOps tasks.
"They completed the project on time and within the planned budget. Switching to the new infrastructure was even more accessible and seamless than we expected."
Nadav Peleg, Founder & CEO at SoundCampaign
Cost Savings and Budget Predictability
Managing an in-house IT infrastructure can be a costly endeavor. By outsourcing, businesses can reduce expenses associated with hardware and software procurement, maintenance, upgrades, and the hiring and training of IT staff.
As an outsourcing provider, Gart has already made the necessary investments in infrastructure, tools, and skilled personnel, enabling us to provide cost-effective solutions to our clients. Moreover, outsourcing IT infrastructure allows businesses to benefit from predictable budgeting, as costs are typically agreed upon in advance through service level agreements (SLAs).
"We were amazed by their prompt turnaround and persistency in fixing things! The Gart's team were able to support all our requirements, and were able to help us recover from a serious outage."
Ivan Goh, CEO & Co-Founder at BeyondRisk
Scaling Quickly with Market Demands
Business is dynamic. Whether it’s expanding into new markets, onboarding thousands of new users overnight, or handling seasonal traffic spikes – your IT infrastructure must scale without delays or failures.
With outsourcing, companies have the flexibility to quickly adapt to these changing requirements. For example, Gart's clients have access to scalable resources that can accommodate their evolving needs.
Outsourcing partners provide:
Elastic server capacity: Add or remove resources instantly.
Flexible storage solutions: Expand databases or object storage without hardware procurement delays.
Network optimization: Enhance bandwidth and connectivity as user demands grow.
For example, Twilio scaled its COVID-19 contact tracing platform rapidly by outsourcing infrastructure to cloud providers. This automatic scaling ensured millions of people were contacted efficiently without infrastructure bottlenecks, a feat nearly impossible with only internal teams.
Whether it's expanding server capacity, optimizing network bandwidth, or adding storage, outsourcing providers can swiftly adjust the infrastructure to support business growth. This scalability and flexibility provide businesses with the agility necessary to respond to market dynamics and seize growth opportunities.
Robust Security Measures
Advanced Threat Detection and Proactive Security
Imagine guarding a fortress with outdated locks and untrained guards. That’s the risk many companies face managing security internally without dedicated resources.
Outsourcing IT infrastructure brings enterprise-level security expertise and tools within reach for businesses of all sizes. Here’s how:
24/7 Monitoring and Threat DetectionOutsourcing partners deploy advanced Security Information and Event Management (SIEM) tools, intrusion detection systems, and AI-powered threat analytics to monitor your infrastructure around the clock.
Regular Security Audits and Compliance AuditsThey conduct periodic vulnerability assessments, penetration testing, and compliance checks to ensure you meet industry standards like GDPR, HIPAA, and ISO 27001 without adding internal workload.
Data Encryption and Access ControlsProviders implement end-to-end encryption protocols for data at rest and in transit, along with strict identity and access management policies to control who accesses sensitive systems.
As the CTO of Gart, I prioritize the implementation of robust security measures, including advanced threat detection systems, data encryption, access controls, and proactive monitoring. We ensure that our clients' sensitive information remains protected from cyber threats and unauthorized access.
"The result was exactly as I expected: analysis, documentation, preferred technology stack etc. I believe these guys should grow up via expanding resources. All things I've seen were very good."
Grigoriy Legenchenko, CTO at Health-Tech Company
Piyush Tripathi About the Benefits of Outsourcing Infrastructure
Looking for answers to the question of IT infrastructure outsourcing pros and cons, we decided to seek the expert opinions on the matter. We reached out to Piyush Tripathi, who has extensive experience in infrastructure outsourcing.
Introducing the Expert
Piyush Tripathi is a highly experienced IT professional with over 10 years of industry experience. For the past ten years, he has been knee-deep in designing and maintaining database systems for significant projects. In 2020, he joined the core messaging team at Twilio and found himself at the heart of the fight against COVID-19. He played a crucial role in preparing the Twilio platform for the global vaccination program, utilizing innovative solutions to ensure scalability, compliance, and easy integration with cloud providers.
What are the potential benefits of IT infrastructure outsourcing?
High scale: I was leading Twilio COVID-19 platform to support contact tracing. This was a fairly quick announcement as the state of New York was planning to use it to help contact trace millions of people in the state and store their contact details. We needed to scale and scale fast. Doing it internally would have been very challenging, as demand could have spiked, and our response could not have been swift enough to respond. Outsourcing it to a cloud provider helped mitigate that; we opted for automatic scaling, which added resources in the infrastructure as soon as demand increased. This gave us peace of mind that even when we were sleeping, people would continue to get contacted and vaccinated.
Potential Risks and Benefits of IT Infrastructure Outsourcing
While outsourcing unlocks significant benefits, it’s important to be aware of potential risks:
Risks:
Infra domain knowledge: if you outsource infra, your team could lose knowledge of setting up this kind of technology. for example, during COVID 19, I moved the contact database from local to cloud so overtime I anticipate that next teams would loose context of setting up and troubleshooting database internals since they will only use it as a consumer.
Limited direct control: since you outsource infrastructure, data, business logic and access control will reside in the provider. in rare cases, for example using this data for ML training or advertising analysis, you may not know how your data or information is being used.
Vendor Lock-in:Relying heavily on a single outsourcing provider may create challenges if switching vendors later becomes necessary. Migrating away can be complex and costly.
Compliance Risks:Data privacy regulations require careful vendor selection. Not knowing how your vendor stores, processes, or uses your data could pose legal and reputational risks, especially for sectors like healthcare and finance.
Gains:
Lower maintenance: since you don't have to keep a whole team, you can reduce maintenance overhead. For example, during my project in 2020, I was trying to increase the adoption of Sendgrid SDK program, and we were able to send 50 billion emails without much maintenance hassle. The reason was that I was working on moving a lot of data pipelines, MTA components to the cloud and which reduced a lot of maintenance.
High scale: this is the primary benefit; traditional infrastructure needs people to plan and provision infrastructure in advance. When I led the project to move our database to the cloud, it was able to support storing a huge amount of data. In addition, it would automatically scale up and down depending on the demand. This was a huge benefit for us because we didn't have to worry that our provisioned infrastructure might not be enough for sudden spikes in demand. Due to this, we were able to help over 100+ million people worldwide get vaccinated.
What are the potential benefits for the internal IT team if they choose to outsource infrastructure?
Reduced Headcount: Outsourcing infrastructure could potentially decrease the need for staff dedicated to its maintenance and control, thus leading to a reduction in headcount within the internal IT team.
Increased Collaboration: If issues arise, the internal IT team will need to collaborate with the external vendor and abide by their policies. This process can create a new dynamic of interaction that the team must adapt to.
Limited Control: The IT team may face additional challenges in debugging issues or responding to audits due to the increased bureaucracy introduced by the vendor. This lack of direct control may impact the team's efficiency and response times.
Types of IT Infrastructure Outsourcing
Outsourcing isn’t a one-size-fits-all strategy. Here are the most common types:
Full Outsourcing
This involves outsourcing the entire IT infrastructure management to an external provider. The vendor handles:
Hardware and software procurement
Installation and configuration
Maintenance, monitoring, and optimization
Security and compliance
Best for:Small to mid-sized businesses that lack internal IT expertise or want to focus entirely on core business functions.
Managed Services
Here, businesses maintain ownership of their infrastructure but outsource specific operational tasks to managed service providers (MSPs), such as:
Network monitoring
Security management
Backup and disaster recovery
Best for:Companies that want to retain partial control but reduce operational burdens and ensure expert management of critical components.
Cloud Infrastructure Outsourcing
With cloud computing’s rise, many companies outsource cloud architecture design, deployment, optimization, and ongoing management to specialized partners.
Best for:Organizations migrating to AWS, Azure, or Google Cloud and lacking certified cloud architects internally to ensure cost-effective and secure deployments.
The Process for Outsourcing IT Infrastructure
Gart aims to deliver a tailored and efficient outsourcing solution for the client's IT infrastructure needs. The process encompasses thorough analysis, strategic planning, implementation, and ongoing support, all aimed at optimizing the client's IT operations and driving their business success.
Free Consultation
Project Technical Audit
Realizing Project Targets
Implementation
Documentation Updates & Reports
Maintenance & Tech Support
The process begins with a free consultation where Gart engages with the client to understand their specific IT infrastructure requirements, challenges, and goals. This initial discussion helps establish a foundation for collaboration and allows Gart to gather essential information for the project.
Then Gart conducts a comprehensive project technical audit. This involves a detailed analysis of the client's existing IT infrastructure, systems, and processes. The audit helps identify strengths, weaknesses, and areas for improvement, providing valuable insights to tailor the outsourcing solution.
Based on the consultation and technical audit, we here at Gart work closely with the client to define clear project targets. This includes establishing specific objectives, timelines, and deliverables that align with the client's business objectives and IT requirements.
The implementation phase involves deploying the necessary resources, tools, and technologies to execute the outsourcing solution effectively. Our experienced professionals manage the transition process, ensuring a seamless integration of the outsourced IT infrastructure into the client's operations.
Throughout the outsourcing process, Gart maintains comprehensive documentation to track progress, changes, and updates. Regular reports are generated and shared with the client, providing insights into project milestones, performance metrics, and any relevant recommendations. This transparent approach allows for effective communication and ensures that the project stays on track.
Gart provides ongoing maintenance and technical support to ensure the smooth operation of the outsourced IT infrastructure. This includes proactive monitoring, troubleshooting, and regular maintenance activities. In case of any issues or concerns, Gart's dedicated support team is available to provide timely assistance and resolve technical challenges.
Evaluating the Outsourcing Vendor: Ensuring Reliability and Compatibility
When evaluating an outsourcing vendor, it is important to conduct thorough research to ensure their reliability and suitability for your IT infrastructure outsourcing needs. Here are some steps to follow during the vendor checkup process:
Google Search
Begin by conducting a Google search of the outsourcing vendor's name. Explore their website, social media profiles, and any relevant online presence. A well-established outsourcing vendor should have a professional website that showcases their services, expertise, and client testimonials.
Industry Platforms and Directories
Check reputable industry platforms and directories such as Clutch and GoodFirms. These platforms provide verified reviews and ratings from clients who have worked with the outsourcing vendor. Assess their overall rating, read client reviews, and evaluate their performance based on past projects.
Read more: Gart Solutions Achieves Dual Distinction as a Clutch Champion and Global Winner
Freelance Platforms
If the vendor operates on freelance platforms like Upwork, review their profile and client feedback. Assess their ratings, completion rates, and feedback from previous clients. This can provide insights into their professionalism, technical expertise, and adherence to deadlines.
Online Presence
Explore the vendor's presence on social media platforms such as Facebook, LinkedIn, and Twitter. Assess their activity, engagement, and the quality of content they share. A strong online presence indicates their commitment to transparency and communication.
Industry Certifications and Partnerships
Check if the vendor holds any relevant industry certifications, partnerships, or affiliations.
Technical Expertise:Review their team’s skills across infrastructure domains – servers, networks, cloud, security, and automation.
Cultural Fit and Communication:Effective communication ensures smooth collaboration. Assess their language proficiency, time zone overlap, and responsiveness during initial consultations.
Scalability and Flexibility:Check if they can scale resources quickly to match your evolving business needs.
Service Level Agreements (SLAs):Evaluate guarantees on uptime, issue resolution times, data security, and exit processes.
By following these steps, you can gather comprehensive information about the outsourcing vendor's reputation, credibility, and capabilities. It is important to perform due diligence to ensure that the vendor aligns with your business objectives, possesses the necessary expertise, and can be relied upon to successfully manage your IT infrastructure outsourcing requirements.
Why Ukraine is an Attractive Outsourcing Destination for IT Infrastructure
Ukraine has emerged as a prominent player in the global IT industry. With a thriving technology sector, it has become a preferred destination for outsourcing IT infrastructure needs.
Ukraine is renowned for its vast pool of highly skilled IT professionals. The country produces a significant number of IT graduates each year, equipped with strong technical expertise and a solid educational background. Ukrainian developers and engineers are well-versed in various technologies, making them capable of handling complex IT infrastructure projects with ease.
One of the major advantages of outsourcing IT infrastructure to Ukraine is the cost-effectiveness it offers. Compared to Western European and North American countries, the cost of IT services in Ukraine is significantly lower while maintaining high quality. This cost advantage enables businesses to optimize their IT budgets and allocate resources to other critical areas.
English proficiency is widespread among Ukrainian IT professionals, making communication and collaboration seamless for international clients. This proficiency eliminates language barriers and ensures effective knowledge transfer and project management. Additionally, Ukraine shares cultural compatibility with Western countries, enabling smoother integration and understanding of business practices.
Long Story Short
IT infrastructure outsourcing empowers organizations to streamline their IT operations, reduce costs, enhance performance, and leverage external expertise, allowing them to focus on their core competencies and achieve their strategic goals.
By delegating complex infrastructure management to specialized providers, businesses can:
Access advanced expertise and technologies
Scale flexibly with market demands
Strengthen cybersecurity and compliance
Focus internal teams on strategic innovation
Optimize costs with predictable budgets
In a world where digital resilience defines market leadership, outsourcing IT infrastructure is your ticket to agility, efficiency, and sustainable success.
Ready to unlock the full potential of your IT infrastructure through outsourcing? Reach out to us and let's embark on a transformative journey together!