Green Clouds — cloud infrastructure that runs on renewable energy, minimizes idle waste, and actively tracks carbon output — have shifted from a sustainability buzzword to a board-level business requirement in 2026. If you are a CTO, CIO, or engineering leader evaluating cloud strategy, this guide gives you the frameworks, tools, and operational playbooks to make your cloud infrastructure measurably greener without sacrificing performance or cost efficiency.
Global data center energy consumption now accounts for 2.5% of worldwide CO2 emissions — more than the aviation industry. Yet most organizations have no idea how much carbon their cloud workloads actually emit, let alone a plan to reduce it. That gap is exactly what green cloud computing addresses: shifting from good intentions to measurable, operational sustainability embedded directly into your infrastructure decisions.
At Gart Solutions, we work with engineering teams across Europe and North America to make cloud infrastructure both cost-efficient and environmentally accountable. This article shares what we have learned — including the mistakes organizations consistently make, the tools that actually deliver results, and how to build a green cloud strategy that satisfies ESG reporting requirements without adding operational overhead.
The Environmental Impact of Cloud Computing
Energy Consumption and Carbon Emissions
Traditional cloud data centers, composed of extensive server farms, consume vast amounts of electricity. These centers often rely on fossil fuels, exacerbating greenhouse gas emissions. Reports suggest that the energy used by data centers worldwide accounts for approximately 1% of global electricity consumption, with this figure expected to rise.
- Cooling Systems: A significant portion of energy usage in these data centers is attributed to cooling systems, which regulate server temperatures.
- Carbon Footprint: The reliance on non-renewable energy sources amplifies the environmental toll, contributing significantly to climate change.
Resource Depletion and E-Waste
Beyond energy concerns, the manufacturing and decommissioning of hardware lead to resource depletion and electronic waste (e-waste). An estimated 50 million tons of e-waste are generated globally each year, highlighting the urgency for sustainable lifecycle management of cloud infrastructure.
Water Usage
Data centers also consume substantial amounts of water for cooling, which places stress on local water resources, further exacerbating their environmental footprint.
Why Cloud is More Affordable
Cloud computing transforms the landscape of IT services, moving away from traditional desktop setups to remote data centers. Users can effortlessly access on-demand infrastructure, eliminating the need for on-site installation and maintenance.
Green cloud computing takes this concept a step further by utilizing renewable energy sources, reducing energy consumption, and making a significant dent in the carbon footprint.
Virtualization and containerization, dividing hardware for deploying multiple operating systems, help reduce server needs and energy consumption. AI-based resource scheduling, guided by historical usage data, conserves energy. Infrastructure as a Service (IaaS) optimization, focusing on virtual machines and containers, contributes to eco-conscious IT.
A notable 2020 study revealed an interesting trend: despite a 550% increase in computing output, data center energy consumption only grew by 6%. This underscores the efficiency achieved through sustainable practices in cloud computing.
Ready to embrace the benefits of cloud migration? Contact Gart today, and let us guide you through a seamless transition to the cloud. The time is now to elevate your operations and embrace the future of digital efficiency.
Why Green Clouds Matter for Your Business in 2026
Three forces converged in 2025-2026 to push green cloud computing from “nice to have” to a genuine business driver:
- Regulatory pressure: The EU Corporate Sustainability Reporting Directive (CSRD) and SEC climate disclosure rules now require enterprises to report Scope 1, 2, and 3 emissions — including cloud infrastructure usage.
- Enterprise buyer requirements: Procurement teams at large enterprises increasingly include carbon reporting requirements in vendor questionnaires, making sustainability data a sales prerequisite.
- Investor scrutiny: ESG scores directly affect access to capital and valuation multiples, particularly for Series B+ technology companies seeking institutional investment.
- Cost alignment: Green cloud practices — rightsizing, autoscaling, spot instances — reduce idle waste that is simultaneously bad for the environment and for your AWS bill.
Key insight: Green cloud is not a separate initiative competing with cost optimization or reliability engineering. In practice, the same practices that reduce idle resource waste — autoscaling, rightsizing, efficient scheduling — also reduce carbon emissions. Sustainability and FinOps are two lenses on the same operational problem.
Organizations that integrate carbon accountability into cloud governance today gain a significant competitive advantage: they satisfy regulatory requirements, win enterprise deals, and operate more efficiently — simultaneously. For more on the business case, our analysis of cloud migration’s financial benefits covers the ROI picture in detail.
Is Cloud Actually Greener Than On-Premises?
The short answer is yes — in most cases, by a significant margin. But the specifics matter for your ESG reporting, so here is the honest breakdown.
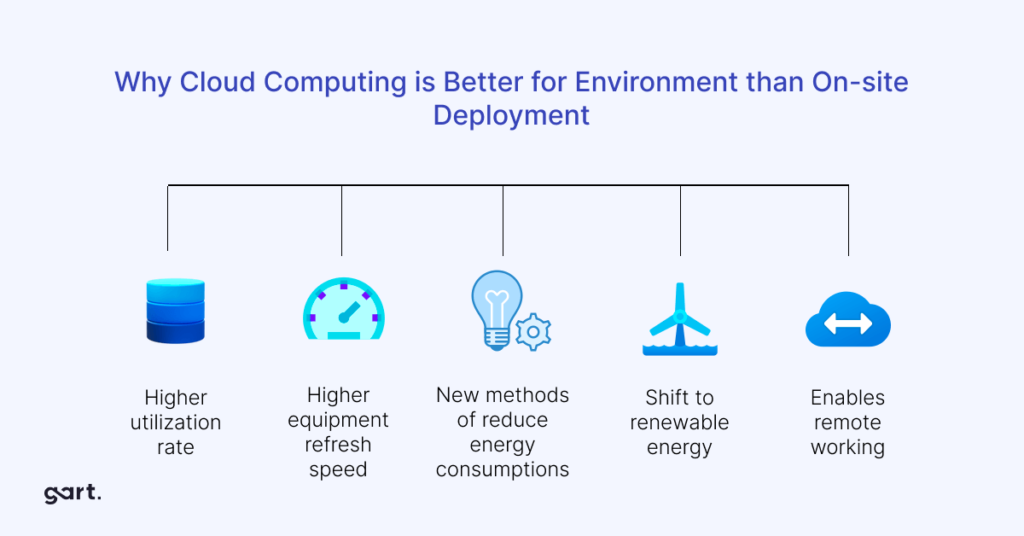
Hyperscale data centers operated by AWS, Azure, and Google Cloud run at Power Usage Effectiveness (PUE) ratios of 1.1-1.2, meaning they use only 10-20% overhead energy for cooling and infrastructure. The average enterprise data center runs at PUE 1.5-2.0, using 50-100% overhead energy on top of compute. Combined with renewable energy procurement at scale, this creates a material and measurable carbon advantage for properly architected cloud workloads.
| Factor | Typical Enterprise Data Center | Hyperscale Cloud (AWS/Azure/GCP) |
|---|---|---|
| Power Usage Effectiveness (PUE) | 1.5 – 2.0 | 1.1 – 1.2 |
| Average server utilization | 10 – 15% | 65 – 80% |
| Renewable energy share | Typically 0 – 30% | 100% (committed by 2025-2030) |
| Cooling technology | CRAC units, legacy air cooling | Liquid cooling, AI-driven optimization |
| Hardware refresh cycle | 5-7 years (manual procurement) | 3-4 years (continuous efficiency gains) |
| Carbon reduction potential | Baseline reference | 80-96% vs on-prem (451 Research) |
| Water usage tracking | High, rarely monitored | Actively tracked; all providers targeting net-zero water by 2030 |
Important caveat for ESG reporting: Cloud migration reduces your carbon footprint on average — but the actual reduction varies significantly by workload, cloud region, and modernization depth. A lift-and-shift of an oversized, poorly optimized workload achieves less than a rightsized, cloud-native deployment. Always validate reduction claims with workload-level data before publishing ESG disclosures.
How to Measure Your Cloud Carbon Footprint
You cannot reduce what you do not measure. Cloud carbon measurement has matured significantly in the past two years. Provider-native tools are free, require no configuration, and can be integrated into your existing observability stack in less than a day of engineering effort.
Provider-Native Carbon Measurement Tools
AWS Customer Carbon Footprint Tool
Covers Scope 1, 2, and 3 emissions from AWS service usage. Available free in the AWS Billing Console. Shows estimated emissions reduction vs on-premises. Updates monthly.
Emissions Impact Dashboard
Available for Microsoft 365 and Azure workloads. Provides datacenter PUE and renewable energy percentage per region. Integrates with Microsoft Cloud for Sustainability platform.
Google Cloud Carbon Footprint
Displays gross carbon emissions by project, service, and region. Covers Scope 1, 2, and 3. Integrated into Google Cloud Console. Updates monthly.
Cloud Carbon KPIs to Track Monthly
- gCO2eq per compute-hour — normalizes emissions across instance types and regions for fair comparison
- Carbon intensity by region — which of your regions run on a higher share of renewable energy
- Idle resource carbon waste — emissions attributable to over-provisioned or unused infrastructure
- Renewable energy percentage — share of workloads running in 100% renewable-energy cloud regions
- Carbon efficiency score — gCO2eq emitted per unit of business output (API calls, transactions, active users)
Quick Win
Enable the AWS Customer Carbon Footprint Tool today — it requires zero configuration and delivers a baseline Scope 1/2/3 report within minutes. For multi-cloud visibility, the open-source Cloud Carbon Footprint project provides unified dashboards across AWS, Azure, and GCP without any vendor lock-in.
Green Cloud Strategies That Actually Reduce Emissions
The following strategies are ranked by carbon reduction potential and practical implementation effort. These are the tactics we apply in client engagements at Gart — not theoretical frameworks, but operational playbooks that produce measurable, reportable results.
Rightsize First — Eliminate Idle Carbon Before Anything Else
The average enterprise cloud environment runs at 15-25% average CPU utilization. Every idle CPU cycle is wasted compute energy. Use AWS Compute Optimizer, Azure Advisor, or GCP Recommender to identify over-provisioned instances and rightsize to actual utilization before any other green initiative. This single step typically reduces cloud carbon 20-40%.
Deploy to Low-Carbon Regions
Cloud regions vary significantly in electricity grid carbon intensity. AWS eu-west-1 (Ireland) runs on substantially more renewable energy than us-east-1 (Northern Virginia) at certain times. For latency-tolerant workloads, region selection is often the highest-leverage carbon reduction decision you can make — with zero architectural changes required.
Implement Carbon-Aware Workload Scheduling
Batch jobs, ML training pipelines, and data processing workloads are flexible on timing. The Green Software Foundation’s Carbon Aware SDK provides real-time carbon intensity data for all major cloud regions, enabling automated scheduling of flexible workloads to run when and where the grid is greenest.
Use Spot and Preemptible Instances for Flexible Workloads
Spot and preemptible instances run on otherwise-idle cloud capacity — consuming resources that would emit carbon regardless. For fault-tolerant workloads such as batch processing, ML training, and CI/CD pipelines, they deliver 70-90% cost savings and improve overall resource utilization efficiency across the cloud provider’s fleet.
Containerize and Optimize with Kubernetes
Container workloads achieve significantly higher server utilization than VMs. A well-tuned Kubernetes cluster running at 70%+ resource utilization emits substantially less carbon per unit of compute than a fleet of half-utilized VMs. Green Kubernetes optimization — bin packing, node autoscaling with Karpenter, and Spot node groups — is one of the highest-ROI green cloud investments.
Migrate to ARM/Graviton Processors
AWS Graviton3, Google Tau, and Azure Ampere processors deliver equivalent performance at 40-60% lower power draw compared to traditional x86 instances. For workloads that are compatible with ARM architecture — which is the majority of modern containerized applications — this is a direct carbon and cost reduction with minimal migration effort.
AWS vs Azure vs Google Cloud: Sustainability Comparison 2026
All three hyperscalers have made serious sustainability commitments — but their approaches, tools, and progress toward those commitments differ in ways that matter for teams making cloud provider decisions with ESG requirements in scope.
| Criterion | AWS | Microsoft Azure | Google Cloud |
|---|---|---|---|
| Renewable energy status | 100% renewable across 19 regions (reached 2023) | 100% renewable by 2025; carbon negative by 2030 | Carbon-neutral since 2007; 24/7 carbon-free by 2030 |
| Net-zero target | Net-zero Scope 1, 2 & 3 by 2040 (Climate Pledge) | Remove all historical carbon by 2050 | Net-zero across all emissions by 2030 |
| Carbon measurement tool | AWS Customer Carbon Footprint Tool | Emissions Impact Dashboard; Cloud for Sustainability | Google Cloud Carbon Footprint (Console) |
| Water commitment | Water Positive by 2030 | Water Positive by 2030; WUE published by region | Replenish 120% of water consumed by 2030 |
| Carbon-aware region data | Emerging via Sustainability Pillar guidance | Published datacenter carbon intensity data | Real-time carbon-free energy % by region in Console |
| Hardware circularity | Asset refurbishment and lifecycle management | Circular Centers — server repurposing; zero waste by 2030 | Server refurbishment; continuous chip efficiency R&D |
| Best for | Organizations already deep in the AWS ecosystem | Enterprises with Microsoft 365 and Azure AD investment | Teams prioritizing 24/7 carbon-free accuracy and data transparency |
Google: Carbon-Free Operations, Water Conservation, and Cloud Sustainability
Google aims to power all its global operations with 100% carbon-free energy around the clock by 2030. They achieved carbon-neutrality in 2007 and have been using renewable energy for their data centers since 2017.
The company invests in technology for carbon removal solutions to offset its emissions. Google also has a goal to replenish 120% of the water consumed in its data centers and facilities.
Public cloud services, like Google’s, rely on energy-efficient hyperscale data centers. These centers outperform smaller servers thanks to innovative infrastructure design and advanced cooling tech. Operating in a Google data center reduces electricity needs for IT hardware, leading to higher power usage effectiveness (PUE) compared to typical enterprise data centers.
Google Cloud not only prioritizes sustainability in its operations but also offers the Carbon Footprint tool for customers. This tool allows users to monitor and measure carbon emissions from their cloud applications, covering Scope 1, 2, and 3. It serves as an emissions calculator, aiding companies in reporting their gross carbon footprint and offering best practices for building low-carbon applications in Google Cloud.
Read more: Google Cloud Migration Services
Microsoft: Pioneering Carbon Reduction, Circular Solutions, and Cloud Sustainability
Microsoft aims to cut carbon emissions by over 50% by 2030 and eliminate its historical carbon footprint by 2050. They’re shifting to 100% renewable energy for data centers and buildings by 2025, and zero waste is on the agenda by 2030.
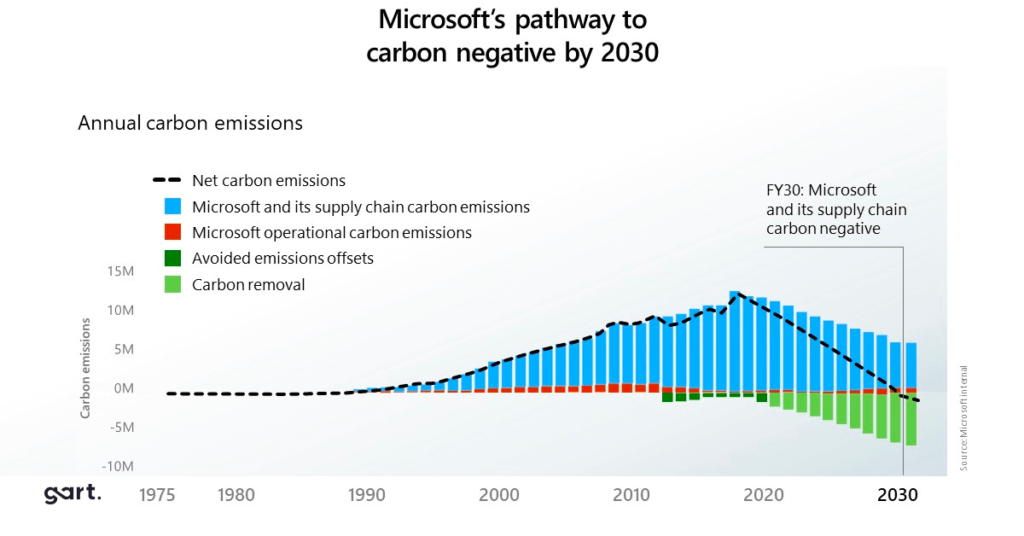
Circular Centers repurpose old servers to combat growing e-waste, introduced as part of Microsoft’s sustainability strategy since 2020.
Tools like Microsoft Cloud for Sustainability offer real-time insights into carbon emissions, while the Emissions Impact Dashboard for Microsoft 365 calculates cloud workload footprints.
Microsoft’s focus areas include lowering energy consumption, green data centers, water management, and waste reduction through responsible sourcing and recycling.
Four key drivers reduce the energy and carbon footprint of the Microsoft Cloud: IT operational efficiency, equipment efficiency, datacenter infrastructure efficiency, and new renewable electricity, targeting 100% by 2025.
Read more: Azure Migration Services
Amazon: Leading the Charge with Net-Zero Commitment and Sustainable Solutions
As a co-founder of The Climate Pledge, Amazon joins 400 global companies committed to achieving net-zero carbon emissions by 2040. Their strategies include reducing material usage, innovating for energy efficiency, and embracing renewable energy solutions.
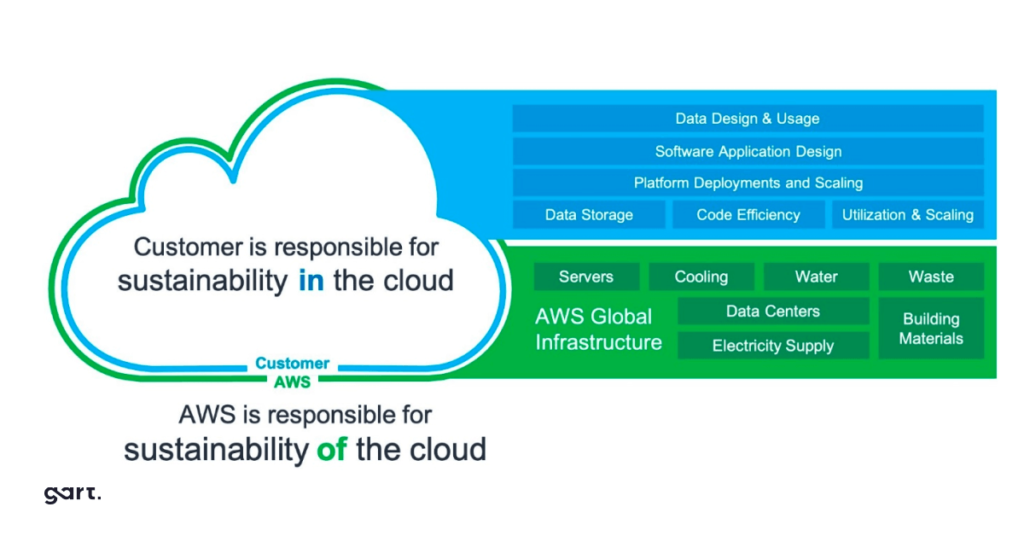
Amazon, the largest corporate buyer of renewable energy since 2020, leads in sustainable practices to decarbonize its transportation network.
A study by 451 Research found that US enterprises, on average, could cut their carbon footprint by up to 88% by moving to AWS from on-premises data centers.
Amazon introduces the AWS Customer Carbon Footprint Tool, an emissions calculator for customers. It provides data on carbon footprint, including Scope 1 and Scope 2 emissions from cloud service usage. It also estimates the carbon emission reduction achieved by transitioning operations to the cloud.
Read more: AWS Migration Services
For deeper guidance on migrating to each provider, see: AWS Migration Services · Azure Migration Services · Google Cloud Migration Services
GreenOps: Embedding Sustainability into Cloud Operations
GreenOps is the operational discipline of tracking and reducing cloud carbon alongside cost and reliability — treating gCO2eq as a first-class engineering metric, not an afterthought in an annual sustainability report. The Cloud Native Computing Foundation (CNCF) Environmental Sustainability TAG provides open standards and tooling for teams implementing GreenOps at scale.
Green DevOps Practices with Measurable Carbon Impact
| DevOps Practice | Carbon Reduction Mechanism | Typical Impact |
|---|---|---|
| Kubernetes node autoscaling | Eliminates idle node capacity during low-traffic periods | 30-60% reduction in baseline compute emissions |
| Environment scheduling (dev/test) | Auto-shutdown non-prod environments at nights and weekends | Up to 65% reduction in dev/test carbon waste |
| Infrastructure as Code (IaC) | Eliminates configuration drift and over-provisioning at deployment | 15-30% reduction in provisioning waste |
| Container image optimization | Smaller images — faster cold starts, less idle compute during scale events | 10-25% reduction in container runtime emissions |
| Graviton/ARM instance migration | ARM processors deliver equivalent performance at 40% lower power draw | Up to 40% reduction in compute-related emissions |
| CI/CD pipeline efficiency | Parallel testing, caching, and artifact optimization reduce build infrastructure carbon | 20-40% reduction in CI/CD emissions |
“In every cloud environment we audit, the single largest source of wasted carbon is the same as the largest source of wasted cost: idle and over-provisioned resources. Rightsizing is not a sustainability project — it is good engineering. We just need to start measuring it in both dollars and grams of CO2.”— Fedir Kompaniiets, Co-founder & DevOps Expert, Gart Solutions
FinOps and Sustainability: Two Goals, One Strategy
The FinOps Foundation added sustainability as a formal pillar of the FinOps framework in 2024, recognizing that carbon optimization and cost optimization share the same root causes. The table below maps FinOps practices to their direct carbon impact — making the case for treating these as a unified program rather than parallel initiatives:
| FinOps Practice | Cost Impact | Carbon Impact |
|---|---|---|
| Rightsizing instances | 15-40% compute cost reduction | Proportional reduction in Scope 2 emissions |
| Spot / preemptible instances | 70-90% discount vs on-demand | Improves fleet utilization = lower per-unit carbon |
| Resource tagging and cost allocation | 20-35% waste reduction over 12 months | Enables carbon-by-team visibility and accountability |
| Scheduled dev/test shutdown | Up to 65% dev/test environment savings | Direct elimination of idle compute carbon |
| Storage lifecycle policies | 40-95% storage cost reduction | Reduces data center storage hardware demand |
| Graviton/ARM migration | 20-30% compute cost savings | 40% reduction in processor-level power draw |
Our AWS cost optimization guide covers the tactical implementation of these FinOps practices in detail, with concrete savings estimates for each technique.
How AI Workloads Affect Cloud Carbon Emissions
AI workloads represent one of the fastest-growing sources of cloud carbon emissions. Training a large foundation model can emit hundreds of tonnes of CO2 — comparable to the lifetime emissions of multiple vehicles. Inference workloads are more manageable but accumulate significantly at scale. Engineering leaders need a deliberate strategy for AI’s cloud carbon footprint before it becomes a material ESG reporting problem.
- Train in carbon-light regions: Google Cloud publishes real-time carbon-free energy percentages by region — use this data to schedule GPU training jobs dynamically rather than defaulting to the nearest or cheapest region.
- Use spot and preemptible GPU instances: Large training runs on spot GPU instances (P3, A100, H100) reduce both cost and carbon intensity per training step by 70-90% for fault-tolerant workloads.
- Apply quantization and distillation: Reducing model precision (INT8, INT4) and distilling large models to smaller task-specific versions reduces inference compute requirements by 4-10x with minimal accuracy loss for most production use cases.
- Cache inference results semantically: For repetitive queries — chatbots, search, recommendations — semantic caching reduces redundant inference compute by 30-60%, with direct carbon and cost benefit.
- Carbon-aware training scheduling: The Green Software Foundation’s Carbon Aware SDK enables automatic scheduling of training runs during hours of peak renewable availability in your target region.
Gart Case Study: 32% Cloud Carbon Reduction for a SaaS Platform
Green Cloud Optimization for a European B2B SaaS Platform
A 120-person SaaS company running on AWS eu-west-1 engaged Gart Solutions after receiving ESG questionnaires from three enterprise clients requiring documented Scope 3 emissions reporting. Their infrastructure was running at 18% average CPU utilization across a fleet of on-demand EC2 instances — a common pattern in organizations that grew fast and never stopped to right-size.
What we did: Migrated from on-demand EC2 to a Kubernetes cluster on Graviton3 instances with Karpenter node autoscaling, moved all batch processing to Spot instances, implemented automated dev/test environment shutdown on weeknights and weekends, migrated ML inference endpoints to AWS Lambda, and established monthly carbon reporting via the AWS Customer Carbon Footprint Tool tied to engineering OKRs. Total engineering effort: 11 weeks, zero production downtime.
Sustainable Cloud Architecture: A Practical Framework
The AWS Well-Architected Sustainability Pillar and the Green Software Foundation’s Software Carbon Intensity (SCI) specification together provide a consistent, auditable framework for sustainability assessments. We apply both in client engagements to ensure recommendations are grounded in recognized industry standards.
- Understand your impact: Establish a carbon baseline using provider tools before any optimization work. You need a measurable starting point to demonstrate reduction progress in ESG reports.
- Set sustainability goals tied to engineering KPIs: A carbon reduction target (e.g., 30% reduction in 12 months) becomes actionable when it is expressed as gCO2eq per transaction — something engineering teams can directly influence.
- Maximize utilization: Drive instance, cluster, and function utilization as high as reliability constraints allow. Idle capacity is the primary source of avoidable cloud carbon.
- Adopt more efficient offerings continuously: Graviton3, serverless, and managed container services consistently deliver better performance-per-watt than their predecessors. Build adoption into your standard upgrade cycle.
- Use managed services strategically: AWS RDS, EKS, and serverless functions are operated at higher efficiency than self-managed equivalents. The carbon overhead of management tooling is absorbed by the provider’s scale.
- Reduce downstream impact: Optimize API payloads, image sizes, and content delivery architecture to reduce the energy consumed by clients and CDN layers accessing your services.
Conceptual Frameworks for Green Clouds
There are several frameworks that provide a structured roadmap for sustainable cloud computing:
- Ecological Modernization Theory
- Triple Bottom Line (TBL)
- Life Cycle Assessment (LCA)
Ecological Modernization Theory
Ecological Modernization Theory (EMT) emphasizes that technological advancement, rather than being a threat to the environment, can align with ecological objectives. The framework promotes leveraging innovation to minimize environmental impact while maintaining or enhancing efficiency.
In cloud infrastructures, this theory supports the integration of eco-friendly practices such as:
- Adoption of energy-efficient hardware.
- Investment in advanced cooling systems.
- Use of renewable energy sources for powering data centers.
Cloud service providers can modernize their operations to reduce energy consumption and carbon footprints while maintaining service quality and scalability.
Triple Bottom Line (TBL)
The TBL framework evaluates sustainability across three dimensions: economic, social, and environmental. In the context of cloud computing, it offers a balanced perspective to achieve sustainability goals:
- Economic Dimension: Ensures the financial viability of sustainable practices, such as reducing operational costs through energy-efficient technologies.
- Social Dimension: Encourages corporate social responsibility by promoting awareness and equitable practices in communities where data centers operate.
- Environmental Dimension: Prioritizes minimizing the ecological footprint through renewable energy integration, efficient resource usage, and e-waste management.
The TBL approach promotes a holistic view, ensuring that economic growth in the cloud industry does not come at the expense of environmental or social well-being.
Life Cycle Assessment (LCA)
LCA examines the environmental impact of cloud computing across its entire lifecycle, from raw material extraction to disposal. This detailed analysis helps identify the stages where intervention is most needed:
Stages in LCA:
- Raw Material Extraction: Assessing the environmental costs of producing hardware components.
- Manufacturing: Evaluating emissions and resource use during production.
- Deployment and Operation: Measuring energy and water consumption during active use.
- End-of-Life Management: Analyzing the ecological impact of decommissioning and recycling infrastructure components.
By understanding these stages, cloud providers can implement targeted strategies to mitigate the environmental impact, such as sourcing sustainable materials and adopting energy-efficient operations.
Empower Your Green Transition
Ready to take the leap into the public cloud? Before you dive in, a word of advice: Cloud migration is more than a simple “lift and shift.” It requires a strategic approach, choosing the right vendor, ensuring infrastructure readiness, and aligning IT and business objectives.
However, the investment in this transition pays off. Shifting operations to the public cloud and prioritizing cloud-based applications can potentially reduce global emissions and energy consumption by up to 20 percent.
Feeling inspired to make a positive impact? Now’s the time to act. Contact Gart, and we’ll guide you through the migration process. Let’s contribute to a greener future together!
Ready to Make Your Cloud Infrastructure Measurably Greener?
We help engineering teams in Europe and North America reduce cloud carbon footprint and infrastructure costs simultaneously — through rightsizing, green Kubernetes optimization, FinOps integration, and ESG-ready carbon reporting that satisfies enterprise and investor requirements.